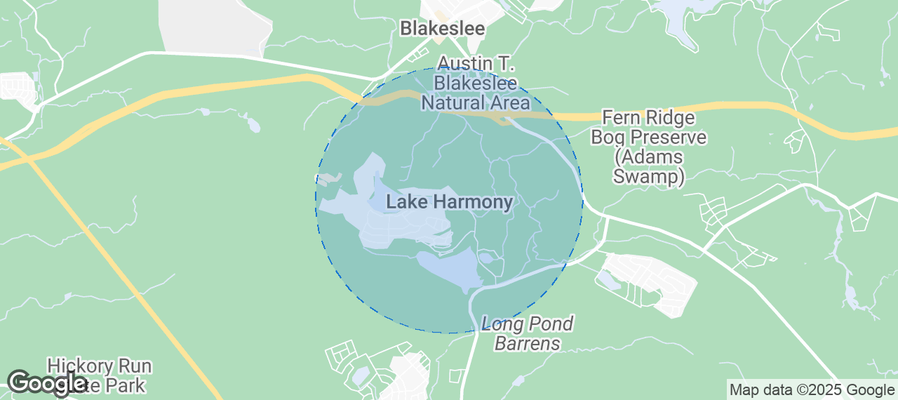
Lake Harmony Airbnb Market Analysis 2026: Short Term Rental Data & Vacation Rental Statistics in Pennsylvania, United States
Is Airbnb profitable in Lake Harmony in 2026? Explore comprehensive Airbnb analytics for Lake Harmony, Pennsylvania, United States to uncover income potential. This 2026 STR market report for Lake Harmony, based on AirROI data from February 2025 to January 2026, reveals key trends in the niche market of 46 active listings.
Whether you're considering an Airbnb investment in Lake Harmony, optimizing your existing vacation rental, or exploring rental arbitrage opportunities, understanding the Lake Harmony Airbnb data is crucial. Leveraging the low regulation environment is key to maximizing your short term rental income potential. Let's dive into the specifics.
Key Lake Harmony Airbnb Performance Metrics Overview
Monthly Airbnb Revenue Variations & Income Potential in Lake Harmony (2026)
Understanding the monthly revenue variations for Airbnb listings in Lake Harmony is key to maximizing your short term rental income potential. Seasonality significantly impacts earnings. Our analysis, based on data from the past 12 months, shows that the peak revenue month for STRs in Lake Harmony is typically December, while May often presents the lowest earnings, highlighting opportunities for strategic pricing adjustments during shoulder and low seasons. Explore the typical Airbnb income in Lake Harmony across different performance tiers:
- Best-in-class properties (Top 10%) achieve $9,320+ monthly, often utilizing dynamic pricing and superior guest experiences.
- Strong performing properties (Top 25%) earn $6,028 or more, indicating effective management and desirable locations/amenities.
- Typical properties (Median) generate around $3,737 per month, representing the average market performance.
- Entry-level properties (Bottom 25%) see earnings around $2,068, often with potential for optimization.
Average Monthly Airbnb Earnings Trend in Lake Harmony
Lake Harmony Airbnb Occupancy Rate Trends (2026)
Maximize your bookings by understanding the Lake Harmony STR occupancy trends. Seasonal demand shifts significantly influence how often properties are booked. Typically, Augustsees the highest demand (peak season occupancy), while May experiences the lowest (low season). Effective strategies, like adjusting minimum stays or offering promotions, can boost occupancy during slower periods. Here's how different property tiers perform in Lake Harmony:
- Best-in-class properties (Top 10%) achieve 57%+ occupancy, indicating high desirability and potentially optimized availability.
- Strong performing properties (Top 25%) maintain 43% or higher occupancy, suggesting good market fit and guest satisfaction.
- Typical properties (Median) have an occupancy rate around 29%.
- Entry-level properties (Bottom 25%) average 20% occupancy, potentially facing higher vacancy.
Average Monthly Occupancy Rate Trend in Lake Harmony
Average Daily Rate (ADR) Airbnb Trends in Lake Harmony (2026)
Effective short term rental pricing strategy in Lake Harmony involves understanding monthly ADR fluctuations. The Average Daily Rate (ADR) for Airbnb in Lake Harmony typically peaks in December and dips lowest during September. Leveraging Airbnb dynamic pricing tools or strategies based on this seasonality can significantly boost revenue. Here's a look at the typical nightly rates achieved:
- Best-in-class properties (Top 10%) command rates of $897+ per night, often due to premium features or locations.
- Strong performing properties (Top 25%) achieve nightly rates of $555 or more.
- Typical properties (Median) charge around $365 per night.
- Entry-level properties (Bottom 25%) earn around $266 per night.
Average Daily Rate (ADR) Trend by Month in Lake Harmony
Get Live Lake Harmony Market Intelligence 👇
Explore Real-time Analytics
Airbnb Seasonality Analysis & Trends in Lake Harmony (2026)
Peak Season (December, August, January)
- Revenue averages $6,523 per month
- Occupancy rates average 40.1%
- Daily rates average $531
Shoulder Season
- Revenue averages $3,696 per month
- Occupancy maintains around 28.3%
- Daily rates hold near $479
Low Season (February, March, April)
- Revenue drops to average $0 per month
- Occupancy decreases to average 0.0%
- Daily rates adjust to average $455
Seasonality Insights for Lake Harmony
- The Airbnb seasonality in Lake Harmony shows highly seasonal trends requiring careful strategy. While the sections above show seasonal averages, it's also insightful to look at the extremes:
- During the high season, the absolute peak month showcases Lake Harmony's highest earning potential, with monthly revenues capable of climbing to $7,646, occupancy reaching a high of 48.8%, and ADRs peaking at $608.
- Conversely, the slowest single month of the year, typically falling within the low season, marks the market's lowest point. In this month, revenue might dip to $0, occupancy could drop to 0.0%, and ADRs may adjust down to $422.
- Understanding both the seasonal averages and these monthly peaks and troughs in revenue, occupancy, and ADR is crucial for maximizing your Airbnb profit potential in Lake Harmony.
Seasonal Strategies for Maximizing Profit
- Peak Season: Maximize revenue through premium pricing and potentially longer minimum stays. Ensure high availability.
- Low Season: Offer competitive pricing, special promotions (e.g., extended stay discounts), and flexible cancellation policies. Target off-season travelers like remote workers or budget-conscious guests.
- Shoulder Seasons: Implement dynamic pricing that balances peak and low rates. Target weekend travelers or specific events. Offer slightly more flexible terms than peak season.
- Regularly analyze your own performance against these Lake Harmony seasonality benchmarks and adjust your pricing and availability strategy accordingly.
Best Areas for Airbnb Investment in Lake Harmony (2026)
Exploring the top neighborhoods for short-term rentals in Lake Harmony? This section highlights key areas, outlining why they are attractive for hosts and guests, along with notable local attractions. Consider these locations based on your target guest profile and investment strategy.
| Neighborhood / Area | Why Host Here? (Target Guests & Appeal) | Key Attractions & Landmarks |
|---|---|---|
| Lake Harmony | A popular four-season destination known for its beautiful lake and outdoor activities. Attracts families and adventure seekers looking for a relaxing getaway with opportunities for water sports, hiking, and skiing in the winter. | Lake Harmony, Big Boulder Ski Area, Jack Frost Mountain, Pinecrest Lake, Hickory Run State Park, Kalahari Resorts |
| Split Rock | A scenic area near Lake Harmony with large resorts and close proximity to outdoor recreational activities. Ideal for guests seeking a tranquil retreat that is still convenient to local attractions and amenities. | Split Rock Resort, Lake Harmony, Golfing at the Split Rock Golf Club, Indoor water park at Split Rock, Hiking trails |
| Poconos Mountains | A renowned mountain range offering scenic beauty and a variety of outdoor activities year-round. Attracts tourists looking for adventure, romance, and relaxation, especially during seasonal events. | Hiking and biking trails, Waterfalls and scenic viewpoints, Adventure parks (such as Camelback Mountain), Ski resorts, Waterparks, Fishing and boating opportunities |
| Jim Thorpe | Known as the 'Gateway to the Poconos', this charming town offers stunning natural scenery and a rich history. Great for those who love historic sites, outdoor sports, and a vibrant arts scene. | Old Jail Museum, Mauch Chunk Museum, Carbon County Courthouse, Lehigh Gorge State Park, Jim Thorpe Scenic Railway, Outdoor adventure activities like whitewater rafting |
| Mount Pocono | A growing area popular among tourists seeking a variety of outdoor activities and entertainment options. Provides a mix of family-friendly attractions and nightlife. | Mt. Airy Casino Resort, Camelback Mountain Ski Resort, Lakes and nature parks, Poconos Race Track, Shopping and dining options |
| Tannersville | Close to Camelback Mountain, which offers great skiing and snowboarding in winter, and a waterpark in summer. Popular for families and thrill-seekers. | Camelback Mountain Resort, Camelbeach Waterpark, The Crossings Premium Outlets, Dining and entertainment options, Scenic beauty and hiking trails |
| Stroudsburg | An urban center with a historic charm, providing a variety of dining and shopping options. It's a gateway for exploring the surrounding natural attractions. | Stroudsburg Historic District, Sherman Theater, Poconos Arts Council, Cultural events and festivals, Access to Delaware Water Gap |
| East Stroudsburg | Strategically located near outdoor attractions and easy access to transportation, making it a convenient spot for visitors. Popular for its vibrant community and nearby activities. | Kalahari Waterpark, East Stroudsburg University, Delaware Water Gap National Recreation Area, Outdoor sports facilities, Local dining and shopping options |
Understanding Airbnb License Requirements & STR Laws in Lake Harmony (2026)
While Lake Harmony, Pennsylvania, United States currently shows low STR regulations, specific Airbnb license requirements might still exist or change. Always verify the latest short term rental regulations and Airbnb license requirements directly with local government authorities for Lake Harmony to ensure full compliance before hosting.
(Source: AirROI data, 2026, finding no licensed listings among those analyzed)
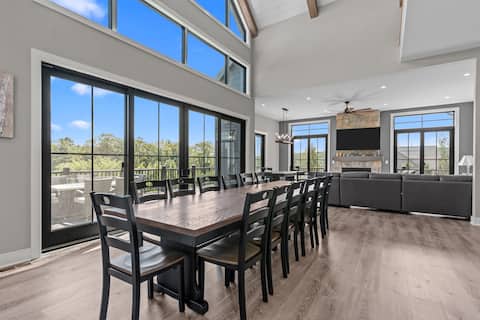
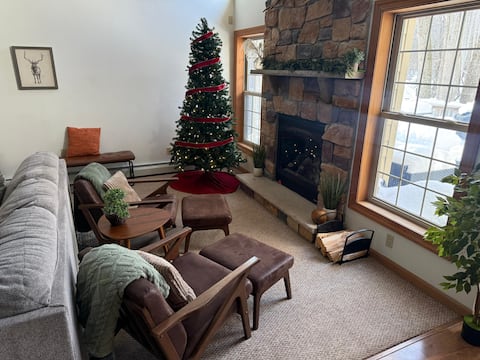
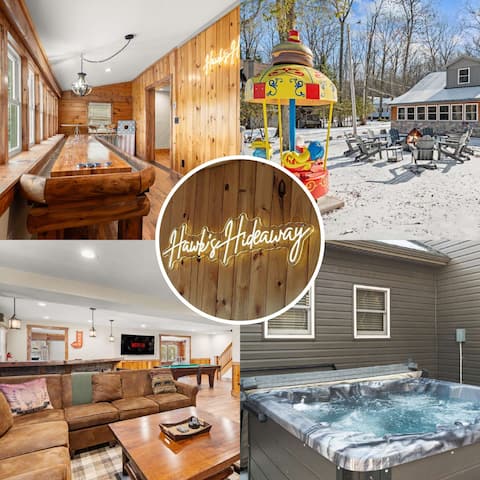
Top Performing Airbnb Properties in Lake Harmony (2026)
Benchmark your potential! Explore examples of top-performing Airbnb properties in Lake Harmonybased on Trailing Twelve Month (TTM) revenue. Analyze their characteristics, revenue, occupancy rate, and ADR to understand what drives success in this market.
“Pocono Grand” SKI/Hot Tub/Lake/Pool - Sleeps 20!
Entire Place • 8 bedrooms
Luxury 10BR Estate | Sleeps 24, Hot Tub & Sauna
Entire Place • 10 bedrooms
Sleeps 22, Game Room, Loft, Hot Tub, Mins to Lake
Entire Place • 6 bedrooms
Hot Tub, Firepit, GameRoom, Pets, Mins to Skiing
Entire Place • 4 bedrooms
Luxury Lake Escape•Hot Tub
Entire Place • 6 bedrooms
Pine Vaulted Chalet | HotTub | Firepit | BBQ Grill
Entire Place • 5 bedrooms
Note: Performance varies based on location, size, amenities, seasonality, and management quality. Data reflects the past 12 months.
Top Performing Airbnb Hosts in Lake Harmony (2026)
Learn from the best! This table showcases top-performing Airbnb hosts in Lake Harmony based on the number of properties managed and estimated total revenue over the past year. Analyze their scale and performance metrics.
| Host Name | Properties | Grossing Revenue | Stay Reviews | Avg Rating |
|---|---|---|---|---|
| Calibrate | 4 | $216,774 | 52 | 4.83/5.0 |
| Don | 4 | $124,946 | 50 | 4.92/5.0 |
| Ellen | 1 | $113,343 | 20 | 5.00/5.0 |
| Amanda | 1 | $99,365 | 4 | 4.75/5.0 |
| Joel | 1 | $78,121 | 57 | 4.98/5.0 |
| Jd | 2 | $76,699 | 47 | 4.79/5.0 |
| Hope | 2 | $74,393 | 29 | 4.83/5.0 |
| Megan | 1 | $66,438 | 12 | 5.00/5.0 |
| Martin And Family | 2 | $63,677 | 20 | 4.86/5.0 |
| Wander Home | 1 | $63,221 | 16 | 4.94/5.0 |
Analyzing the strategies of top hosts, such as their property selection, pricing, and guest communication, can offer valuable lessons for optimizing your own Airbnb operations in Lake Harmony.
Dive Deeper: Advanced Lake Harmony STR Market Data (2026)
Ready to unlock more insights? AirROI provides access to advanced metrics and comprehensive Airbnb data for Lake Harmony. Explore detailed analytics beyond this report to refine your investment strategy, optimize pricing, and maximize your vacation rental profits.
Explore Advanced MetricsLake Harmony Short-Term Rental Market Composition (2026): Property & Room Types
Room Type Distribution
Property Type Distribution
Market Composition Insights for Lake Harmony
- The Lake Harmony Airbnb market composition is heavily skewed towards Entire Home/Apt listings, which make up 100% of the 46 active rentals. This indicates strong guest preference for privacy and space.
- Looking at the property type distribution in Lake Harmony, House properties are the most common (82.6%), reflecting the local real estate landscape.
- Houses represent a significant 82.6% portion, catering likely to families or larger groups.
Lake Harmony Airbnb Room Capacity Analysis (2026): Bedroom Distribution
Distribution of Listings by Number of Bedrooms
Room Capacity Insights for Lake Harmony
- The dominant room capacity in Lake Harmony is 5+ bedrooms listings, making up 39.1% of the market. This suggests a strong demand for properties suitable for families or small groups.
- Together, 5+ bedrooms and 3 bedrooms properties represent 71.7% of the active Airbnb listings in Lake Harmony, indicating a high concentration in these sizes.
- A significant 89.1% of listings offer 3+ bedrooms, catering to larger groups and families seeking more space in Lake Harmony.
Lake Harmony Vacation Rental Guest Capacity Trends (2026)
Distribution of Listings by Guest Capacity
Guest Capacity Insights for Lake Harmony
- The most common guest capacity trend in Lake Harmony vacation rentals is listings accommodating 8+ guests (87%). This suggests the primary traveler segment is likely larger groups.
- Properties designed for 8+ guests and 6 guests dominate the Lake Harmony STR market, accounting for 91.3% of listings.
- 95.6% of properties accommodate 6+ guests, serving the market segment for larger families or group travel in Lake Harmony.
- On average, properties in Lake Harmony are equipped to host 7.7 guests.
Lake Harmony Airbnb Booking Patterns (2026): Available vs. Booked Days
Available Days Distribution
Booked Days Distribution
Booking Pattern Insights for Lake Harmony
- The most common availability pattern in Lake Harmony falls within the 271-366 days range, representing 69.6% of listings. This suggests many properties have significant open periods on their calendars.
- Approximately 100.0% of listings show high availability (181+ days open annually), indicating potential for increased bookings or specific owner usage patterns.
- For booked days, the 31-90 days range is most frequent in Lake Harmony (56.5%), reflecting common guest stay durations or potential owner blocking patterns.
Lake Harmony Airbnb Minimum Stay Requirements Analysis
Distribution of Listings by Minimum Night Requirement
1 Night
5 listings
10.9% of total
2 Nights
31 listings
67.4% of total
4-6 Nights
1 listings
2.2% of total
30+ Nights
9 listings
19.6% of total
Key Insights
- The most prevalent minimum stay requirement in Lake Harmony is 2 Nights, adopted by 67.4% of listings. This highlights the market's preference for shorter, flexible bookings.
- A strong majority (78.3%) of the Lake Harmony Airbnb data shows acceptance of very short stays (1-2 nights), indicating a dynamic, high-turnover market.
- A significant segment (19.6%) caters to monthly stays (30+ nights) in Lake Harmony, pointing to opportunities in the extended-stay market.
Recommendations
- Align with the market by considering a 2 Nights minimum stay, as 67.4% of Lake Harmony hosts use this setting.
- If feasible, allowing 1-night stays, especially midweek or during low season, could capture last-minute bookings, as only 10.9% currently do.
- A 2-night minimum appears standard (67.4%). Consider this for weekends or peak periods.
- Explore offering discounts for stays of 30+ nights to attract the 19.6% of the market seeking extended stays.
- Adjust minimum nights based on seasonality – potentially shorter during low season and longer during peak demand periods in Lake Harmony.
Lake Harmony Airbnb Cancellation Policy Trends Analysis (2026)
Super Strict 30 Days
2 listings
4.3% of total
Limited
2 listings
4.3% of total
Flexible
3 listings
6.5% of total
Moderate
12 listings
26.1% of total
Firm
20 listings
43.5% of total
Strict
7 listings
15.2% of total
Cancellation Policy Insights for Lake Harmony
- The prevailing Airbnb cancellation policy trend in Lake Harmony is Firm, used by 43.5% of listings.
- A majority (58.7%) of hosts in Lake Harmony utilize Firm or Strict policies, indicating a market where hosts prioritize booking security.
Recommendations for Hosts
- Consider adopting a Firm policy to align with the 43.5% market standard in Lake Harmony.
- Regularly review your cancellation policy against competitors and market demand shifts in Lake Harmony.
Lake Harmony STR Booking Lead Time Analysis (2026)
Average Booking Lead Time by Month
Booking Lead Time Insights for Lake Harmony
- The overall average booking lead time for vacation rentals in Lake Harmony is 26 days.
- Guests book furthest in advance for stays during December (average 34 days), likely coinciding with peak travel demand or local events.
- The shortest booking windows occur for stays in April (average 0 days), indicating more last-minute travel plans during this time.
- Seasonally, Fall (29 days avg.) sees the longest lead times, while Spring (1 days avg.) has the shortest, reflecting typical travel planning cycles.
Recommendations for Hosts
- Use the overall average lead time (26 days) as a baseline for your pricing and availability strategy in Lake Harmony.
- During April, focus on last-minute booking availability and promotions, as guests book with very short notice (0 days avg.).
- Target marketing efforts for the Fall season well in advance (at least 29 days) to capture early planners.
- Monitor your own booking lead times against these Lake Harmony averages to identify opportunities for dynamic pricing adjustments.
Popular & Essential Airbnb Amenities in Lake Harmony (2026)
Amenity Prevalence
Amenity Insights for Lake Harmony
- Essential amenities in Lake Harmony that guests expect include: Smoke alarm, TV, Kitchen, Carbon monoxide alarm, Wifi, Free parking on premises, Heating, Oven, Refrigerator, Fire extinguisher. Lacking these (any) could significantly impact bookings.
Recommendations for Hosts
- Ensure your listing includes all essential amenities for Lake Harmony: Smoke alarm, TV, Kitchen, Carbon monoxide alarm, Wifi, Free parking on premises, Heating, Oven, Refrigerator, Fire extinguisher.
- Prioritize adding missing essentials: Free parking on premises, Heating, Oven, Refrigerator, Fire extinguisher.
- Highlight unique or less common amenities you offer (e.g., hot tub, dedicated workspace, EV charger) in your listing description and photos.
- Regularly check competitor amenities in Lake Harmony to stay competitive.
Lake Harmony Airbnb Guest Demographics & Profile Analysis (2026)
Guest Profile Summary for Lake Harmony
- The typical guest profile for Airbnb in Lake Harmony consists of primarily domestic travelers (96%), often arriving from nearby New York, typically belonging to the Post-2000s (Gen Z/Alpha) group (50%), primarily speaking English or Spanish.
- Domestic travelers account for 96.3% of guests.
- Key international markets include United States (96.3%) and DC (0.8%).
- Top languages spoken are English (66.4%) followed by Spanish (20.2%).
- A significant demographic segment is the Post-2000s (Gen Z/Alpha) group, representing 50% of guests.
Recommendations for Hosts
- Target domestic marketing efforts towards travelers from New York and Philadelphia.
- Tailor amenities and listing descriptions to appeal to the dominant Post-2000s (Gen Z/Alpha) demographic (e.g., highlight fast WiFi, smart home features, local guides).
- Highlight unique local experiences or amenities relevant to the primary guest profile.
- Consider seasonal promotions aligned with peak travel times for key origin markets.
Nearby Short-Term Rental Market Comparison
How does the Lake Harmony Airbnb market stack up against its neighbors? Compare key performance metrics like average monthly revenue, ADR, and occupancy rates in surrounding areas to understand the broader regional STR landscape.
| Market | Active Properties | Monthly Revenue | Daily Rate | Avg. Occupancy |
|---|---|---|---|---|
| Freeland | 11 | $8,436 | $684.29 | 42% |
| Berlin Township | 15 | $7,208 | $729.10 | 35% |
| Polk Township | 15 | $6,974 | $520.26 | 38% |
| Town of Kingston | 10 | $6,470 | $473.76 | 49% |
| Frankford Township | 11 | $6,329 | $505.19 | 41% |
| Spring Lake Heights | 16 | $5,785 | $725.20 | 40% |
| Stroud Township | 137 | $5,728 | $478.40 | 40% |
| Town of Monroe | 22 | $5,690 | $720.52 | 37% |
| Hilltown Township | 11 | $5,557 | $578.96 | 40% |
| Town of Torrey | 34 | $5,535 | $437.35 | 50% |