Price Township Airbnb Market Analysis 2025: Short Term Rental Data & Vacation Rental Statistics in Pennsylvania, United States
Is Airbnb profitable in Price Township in 2025? Explore comprehensive Airbnb analytics for Price Township, Pennsylvania, United States to uncover income potential. This 2025 STR market report for Price Township, based on AirROI data from December 2024 to November 2025, reveals key trends in the niche market of 19 active listings.
Whether you're considering an Airbnb investment in Price Township, optimizing your existing vacation rental, or exploring rental arbitrage opportunities, understanding the Price Township Airbnb data is crucial. Leveraging the low regulation environment is key to maximizing your short term rental income potential. Let's dive into the specifics.
Key Price Township Airbnb Performance Metrics Overview
Monthly Airbnb Revenue Variations & Income Potential in Price Township (2025)
Understanding the monthly revenue variations for Airbnb listings in Price Township is key to maximizing your short term rental income potential. Seasonality significantly impacts earnings. Our analysis, based on data from the past 12 months, shows that the peak revenue month for STRs in Price Township is typically August, while March often presents the lowest earnings, highlighting opportunities for strategic pricing adjustments during shoulder and low seasons. Explore the typical Airbnb income in Price Township across different performance tiers:
- Best-in-class properties (Top 10%) achieve $11,287+ monthly, often utilizing dynamic pricing and superior guest experiences.
- Strong performing properties (Top 25%) earn $6,828 or more, indicating effective management and desirable locations/amenities.
- Typical properties (Median) generate around $3,124 per month, representing the average market performance.
- Entry-level properties (Bottom 25%) see earnings around $1,732, often with potential for optimization.
Average Monthly Airbnb Earnings Trend in Price Township
Price Township Airbnb Occupancy Rate Trends (2025)
Maximize your bookings by understanding the Price Township STR occupancy trends. Seasonal demand shifts significantly influence how often properties are booked. Typically, Augustsees the highest demand (peak season occupancy), while November experiences the lowest (low season). Effective strategies, like adjusting minimum stays or offering promotions, can boost occupancy during slower periods. Here's how different property tiers perform in Price Township:
- Best-in-class properties (Top 10%) achieve 78%+ occupancy, indicating high desirability and potentially optimized availability.
- Strong performing properties (Top 25%) maintain 54% or higher occupancy, suggesting good market fit and guest satisfaction.
- Typical properties (Median) have an occupancy rate around 37%.
- Entry-level properties (Bottom 25%) average 17% occupancy, potentially facing higher vacancy.
Average Monthly Occupancy Rate Trend in Price Township
Average Daily Rate (ADR) Airbnb Trends in Price Township (2025)
Effective short term rental pricing strategy in Price Township involves understanding monthly ADR fluctuations. The Average Daily Rate (ADR) for Airbnb in Price Township typically peaks in August and dips lowest during March. Leveraging Airbnb dynamic pricing tools or strategies based on this seasonality can significantly boost revenue. Here's a look at the typical nightly rates achieved:
- Best-in-class properties (Top 10%) command rates of $619+ per night, often due to premium features or locations.
- Strong performing properties (Top 25%) achieve nightly rates of $485 or more.
- Typical properties (Median) charge around $312 per night.
- Entry-level properties (Bottom 25%) earn around $184 per night.
Average Daily Rate (ADR) Trend by Month in Price Township
Get Live Price Township Market Intelligence 👇

Explore Real-time Analytics
Airbnb Seasonality Analysis & Trends in Price Township (2025)
Peak Season (August, July, June)
- Revenue averages $7,616 per month
- Occupancy rates average 47.8%
- Daily rates average $411
Shoulder Season
- Revenue averages $4,617 per month
- Occupancy maintains around 38.0%
- Daily rates hold near $367
Low Season (February, March, April)
- Revenue drops to average $3,736 per month
- Occupancy decreases to average 38.6%
- Daily rates adjust to average $328
Seasonality Insights for Price Township
- The Airbnb seasonality in Price Township shows highly seasonal trends requiring careful strategy. While the sections above show seasonal averages, it's also insightful to look at the extremes:
- During the high season, the absolute peak month showcases Price Township's highest earning potential, with monthly revenues capable of climbing to $8,824, occupancy reaching a high of 54.8%, and ADRs peaking at $439.
- Conversely, the slowest single month of the year, typically falling within the low season, marks the market's lowest point. In this month, revenue might dip to $3,549, occupancy could drop to 34.6%, and ADRs may adjust down to $323.
- Understanding both the seasonal averages and these monthly peaks and troughs in revenue, occupancy, and ADR is crucial for maximizing your Airbnb profit potential in Price Township.
Seasonal Strategies for Maximizing Profit
- Peak Season: Maximize revenue through premium pricing and potentially longer minimum stays. Ensure high availability.
- Low Season: Offer competitive pricing, special promotions (e.g., extended stay discounts), and flexible cancellation policies. Target off-season travelers like remote workers or budget-conscious guests.
- Shoulder Seasons: Implement dynamic pricing that balances peak and low rates. Target weekend travelers or specific events. Offer slightly more flexible terms than peak season.
- Regularly analyze your own performance against these Price Township seasonality benchmarks and adjust your pricing and availability strategy accordingly.
Best Areas for Airbnb Investment in Price Township (2025)
Exploring the top neighborhoods for short-term rentals in Price Township? This section highlights key areas, outlining why they are attractive for hosts and guests, along with notable local attractions. Consider these locations based on your target guest profile and investment strategy.
| Neighborhood / Area | Why Host Here? (Target Guests & Appeal) | Key Attractions & Landmarks |
|---|---|---|
| Lake Wallenpaupack | A large, popular lake in the Pocono Mountains, known for boating, fishing, and outdoor activities. Ideal for families and vacationers looking for a nature getaway. | Lake Wallenpaupack, Lakeside Beach, Ski Big Bear, Hiking Trails, Paddleboarding |
| Promised Land State Park | A beautiful state park with lakes, hiking trails, and camping opportunities. Great for outdoor enthusiasts and nature lovers. | Promised Land Lake, Hiking Trails, Fishing, Birdwatching, Campgrounds |
| Camelback Mountain Resort | A popular ski resort in winter and a water park in summer, attracting tourists year-round. Perfect for families and adventure seekers. | Camelback Ski Resort, Camelbeach Waterpark, Snow Tubing, Ziplining, Adventure Park |
| Big Bear Lake | A scenic mountain lake area known for its serene environment and outdoor activities. Attracts guests looking for relaxation and adventure. | Big Bear Golf Club, Fishing, Hiking, Nature Trails, Scenic Views |
| Hawley | A quaint town on the banks of the Lackawaxen River, known for its historic charm and access to outdoor activities. Ideal for a relaxing getaway. | Riverside Park, Lackawaxen River, Hawley Silk Mill, Local Shops, Dining Options |
| Lackawaxen | A scenic riverside community known for its history and outdoor recreation. Attracts visitors seeking a peaceful retreat. | Delaware River, Lackawaxen Historical Society, River Rafting, Nature Trails, Scenic Views |
| Milford | A charming town with a historic downtown and access to the Delaware Water Gap National Recreation Area. Great for tourists interested in history and nature. | Delaware Water Gap, Milford's Historic District, The Columns Museum, Nature Trails, Local Shops |
| Stroudsburg | The gateway to the Pocono Mountains, known for its vibrant downtown and cultural attractions. Ideal for visitors looking for a mix of urban and outdoor experiences. | Courthouse Square, Stroud Mansion, Local Art Galleries, Pocono Mountains Arts Council, Dining and Shopping |
Understanding Airbnb License Requirements & STR Laws in Price Township (2025)
While Price Township, Pennsylvania, United States currently shows low STR regulations, specific Airbnb license requirements might still exist or change. Always verify the latest short term rental regulations and Airbnb license requirements directly with local government authorities for Price Township to ensure full compliance before hosting.
(Source: AirROI data, 2025, finding no licensed listings among those analyzed)
Top Performing Airbnb Properties in Price Township (2025)
Benchmark your potential! Explore examples of top-performing Airbnb properties in Price Townshipbased on Trailing Twelve Month (TTM) revenue. Analyze their characteristics, revenue, occupancy rate, and ADR to understand what drives success in this market.
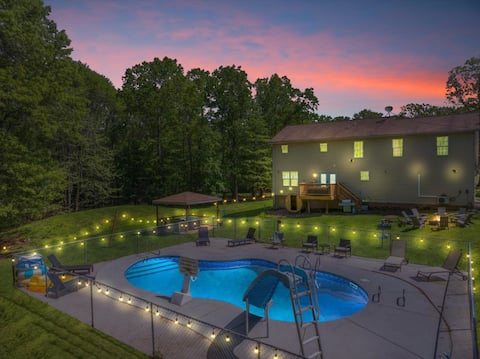
Luxury Retreat with Pool, Hot Tub & Sauna!
Entire Place • 6 bedrooms

5500 sqft/9 Bed/Retreat/Theater!/Huge Game Room!
Entire Place • 9 bedrooms
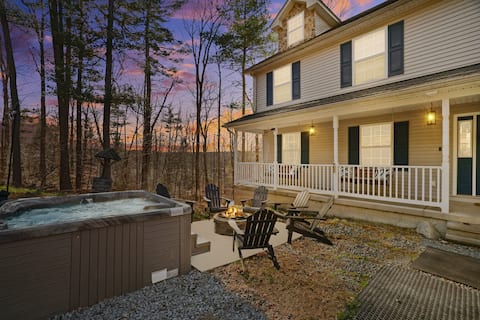
Luxury Pocono Retreat:Jacuzzi, Sauna, Gym, Games
Entire Place • 4 bedrooms
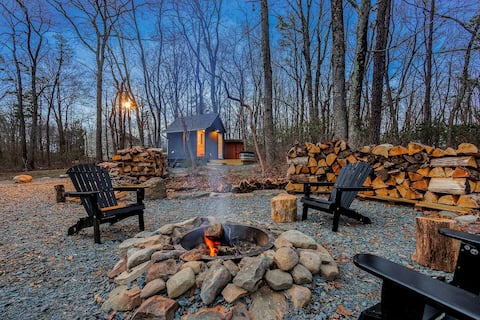
The Little Black Cabin - Sauna | Hot Tub | Firepit
Entire Place • 2 bedrooms
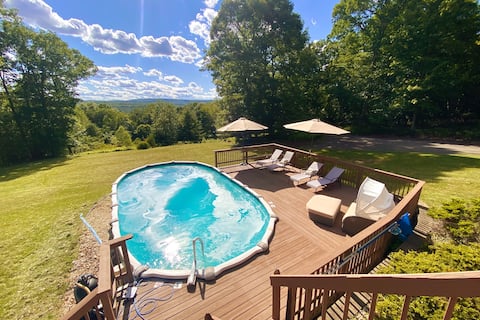
Top of the Hill Pocono Large Home 4 Bdrm, HotTub
Entire Place • 4 bedrooms
Paradise Dreamers/Hot Tub/Pool/Games
Entire Place • 5 bedrooms
Note: Performance varies based on location, size, amenities, seasonality, and management quality. Data reflects the past 12 months.
Top Performing Airbnb Hosts in Price Township (2025)
Learn from the best! This table showcases top-performing Airbnb hosts in Price Township based on the number of properties managed and estimated total revenue over the past year. Analyze their scale and performance metrics.
| Host Name | Properties | Grossing Revenue | Stay Reviews | Avg Rating |
|---|---|---|---|---|
| Tom | 1 | $171,415 | 22 | 4.77/5.0 |
| Poconos Family Rentals | 1 | $149,870 | 161 | 4.92/5.0 |
| Smaro | 1 | $104,594 | 93 | 4.96/5.0 |
| Vera Kenzou | 1 | $104,021 | 139 | 4.97/5.0 |
| Roman | 1 | $49,409 | 56 | 4.88/5.0 |
| Max | 1 | $45,232 | 55 | 4.96/5.0 |
| Evolve | 2 | $41,285 | 66 | 4.67/5.0 |
| Danielle | 1 | $39,735 | 112 | 4.98/5.0 |
| Jerzy | 1 | $38,202 | 49 | 4.90/5.0 |
| Heather | 1 | $31,908 | 9 | 5.00/5.0 |
Analyzing the strategies of top hosts, such as their property selection, pricing, and guest communication, can offer valuable lessons for optimizing your own Airbnb operations in Price Township.
Dive Deeper: Advanced Price Township STR Market Data (2025)
Ready to unlock more insights? AirROI provides access to advanced metrics and comprehensive Airbnb data for Price Township. Explore detailed analytics beyond this report to refine your investment strategy, optimize pricing, and maximize your vacation rental profits.
Explore Advanced MetricsPrice Township Short-Term Rental Market Composition (2025): Property & Room Types
Room Type Distribution
Property Type Distribution
Market Composition Insights for Price Township
- The Price Township Airbnb market composition is heavily skewed towards Entire Home/Apt listings, which make up 100% of the 19 active rentals. This indicates strong guest preference for privacy and space.
- Looking at the property type distribution in Price Township, House properties are the most common (68.4%), reflecting the local real estate landscape.
- Houses represent a significant 68.4% portion, catering likely to families or larger groups.
Price Township Airbnb Room Capacity Analysis (2025): Bedroom Distribution
Distribution of Listings by Number of Bedrooms
Room Capacity Insights for Price Township
- The dominant room capacity in Price Township is 4 bedrooms listings, making up 26.3% of the market. This suggests a strong demand for properties suitable for families or small groups.
- Together, 4 bedrooms and 2 bedrooms properties represent 52.6% of the active Airbnb listings in Price Township, indicating a high concentration in these sizes.
- A significant 68.5% of listings offer 3+ bedrooms, catering to larger groups and families seeking more space in Price Township.
Price Township Vacation Rental Guest Capacity Trends (2025)
Distribution of Listings by Guest Capacity
Guest Capacity Insights for Price Township
- The most common guest capacity trend in Price Township vacation rentals is listings accommodating 8+ guests (57.9%). This suggests the primary traveler segment is likely larger groups.
- Properties designed for 8+ guests and 6 guests dominate the Price Township STR market, accounting for 73.7% of listings.
- 79.0% of properties accommodate 6+ guests, serving the market segment for larger families or group travel in Price Township.
- On average, properties in Price Township are equipped to host 6.8 guests.
Price Township Airbnb Booking Patterns (2025): Available vs. Booked Days
Available Days Distribution
Booked Days Distribution
Booking Pattern Insights for Price Township
- The most common availability pattern in Price Township falls within the 271-366 days range, representing 57.9% of listings. This suggests many properties have significant open periods on their calendars.
- Approximately 84.2% of listings show high availability (181+ days open annually), indicating potential for increased bookings or specific owner usage patterns.
- For booked days, the 31-90 days range is most frequent in Price Township (42.1%), reflecting common guest stay durations or potential owner blocking patterns.
- A notable 15.8% of properties secure long booking periods (181+ days booked per year), highlighting successful long-term rental strategies or significant owner usage.
Price Township Airbnb Minimum Stay Requirements Analysis
Distribution of Listings by Minimum Night Requirement
1 Night
3 listings
15.8% of total
2 Nights
10 listings
52.6% of total
3 Nights
1 listings
5.3% of total
30+ Nights
5 listings
26.3% of total
Key Insights
- The most prevalent minimum stay requirement in Price Township is 2 Nights, adopted by 52.6% of listings. This highlights the market's preference for shorter, flexible bookings.
- A strong majority (68.4%) of the Price Township Airbnb data shows acceptance of very short stays (1-2 nights), indicating a dynamic, high-turnover market.
- A significant segment (26.3%) caters to monthly stays (30+ nights) in Price Township, pointing to opportunities in the extended-stay market.
Recommendations
- Align with the market by considering a 2 Nights minimum stay, as 52.6% of Price Township hosts use this setting.
- If feasible, allowing 1-night stays, especially midweek or during low season, could capture last-minute bookings, as only 15.8% currently do.
- A 2-night minimum appears standard (52.6%). Consider this for weekends or peak periods.
- Explore offering discounts for stays of 30+ nights to attract the 26.3% of the market seeking extended stays.
- Adjust minimum nights based on seasonality – potentially shorter during low season and longer during peak demand periods in Price Township.
Price Township Airbnb Cancellation Policy Trends Analysis (2025)
Flexible
2 listings
10.5% of total
Moderate
8 listings
42.1% of total
Firm
4 listings
21.1% of total
Strict
5 listings
26.3% of total
Cancellation Policy Insights for Price Township
- The prevailing Airbnb cancellation policy trend in Price Township is Moderate, used by 42.1% of listings.
- There's a relatively balanced mix between guest-friendly (52.6%) and stricter (47.4%) policies, offering choices for different guest needs.
Recommendations for Hosts
- Consider adopting a Moderate policy to align with the 42.1% market standard in Price Township.
- Regularly review your cancellation policy against competitors and market demand shifts in Price Township.
Price Township STR Booking Lead Time Analysis (2025)
Average Booking Lead Time by Month
Booking Lead Time Insights for Price Township
- The overall average booking lead time for vacation rentals in Price Township is 36 days.
- Guests book furthest in advance for stays during November (average 69 days), likely coinciding with peak travel demand or local events.
- The shortest booking windows occur for stays in April (average 21 days), indicating more last-minute travel plans during this time.
- Seasonally, Fall (53 days avg.) sees the longest lead times, while Winter (34 days avg.) has the shortest, reflecting typical travel planning cycles.
Recommendations for Hosts
- Use the overall average lead time (36 days) as a baseline for your pricing and availability strategy in Price Township.
- For November stays, consider implementing length-of-stay discounts or slightly higher rates for bookings made less than 69 days out to capitalize on advance planning.
- Target marketing efforts for the Fall season well in advance (at least 53 days) to capture early planners.
- Monitor your own booking lead times against these Price Township averages to identify opportunities for dynamic pricing adjustments.
Popular & Essential Airbnb Amenities in Price Township (2025)
Amenity Prevalence
No amenities with partial availability (less than 100%) were found to display in the chart. All essential amenities might be present in all listings. Check insights below.
Amenity Insights for Price Township
- Essential amenities in Price Township that guests expect include: Hot water, Dishes and silverware, Heating, Coffee maker, Microwave, Backyard, Kitchen, Hangers, Free parking on premises, Smoke alarm. Lacking these (any) could significantly impact bookings.
Recommendations for Hosts
- Ensure your listing includes all essential amenities for Price Township: Hot water, Dishes and silverware, Heating, Coffee maker, Microwave, Backyard, Kitchen, Hangers, Free parking on premises, Smoke alarm.
- Highlight unique or less common amenities you offer (e.g., hot tub, dedicated workspace, EV charger) in your listing description and photos.
- Regularly check competitor amenities in Price Township to stay competitive.
Price Township Airbnb Guest Demographics & Profile Analysis (2025)
Guest Profile Summary for Price Township
- The typical guest profile for Airbnb in Price Township consists of primarily domestic travelers (97%), often arriving from nearby New York, typically belonging to the Post-2000s (Gen Z/Alpha) group (50%), primarily speaking English or Spanish.
- Domestic travelers account for 97.2% of guests.
- Key international markets include United States (97.2%) and DC (2.1%).
- Top languages spoken are English (62.5%) followed by Spanish (15.9%).
- A significant demographic segment is the Post-2000s (Gen Z/Alpha) group, representing 50% of guests.
Recommendations for Hosts
- Target domestic marketing efforts towards travelers from New York and Philadelphia.
- Tailor amenities and listing descriptions to appeal to the dominant Post-2000s (Gen Z/Alpha) demographic (e.g., highlight fast WiFi, smart home features, local guides).
- Highlight unique local experiences or amenities relevant to the primary guest profile.
- Consider seasonal promotions aligned with peak travel times for key origin markets.
Nearby Short-Term Rental Market Comparison
How does the Price Township Airbnb market stack up against its neighbors? Compare key performance metrics like average monthly revenue, ADR, and occupancy rates in surrounding areas to understand the broader regional STR landscape.
| Market | Active Properties | Monthly Revenue | Daily Rate | Avg. Occupancy |
|---|---|---|---|---|
| Freeland | 11 | $8,887 | $727.45 | 41% |
| Berlin Township | 15 | $7,236 | $719.50 | 35% |
| Polk Township | 15 | $6,978 | $525.44 | 38% |
| Stroud Township | 136 | $6,165 | $490.08 | 42% |
| Frankford Township | 12 | $6,112 | $492.62 | 41% |
| Spring Lake Heights | 16 | $6,072 | $743.21 | 40% |
| Hellam Township | 24 | $5,840 | $393.26 | 45% |
| Town of Torrey | 34 | $5,675 | $446.47 | 51% |
| Town of Kingston | 12 | $5,672 | $470.26 | 44% |
| Foster Township | 21 | $5,621 | $533.53 | 39% |