Tobyhanna Airbnb Market Analysis 2026: Short Term Rental Data & Vacation Rental Statistics in Pennsylvania, United States
Is Airbnb profitable in Tobyhanna in 2026? Explore comprehensive Airbnb analytics for Tobyhanna, Pennsylvania, United States to uncover income potential. This 2026 STR market report for Tobyhanna, based on AirROI data from February 2025 to January 2026, reveals key trends in the niche market of 53 active listings.
Whether you're considering an Airbnb investment in Tobyhanna, optimizing your existing vacation rental, or exploring rental arbitrage opportunities, understanding the Tobyhanna Airbnb data is crucial. Leveraging the low regulation environment is key to maximizing your short term rental income potential. Let's dive into the specifics.
Key Tobyhanna Airbnb Performance Metrics Overview
Monthly Airbnb Revenue Variations & Income Potential in Tobyhanna (2026)
Understanding the monthly revenue variations for Airbnb listings in Tobyhanna is key to maximizing your short term rental income potential. Seasonality significantly impacts earnings. Our analysis, based on data from the past 12 months, shows that the peak revenue month for STRs in Tobyhanna is typically August, while May often presents the lowest earnings, highlighting opportunities for strategic pricing adjustments during shoulder and low seasons. Explore the typical Airbnb income in Tobyhanna across different performance tiers:
- Best-in-class properties (Top 10%) achieve $9,281+ monthly, often utilizing dynamic pricing and superior guest experiences.
- Strong performing properties (Top 25%) earn $6,485 or more, indicating effective management and desirable locations/amenities.
- Typical properties (Median) generate around $3,543 per month, representing the average market performance.
- Entry-level properties (Bottom 25%) see earnings around $1,851, often with potential for optimization.
Average Monthly Airbnb Earnings Trend in Tobyhanna
Tobyhanna Airbnb Occupancy Rate Trends (2026)
Maximize your bookings by understanding the Tobyhanna STR occupancy trends. Seasonal demand shifts significantly influence how often properties are booked. Typically, Augustsees the highest demand (peak season occupancy), while May experiences the lowest (low season). Effective strategies, like adjusting minimum stays or offering promotions, can boost occupancy during slower periods. Here's how different property tiers perform in Tobyhanna:
- Best-in-class properties (Top 10%) achieve 69%+ occupancy, indicating high desirability and potentially optimized availability.
- Strong performing properties (Top 25%) maintain 54% or higher occupancy, suggesting good market fit and guest satisfaction.
- Typical properties (Median) have an occupancy rate around 34%.
- Entry-level properties (Bottom 25%) average 20% occupancy, potentially facing higher vacancy.
Average Monthly Occupancy Rate Trend in Tobyhanna
Average Daily Rate (ADR) Airbnb Trends in Tobyhanna (2026)
Effective short term rental pricing strategy in Tobyhanna involves understanding monthly ADR fluctuations. The Average Daily Rate (ADR) for Airbnb in Tobyhanna typically peaks in December and dips lowest during September. Leveraging Airbnb dynamic pricing tools or strategies based on this seasonality can significantly boost revenue. Here's a look at the typical nightly rates achieved:
- Best-in-class properties (Top 10%) command rates of $569+ per night, often due to premium features or locations.
- Strong performing properties (Top 25%) achieve nightly rates of $432 or more.
- Typical properties (Median) charge around $342 per night.
- Entry-level properties (Bottom 25%) earn around $277 per night.
Average Daily Rate (ADR) Trend by Month in Tobyhanna
Get Live Tobyhanna Market Intelligence 👇
Explore Real-time Analytics
Airbnb Seasonality Analysis & Trends in Tobyhanna (2026)
Peak Season (August, December, July)
- Revenue averages $6,060 per month
- Occupancy rates average 48.7%
- Daily rates average $374
Shoulder Season
- Revenue averages $3,957 per month
- Occupancy maintains around 32.6%
- Daily rates hold near $383
Low Season (February, March, April)
- Revenue drops to average $0 per month
- Occupancy decreases to average 0.0%
- Daily rates adjust to average $356
Seasonality Insights for Tobyhanna
- The Airbnb seasonality in Tobyhanna shows highly seasonal trends requiring careful strategy. While the sections above show seasonal averages, it's also insightful to look at the extremes:
- During the high season, the absolute peak month showcases Tobyhanna's highest earning potential, with monthly revenues capable of climbing to $6,267, occupancy reaching a high of 54.3%, and ADRs peaking at $450.
- Conversely, the slowest single month of the year, typically falling within the low season, marks the market's lowest point. In this month, revenue might dip to $0, occupancy could drop to 0.0%, and ADRs may adjust down to $332.
- Understanding both the seasonal averages and these monthly peaks and troughs in revenue, occupancy, and ADR is crucial for maximizing your Airbnb profit potential in Tobyhanna.
Seasonal Strategies for Maximizing Profit
- Peak Season: Maximize revenue through premium pricing and potentially longer minimum stays. Ensure high availability.
- Low Season: Offer competitive pricing, special promotions (e.g., extended stay discounts), and flexible cancellation policies. Target off-season travelers like remote workers or budget-conscious guests.
- Shoulder Seasons: Implement dynamic pricing that balances peak and low rates. Target weekend travelers or specific events. Offer slightly more flexible terms than peak season.
- Regularly analyze your own performance against these Tobyhanna seasonality benchmarks and adjust your pricing and availability strategy accordingly.
Best Areas for Airbnb Investment in Tobyhanna (2026)
Exploring the top neighborhoods for short-term rentals in Tobyhanna? This section highlights key areas, outlining why they are attractive for hosts and guests, along with notable local attractions. Consider these locations based on your target guest profile and investment strategy.
| Neighborhood / Area | Why Host Here? (Target Guests & Appeal) | Key Attractions & Landmarks |
|---|---|---|
| Mount Pocono | A popular destination for tourists seeking outdoor activities such as skiing, hiking, and enjoying nature. Close to the Pocono Mountains, it attracts families and adventure travelers. | Camelback Mountain Resort, Mount Pocono Golf Club, Poconos Environmental Education Center, Kalahari Water Park, Big Pocono State Park |
| Tobyhanna State Park | A beautiful natural area ideal for hiking, fishing, and picnicking, making it appealing for families and nature lovers. The park is well-known for its scenic views and outdoor opportunities. | Tobyhanna State Park, Fishing and boating on Tobyhanna Lake, Hiking trails, Wildlife observation, Picnic areas |
| Lake Naomi | A desirable lake community with private amenities and outdoor recreational activities. Great for summer vacationers and families looking to enjoy water sports and relaxation on the lake. | Lake Naomi, Water sports activities, Outdoor recreation facilities, Tennis and basketball courts, Community events |
| Camelback Mountain Resort | A well-known ski resort that also offers year-round outdoor activities, making it a sought-after destination for winter sports enthusiasts and summer adventurers alike. | Skiing and snowboarding, Waterpark activities, Zip lines, Mountain coasters, Giant indoor play park |
| Jim Thorpe | Often called the 'Switzerland of America', this historic town features stunning architecture and a variety of outdoor and cultural activities, making it ideal for a unique Airbnb experience. | Historic downtown Jim Thorpe, Lehigh Gorge Scenic Railway, Hiking in the Lehigh Gorge, Mauch Chunk Museum, Outdoor adventure parks |
| Poconos Lake | An expansive area with access to multiple lakes and outdoor activities, it's perfect for families looking for a getaway in a serene environment, with plenty of water and nature-based activities. | Lake access, Fishing and boating, Picnic areas, Nature trails, Wildlife watching |
| Stroudsburg | The county seat of Monroe County, with a vibrant downtown area, it attracts visitors looking for a mix of outdoor adventures and urban amenities, including shops and dining. | Downtown Stroudsburg shops and restaurants, The Sherman Theater, Jacobsburg Environmental Education Center, Stroudsburg Historic District, Outdoor concerts |
| Bushkill Falls | Known as the 'Niagara of Pennsylvania', this area features stunning waterfalls and hiking trails, making it a sought-after location for nature lovers and tourists looking for natural beauty. | Bushkill Falls, Hiking trails, Nature walks, Picnicking spots, Visitor center and shops |
Understanding Airbnb License Requirements & STR Laws in Tobyhanna (2026)
While Tobyhanna, Pennsylvania, United States currently shows low STR regulations, specific Airbnb license requirements might still exist or change. Always verify the latest short term rental regulations and Airbnb license requirements directly with local government authorities for Tobyhanna to ensure full compliance before hosting.
(Source: AirROI data, 2026, based on 4% licensed listings)
Top Performing Airbnb Properties in Tobyhanna (2026)
Benchmark your potential! Explore examples of top-performing Airbnb properties in Tobyhannabased on Trailing Twelve Month (TTM) revenue. Analyze their characteristics, revenue, occupancy rate, and ADR to understand what drives success in this market.

Lakefront Beach Entry | Hot Tub, Movie Theater!
Entire Place • 5 bedrooms

Beyond the Boroughs |Winter Retreat near Camelback
Entire Place • 5 bedrooms

Private Poconos Retreat! HotTub, GameRoom, FirePit
Entire Place • 3 bedrooms

Sleeps 15~Hot Tub~Fire Pit & Putt Putt!
Entire Place • 5 bedrooms
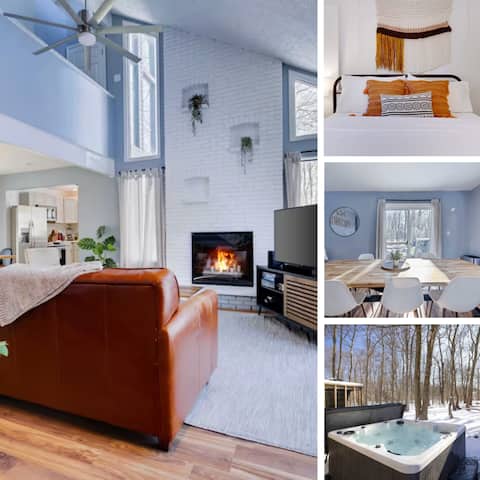
Pocono Lake Charmer: Lakeview Retreat for 10
Entire Place • 4 bedrooms

HotTub, FirePit, Game Room! Modern Poconos Getaway
Entire Place • 4 bedrooms
Note: Performance varies based on location, size, amenities, seasonality, and management quality. Data reflects the past 12 months.
Top Performing Airbnb Hosts in Tobyhanna (2026)
Learn from the best! This table showcases top-performing Airbnb hosts in Tobyhanna based on the number of properties managed and estimated total revenue over the past year. Analyze their scale and performance metrics.
| Host Name | Properties | Grossing Revenue | Stay Reviews | Avg Rating |
|---|---|---|---|---|
| Sabrina | 4 | $369,912 | 161 | 4.88/5.0 |
| Evolve | 6 | $127,380 | 45 | 4.91/5.0 |
| Ket And Drishti | 1 | $103,806 | 73 | 4.99/5.0 |
| Steven | 3 | $87,625 | 76 | 4.91/5.0 |
| Elliott And Kylie | 1 | $86,960 | 20 | 4.45/5.0 |
| Kyle Andrew | 1 | $73,813 | 26 | 4.96/5.0 |
| CJ @ Select Rentals | 1 | $61,135 | 25 | 5.00/5.0 |
| Curtis | 1 | $58,337 | 13 | 4.92/5.0 |
| Shannon | 1 | $56,700 | 5 | 4.20/5.0 |
| Don | 1 | $53,802 | 13 | 4.92/5.0 |
Analyzing the strategies of top hosts, such as their property selection, pricing, and guest communication, can offer valuable lessons for optimizing your own Airbnb operations in Tobyhanna.
Dive Deeper: Advanced Tobyhanna STR Market Data (2026)
Ready to unlock more insights? AirROI provides access to advanced metrics and comprehensive Airbnb data for Tobyhanna. Explore detailed analytics beyond this report to refine your investment strategy, optimize pricing, and maximize your vacation rental profits.
Explore Advanced MetricsTobyhanna Short-Term Rental Market Composition (2026): Property & Room Types
Room Type Distribution
Property Type Distribution
Market Composition Insights for Tobyhanna
- The Tobyhanna Airbnb market composition is heavily skewed towards Entire Home/Apt listings, which make up 100% of the 53 active rentals. This indicates strong guest preference for privacy and space.
- Looking at the property type distribution in Tobyhanna, House properties are the most common (98.1%), reflecting the local real estate landscape.
- Houses represent a significant 98.1% portion, catering likely to families or larger groups.
- Smaller segments like outdoor/unique (combined 1.9%) offer potential for unique stay experiences.
Tobyhanna Airbnb Room Capacity Analysis (2026): Bedroom Distribution
Distribution of Listings by Number of Bedrooms
Room Capacity Insights for Tobyhanna
- The dominant room capacity in Tobyhanna is 3 bedrooms listings, making up 58.5% of the market. This suggests a strong demand for properties suitable for families or small groups.
- Together, 3 bedrooms and 4 bedrooms properties represent 81.1% of the active Airbnb listings in Tobyhanna, indicating a high concentration in these sizes.
- A significant 94.3% of listings offer 3+ bedrooms, catering to larger groups and families seeking more space in Tobyhanna.
Tobyhanna Vacation Rental Guest Capacity Trends (2026)
Distribution of Listings by Guest Capacity
Guest Capacity Insights for Tobyhanna
- The most common guest capacity trend in Tobyhanna vacation rentals is listings accommodating 8+ guests (83%). This suggests the primary traveler segment is likely larger groups.
- Properties designed for 8+ guests and 6 guests dominate the Tobyhanna STR market, accounting for 98.1% of listings.
- 98.1% of properties accommodate 6+ guests, serving the market segment for larger families or group travel in Tobyhanna.
- On average, properties in Tobyhanna are equipped to host 7.6 guests.
Tobyhanna Airbnb Booking Patterns (2026): Available vs. Booked Days
Available Days Distribution
Booked Days Distribution
Booking Pattern Insights for Tobyhanna
- The most common availability pattern in Tobyhanna falls within the 271-366 days range, representing 64.2% of listings. This suggests many properties have significant open periods on their calendars.
- Approximately 94.4% of listings show high availability (181+ days open annually), indicating potential for increased bookings or specific owner usage patterns.
- For booked days, the 31-90 days range is most frequent in Tobyhanna (52.8%), reflecting common guest stay durations or potential owner blocking patterns.
- A notable 5.7% of properties secure long booking periods (181+ days booked per year), highlighting successful long-term rental strategies or significant owner usage.
Tobyhanna Airbnb Minimum Stay Requirements Analysis
Distribution of Listings by Minimum Night Requirement
1 Night
3 listings
5.7% of total
2 Nights
33 listings
62.3% of total
30+ Nights
17 listings
32.1% of total
Key Insights
- The most prevalent minimum stay requirement in Tobyhanna is 2 Nights, adopted by 62.3% of listings. This highlights the market's preference for shorter, flexible bookings.
- A strong majority (68.0%) of the Tobyhanna Airbnb data shows acceptance of very short stays (1-2 nights), indicating a dynamic, high-turnover market.
- A significant segment (32.1%) caters to monthly stays (30+ nights) in Tobyhanna, pointing to opportunities in the extended-stay market.
Recommendations
- Align with the market by considering a 2 Nights minimum stay, as 62.3% of Tobyhanna hosts use this setting.
- If feasible, allowing 1-night stays, especially midweek or during low season, could capture last-minute bookings, as only 5.7% currently do.
- A 2-night minimum appears standard (62.3%). Consider this for weekends or peak periods.
- Explore offering discounts for stays of 30+ nights to attract the 32.1% of the market seeking extended stays.
- Adjust minimum nights based on seasonality – potentially shorter during low season and longer during peak demand periods in Tobyhanna.
Tobyhanna Airbnb Cancellation Policy Trends Analysis (2026)
Super Strict 30 Days
1 listings
1.9% of total
Limited
2 listings
3.8% of total
Super Strict 60 Days
1 listings
1.9% of total
Flexible
4 listings
7.5% of total
Moderate
14 listings
26.4% of total
Firm
18 listings
34% of total
Strict
13 listings
24.5% of total
Cancellation Policy Insights for Tobyhanna
- The prevailing Airbnb cancellation policy trend in Tobyhanna is Firm, used by 34% of listings.
- A majority (58.5%) of hosts in Tobyhanna utilize Firm or Strict policies, indicating a market where hosts prioritize booking security.
Recommendations for Hosts
- Consider adopting a Firm policy to align with the 34% market standard in Tobyhanna.
- Regularly review your cancellation policy against competitors and market demand shifts in Tobyhanna.
Tobyhanna STR Booking Lead Time Analysis (2026)
Average Booking Lead Time by Month
Booking Lead Time Insights for Tobyhanna
- The overall average booking lead time for vacation rentals in Tobyhanna is 20 days.
- Guests book furthest in advance for stays during January (average 26 days), likely coinciding with peak travel demand or local events.
- The shortest booking windows occur for stays in April (average 0 days), indicating more last-minute travel plans during this time.
- Seasonally, Fall (21 days avg.) sees the longest lead times, while Spring (1 days avg.) has the shortest, reflecting typical travel planning cycles.
Recommendations for Hosts
- Use the overall average lead time (20 days) as a baseline for your pricing and availability strategy in Tobyhanna.
- During April, focus on last-minute booking availability and promotions, as guests book with very short notice (0 days avg.).
- Target marketing efforts for the Fall season well in advance (at least 21 days) to capture early planners.
- Monitor your own booking lead times against these Tobyhanna averages to identify opportunities for dynamic pricing adjustments.
Popular & Essential Airbnb Amenities in Tobyhanna (2026)
Amenity Prevalence
Amenity Insights for Tobyhanna
- Essential amenities in Tobyhanna that guests expect include: Smoke alarm, Kitchen, Hot water, Wifi, Heating, Dining table, Fire extinguisher, TV, Coffee maker, Washer. Lacking these (any) could significantly impact bookings.
Recommendations for Hosts
- Ensure your listing includes all essential amenities for Tobyhanna: Smoke alarm, Kitchen, Hot water, Wifi, Heating, Dining table, Fire extinguisher, TV, Coffee maker, Washer.
- Prioritize adding missing essentials: Dining table, Fire extinguisher, TV, Coffee maker, Washer.
- Highlight unique or less common amenities you offer (e.g., hot tub, dedicated workspace, EV charger) in your listing description and photos.
- Regularly check competitor amenities in Tobyhanna to stay competitive.
Tobyhanna Airbnb Guest Demographics & Profile Analysis (2026)
Guest Profile Summary for Tobyhanna
- The typical guest profile for Airbnb in Tobyhanna consists of primarily domestic travelers (99%), often arriving from nearby New York, typically belonging to the Post-2000s (Gen Z/Alpha) group (50%), primarily speaking English or Spanish.
- Domestic travelers account for 98.7% of guests.
- Key international markets include United States (98.7%) and Colombia (0.6%).
- Top languages spoken are English (55.5%) followed by Spanish (17.4%).
- A significant demographic segment is the Post-2000s (Gen Z/Alpha) group, representing 50% of guests.
Recommendations for Hosts
- Target domestic marketing efforts towards travelers from New York and Philadelphia.
- Tailor amenities and listing descriptions to appeal to the dominant Post-2000s (Gen Z/Alpha) demographic (e.g., highlight fast WiFi, smart home features, local guides).
- Highlight unique local experiences or amenities relevant to the primary guest profile.
- Consider seasonal promotions aligned with peak travel times for key origin markets.
Nearby Short-Term Rental Market Comparison
How does the Tobyhanna Airbnb market stack up against its neighbors? Compare key performance metrics like average monthly revenue, ADR, and occupancy rates in surrounding areas to understand the broader regional STR landscape.
| Market | Active Properties | Monthly Revenue | Daily Rate | Avg. Occupancy |
|---|---|---|---|---|
| Freeland | 11 | $8,436 | $684.29 | 42% |
| Berlin Township | 15 | $7,208 | $729.10 | 35% |
| Polk Township | 15 | $6,974 | $520.26 | 38% |
| Town of Kingston | 10 | $6,470 | $473.76 | 49% |
| Frankford Township | 11 | $6,329 | $505.19 | 41% |
| Spring Lake Heights | 16 | $5,785 | $725.20 | 40% |
| Stroud Township | 137 | $5,728 | $478.40 | 40% |
| Town of Monroe | 22 | $5,690 | $720.52 | 37% |
| Hilltown Township | 11 | $5,557 | $578.96 | 40% |
| Town of Torrey | 34 | $5,535 | $437.35 | 50% |