Decatur Airbnb Market Analysis 2026: Short Term Rental Data & Vacation Rental Statistics in Texas, United States
Is Airbnb profitable in Decatur in 2026? Explore comprehensive Airbnb analytics for Decatur, Texas, United States to uncover income potential. This 2026 STR market report for Decatur, based on AirROI data from February 2025 to January 2026, reveals key trends in the niche market of 22 active listings.
Whether you're considering an Airbnb investment in Decatur, optimizing your existing vacation rental, or exploring rental arbitrage opportunities, understanding the Decatur Airbnb data is crucial. Leveraging the low regulation environment is key to maximizing your short term rental income potential. Let's dive into the specifics.
Key Decatur Airbnb Performance Metrics Overview
Monthly Airbnb Revenue Variations & Income Potential in Decatur (2026)
Understanding the monthly revenue variations for Airbnb listings in Decatur is key to maximizing your short term rental income potential. Seasonality significantly impacts earnings. Our analysis, based on data from the past 12 months, shows that the peak revenue month for STRs in Decatur is typically December, while January often presents the lowest earnings, highlighting opportunities for strategic pricing adjustments during shoulder and low seasons. Explore the typical Airbnb income in Decatur across different performance tiers:
- Best-in-class properties (Top 10%) achieve $4,546+ monthly, often utilizing dynamic pricing and superior guest experiences.
- Strong performing properties (Top 25%) earn $3,265 or more, indicating effective management and desirable locations/amenities.
- Typical properties (Median) generate around $1,765 per month, representing the average market performance.
- Entry-level properties (Bottom 25%) see earnings around $881, often with potential for optimization.
Average Monthly Airbnb Earnings Trend in Decatur
Decatur Airbnb Occupancy Rate Trends (2026)
Maximize your bookings by understanding the Decatur STR occupancy trends. Seasonal demand shifts significantly influence how often properties are booked. Typically, Marchsees the highest demand (peak season occupancy), while January experiences the lowest (low season). Effective strategies, like adjusting minimum stays or offering promotions, can boost occupancy during slower periods. Here's how different property tiers perform in Decatur:
- Best-in-class properties (Top 10%) achieve 70%+ occupancy, indicating high desirability and potentially optimized availability.
- Strong performing properties (Top 25%) maintain 57% or higher occupancy, suggesting good market fit and guest satisfaction.
- Typical properties (Median) have an occupancy rate around 36%.
- Entry-level properties (Bottom 25%) average 18% occupancy, potentially facing higher vacancy.
Average Monthly Occupancy Rate Trend in Decatur
Average Daily Rate (ADR) Airbnb Trends in Decatur (2026)
Effective short term rental pricing strategy in Decatur involves understanding monthly ADR fluctuations. The Average Daily Rate (ADR) for Airbnb in Decatur typically peaks in December and dips lowest during February. Leveraging Airbnb dynamic pricing tools or strategies based on this seasonality can significantly boost revenue. Here's a look at the typical nightly rates achieved:
- Best-in-class properties (Top 10%) command rates of $282+ per night, often due to premium features or locations.
- Strong performing properties (Top 25%) achieve nightly rates of $195 or more.
- Typical properties (Median) charge around $154 per night.
- Entry-level properties (Bottom 25%) earn around $128 per night.
Average Daily Rate (ADR) Trend by Month in Decatur
Get Live Decatur Market Intelligence 👇

Explore Real-time Analytics
Airbnb Seasonality Analysis & Trends in Decatur (2026)
Peak Season (December, March, July)
- Revenue averages $2,823 per month
- Occupancy rates average 47.4%
- Daily rates average $173
Shoulder Season
- Revenue averages $2,218 per month
- Occupancy maintains around 36.3%
- Daily rates hold near $176
Low Season (January, February, April)
- Revenue drops to average $1,502 per month
- Occupancy decreases to average 32.9%
- Daily rates adjust to average $168
Seasonality Insights for Decatur
- The Airbnb seasonality in Decatur shows highly seasonal trends requiring careful strategy. While the sections above show seasonal averages, it's also insightful to look at the extremes:
- During the high season, the absolute peak month showcases Decatur's highest earning potential, with monthly revenues capable of climbing to $2,948, occupancy reaching a high of 55.8%, and ADRs peaking at $184.
- Conversely, the slowest single month of the year, typically falling within the low season, marks the market's lowest point. In this month, revenue might dip to $1,067, occupancy could drop to 20.3%, and ADRs may adjust down to $160.
- Understanding both the seasonal averages and these monthly peaks and troughs in revenue, occupancy, and ADR is crucial for maximizing your Airbnb profit potential in Decatur.
Seasonal Strategies for Maximizing Profit
- Peak Season: Maximize revenue through premium pricing and potentially longer minimum stays. Ensure high availability.
- Low Season: Offer competitive pricing, special promotions (e.g., extended stay discounts), and flexible cancellation policies. Target off-season travelers like remote workers or budget-conscious guests.
- Shoulder Seasons: Implement dynamic pricing that balances peak and low rates. Target weekend travelers or specific events. Offer slightly more flexible terms than peak season.
- Regularly analyze your own performance against these Decatur seasonality benchmarks and adjust your pricing and availability strategy accordingly.
Best Areas for Airbnb Investment in Decatur (2026)
Exploring the top neighborhoods for short-term rentals in Decatur? This section highlights key areas, outlining why they are attractive for hosts and guests, along with notable local attractions. Consider these locations based on your target guest profile and investment strategy.
| Neighborhood / Area | Why Host Here? (Target Guests & Appeal) | Key Attractions & Landmarks |
|---|---|---|
| Decatur Downtown | The heart of Decatur, filled with historical charm and local shops. Great for guests looking to experience the local culture and community events. | Wise County Courthouse, Historic Decatur Square, local dining and cafes, art galleries, Decatur's annual festivals |
| Lake Bridgeport | A beautiful lake area perfect for outdoor enthusiasts and families looking to enjoy water sports and fishing activities. | Lake Bridgeport, fishing piers, campgrounds, boat ramps, picnic areas |
| Decatur High School area | Located close to educational institutions, making it a favorable spot for families visiting students or coaches during events. | Decatur High School, local parks, community sporting events, youth activities |
| Seymour Street | A charming street known for its unique rental properties, attracting visitors who enjoy a quaint neighborhood feel. | local boutiques, historical buildings, community markets, family-run restaurants |
| Northeast Decatur | A quiet residential area ideal for families and longer stays, with close proximity to parks and recreation. | local parks, walking trails, family-friendly cafes, grocery stores |
| Oak Grove Park | Offers a great escape with natural beauty, perfect for guests looking for tranquility and outdoor recreation. | Oak Grove Park, walking trails, picnic areas, playgrounds |
| West Decatur | A growing area with new developments, popular among young families and professionals, providing modern amenities. | new shopping complexes, community events, fitness centers, local restaurants |
| Decatur Regional Airport vicinity | Convenient for travelers flying in and out of Decatur, ideal for business travelers needing quick access to flights. | Decatur Regional Airport, car rental services, business centers, local eateries nearby |
Understanding Airbnb License Requirements & STR Laws in Decatur (2026)
While Decatur, Texas, United States currently shows low STR regulations, specific Airbnb license requirements might still exist or change. Always verify the latest short term rental regulations and Airbnb license requirements directly with local government authorities for Decatur to ensure full compliance before hosting.
(Source: AirROI data, 2026, finding no licensed listings among those analyzed)
Top Performing Airbnb Properties in Decatur (2026)
Benchmark your potential! Explore examples of top-performing Airbnb properties in Decaturbased on Trailing Twelve Month (TTM) revenue. Analyze their characteristics, revenue, occupancy rate, and ADR to understand what drives success in this market.
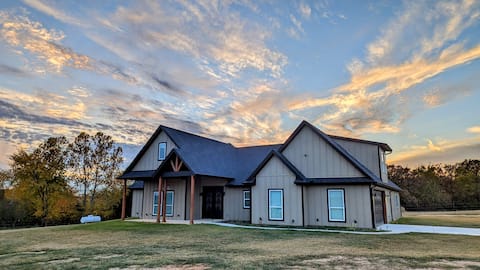
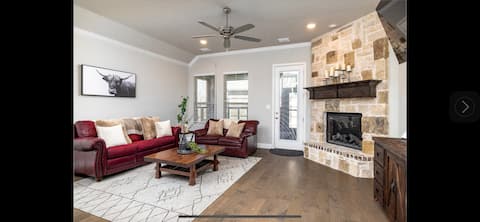
La Casa de Vaca
Entire Place • 4 bedrooms

World Cup Retreat-Sleeps 14-96 Acre Farm-Gameroom
Entire Place • 5 bedrooms

Clover House, Entire Home, Pool, Game Room
Entire Place • 3 bedrooms

Decatur Farmhouse Getaway w/ Deck & Backyard
Entire Place • 3 bedrooms

Family-Ready • 3BR + Backyard Near the Square
Entire Place • 3 bedrooms
Brand New Luxury 2-Bedroom Home in Decatur, Texas!
Entire Place • 2 bedrooms
Note: Performance varies based on location, size, amenities, seasonality, and management quality. Data reflects the past 12 months.
Top Performing Airbnb Hosts in Decatur (2026)
Learn from the best! This table showcases top-performing Airbnb hosts in Decatur based on the number of properties managed and estimated total revenue over the past year. Analyze their scale and performance metrics.
| Host Name | Properties | Grossing Revenue | Stay Reviews | Avg Rating |
|---|---|---|---|---|
| Jaci | 4 | $71,514 | 39 | 4.92/5.0 |
| Kristen | 2 | $55,511 | 475 | 4.95/5.0 |
| Josh | 1 | $44,034 | 70 | 4.99/5.0 |
| Melissa | 1 | $39,975 | 19 | 5.00/5.0 |
| Kristy | 1 | $39,395 | 45 | 4.98/5.0 |
| Evolve | 1 | $34,362 | 109 | 4.87/5.0 |
| Clement Amaram | 1 | $33,327 | 39 | 4.95/5.0 |
| Sandy | 1 | $24,255 | 62 | 5.00/5.0 |
| Evolve | 4 | $16,912 | 45 | 4.33/5.0 |
| Jilian | 2 | $16,316 | 17 | 4.67/5.0 |
Analyzing the strategies of top hosts, such as their property selection, pricing, and guest communication, can offer valuable lessons for optimizing your own Airbnb operations in Decatur.
Dive Deeper: Advanced Decatur STR Market Data (2026)
Ready to unlock more insights? AirROI provides access to advanced metrics and comprehensive Airbnb data for Decatur. Explore detailed analytics beyond this report to refine your investment strategy, optimize pricing, and maximize your vacation rental profits.
Explore Advanced MetricsDecatur Short-Term Rental Market Composition (2026): Property & Room Types
Room Type Distribution
Property Type Distribution
Market Composition Insights for Decatur
- The Decatur Airbnb market composition is heavily skewed towards Entire Home/Apt listings, which make up 95.5% of the 22 active rentals. This indicates strong guest preference for privacy and space.
- Looking at the property type distribution in Decatur, House properties are the most common (45.5%), reflecting the local real estate landscape.
- Houses represent a significant 45.5% portion, catering likely to families or larger groups.
- The presence of 9.1% Hotel/Boutique listings indicates integration with traditional hospitality.
- Smaller segments like unique stays (combined 4.5%) offer potential for unique stay experiences.
Decatur Airbnb Room Capacity Analysis (2026): Bedroom Distribution
Distribution of Listings by Number of Bedrooms
Room Capacity Insights for Decatur
- The dominant room capacity in Decatur is 2 bedrooms listings, making up 31.8% of the market. This suggests a strong demand for properties suitable for couples or solo travelers.
- Together, 2 bedrooms and 1 bedroom properties represent 59.1% of the active Airbnb listings in Decatur, indicating a high concentration in these sizes.
- A significant 27.2% of listings offer 3+ bedrooms, catering to larger groups and families seeking more space in Decatur.
Decatur Vacation Rental Guest Capacity Trends (2026)
Distribution of Listings by Guest Capacity
Guest Capacity Insights for Decatur
- The most common guest capacity trend in Decatur vacation rentals is listings accommodating 4 guests (36.4%). This suggests the primary traveler segment is likely small families or groups.
- Properties designed for 4 guests and 6 guests dominate the Decatur STR market, accounting for 54.6% of listings.
- 36.4% of properties accommodate 6+ guests, serving the market segment for larger families or group travel in Decatur.
- On average, properties in Decatur are equipped to host 4.4 guests.
Decatur Airbnb Booking Patterns (2026): Available vs. Booked Days
Available Days Distribution
Booked Days Distribution
Booking Pattern Insights for Decatur
- The most common availability pattern in Decatur falls within the 271-366 days range, representing 54.5% of listings. This suggests many properties have significant open periods on their calendars.
- Approximately 81.8% of listings show high availability (181+ days open annually), indicating potential for increased bookings or specific owner usage patterns.
- For booked days, the 31-90 days range is most frequent in Decatur (31.8%), reflecting common guest stay durations or potential owner blocking patterns.
- A notable 18.2% of properties secure long booking periods (181+ days booked per year), highlighting successful long-term rental strategies or significant owner usage.
Decatur Airbnb Minimum Stay Requirements Analysis
Distribution of Listings by Minimum Night Requirement
1 Night
10 listings
45.5% of total
2 Nights
9 listings
40.9% of total
3 Nights
1 listings
4.5% of total
30+ Nights
2 listings
9.1% of total
Key Insights
- The most prevalent minimum stay requirement in Decatur is 1 Night, adopted by 45.5% of listings. This highlights the market's preference for shorter, flexible bookings.
- A strong majority (86.4%) of the Decatur Airbnb data shows acceptance of very short stays (1-2 nights), indicating a dynamic, high-turnover market.
Recommendations
- Align with the market by considering a 1 Night minimum stay, as 45.5% of Decatur hosts use this setting.
- Explore offering discounts for stays of 30+ nights to attract the 9.1% of the market seeking extended stays.
- Adjust minimum nights based on seasonality – potentially shorter during low season and longer during peak demand periods in Decatur.
Decatur Airbnb Cancellation Policy Trends Analysis (2026)
Flexible
2 listings
9.1% of total
Moderate
8 listings
36.4% of total
Firm
4 listings
18.2% of total
Strict
8 listings
36.4% of total
Cancellation Policy Insights for Decatur
- The prevailing Airbnb cancellation policy trend in Decatur is Moderate, used by 36.4% of listings.
- A majority (54.6%) of hosts in Decatur utilize Firm or Strict policies, indicating a market where hosts prioritize booking security.
Recommendations for Hosts
- Consider adopting a Moderate policy to align with the 36.4% market standard in Decatur.
- With 36.4% using Strict terms, this is a viable option in Decatur, particularly for high-value properties or during peak demand periods.
- Regularly review your cancellation policy against competitors and market demand shifts in Decatur.
Decatur STR Booking Lead Time Analysis (2026)
Average Booking Lead Time by Month
Booking Lead Time Insights for Decatur
- The overall average booking lead time for vacation rentals in Decatur is 29 days.
- Guests book furthest in advance for stays during May (average 86 days), likely coinciding with peak travel demand or local events.
- The shortest booking windows occur for stays in December (average 20 days), indicating more last-minute travel plans during this time.
- Seasonally, Spring (50 days avg.) sees the longest lead times, while Winter (24 days avg.) has the shortest, reflecting typical travel planning cycles.
Recommendations for Hosts
- Use the overall average lead time (29 days) as a baseline for your pricing and availability strategy in Decatur.
- For May stays, consider implementing length-of-stay discounts or slightly higher rates for bookings made less than 86 days out to capitalize on advance planning.
- Target marketing efforts for the Spring season well in advance (at least 50 days) to capture early planners.
- Monitor your own booking lead times against these Decatur averages to identify opportunities for dynamic pricing adjustments.
Popular & Essential Airbnb Amenities in Decatur (2026)
Amenity Prevalence
Amenity Insights for Decatur
- Essential amenities in Decatur that guests expect include: Heating, Wifi, TV, Free parking on premises, Air conditioning, Coffee maker, Hot water, Bed linens, Smoke alarm. Lacking these (any) could significantly impact bookings.
- Popular amenities like Essentials are common but not universal. Offering these can provide a competitive edge.
Recommendations for Hosts
- Ensure your listing includes all essential amenities for Decatur: Heating, Wifi, TV, Free parking on premises, Air conditioning, Coffee maker, Hot water, Bed linens, Smoke alarm.
- Prioritize adding missing essentials: Coffee maker, Hot water, Bed linens, Smoke alarm.
- Consider adding popular differentiators like Essentials to increase appeal.
- Highlight unique or less common amenities you offer (e.g., hot tub, dedicated workspace, EV charger) in your listing description and photos.
- Regularly check competitor amenities in Decatur to stay competitive.
Decatur Airbnb Guest Demographics & Profile Analysis (2026)
Guest Profile Summary for Decatur
- The typical guest profile for Airbnb in Decatur consists of primarily domestic travelers (98%), often arriving from nearby Austin, typically belonging to the Post-2000s (Gen Z/Alpha) group (50%), primarily speaking English or Spanish.
- Domestic travelers account for 98.1% of guests.
- Key international markets include United States (98.1%) and Slovenia (0.6%).
- Top languages spoken are English (76.3%) followed by Spanish (11.3%).
- A significant demographic segment is the Post-2000s (Gen Z/Alpha) group, representing 50% of guests.
Recommendations for Hosts
- Target domestic marketing efforts towards travelers from Austin and Houston.
- Tailor amenities and listing descriptions to appeal to the dominant Post-2000s (Gen Z/Alpha) demographic (e.g., highlight fast WiFi, smart home features, local guides).
- Highlight unique local experiences or amenities relevant to the primary guest profile.
- Consider seasonal promotions aligned with peak travel times for key origin markets.
Nearby Short-Term Rental Market Comparison
How does the Decatur Airbnb market stack up against its neighbors? Compare key performance metrics like average monthly revenue, ADR, and occupancy rates in surrounding areas to understand the broader regional STR landscape.
| Market | Active Properties | Monthly Revenue | Daily Rate | Avg. Occupancy |
|---|---|---|---|---|
| Strawn | 27 | $8,233 | $847.64 | 34% |
| Star Harbor | 11 | $5,474 | $741.72 | 33% |
| Valley View | 25 | $5,111 | $484.73 | 39% |
| Bluff Dale | 18 | $4,063 | $411.68 | 29% |
| Red Oak | 17 | $3,978 | $288.35 | 50% |
| DeSoto | 29 | $3,947 | $332.58 | 47% |
| Flower Mound | 79 | $3,760 | $326.24 | 45% |
| Azle | 62 | $3,533 | $323.80 | 41% |
| Westworth Village | 11 | $3,530 | $240.30 | 48% |
| Highland Village | 15 | $3,363 | $345.42 | 48% |