Graham Airbnb Market Analysis 2026: Short Term Rental Data & Vacation Rental Statistics in Texas, United States
Is Airbnb profitable in Graham in 2026? Explore comprehensive Airbnb analytics for Graham, Texas, United States to uncover income potential. This 2026 STR market report for Graham, based on AirROI data from February 2025 to January 2026, reveals key trends in the niche market of 64 active listings.
Whether you're considering an Airbnb investment in Graham, optimizing your existing vacation rental, or exploring rental arbitrage opportunities, understanding the Graham Airbnb data is crucial. Leveraging the low regulation environment is key to maximizing your short term rental income potential. Let's dive into the specifics.
Key Graham Airbnb Performance Metrics Overview
Monthly Airbnb Revenue Variations & Income Potential in Graham (2026)
Understanding the monthly revenue variations for Airbnb listings in Graham is key to maximizing your short term rental income potential. Seasonality significantly impacts earnings. Our analysis, based on data from the past 12 months, shows that the peak revenue month for STRs in Graham is typically June, while January often presents the lowest earnings, highlighting opportunities for strategic pricing adjustments during shoulder and low seasons. Explore the typical Airbnb income in Graham across different performance tiers:
- Best-in-class properties (Top 10%) achieve $8,919+ monthly, often utilizing dynamic pricing and superior guest experiences.
- Strong performing properties (Top 25%) earn $5,440 or more, indicating effective management and desirable locations/amenities.
- Typical properties (Median) generate around $2,669 per month, representing the average market performance.
- Entry-level properties (Bottom 25%) see earnings around $1,399, often with potential for optimization.
Average Monthly Airbnb Earnings Trend in Graham
Graham Airbnb Occupancy Rate Trends (2026)
Maximize your bookings by understanding the Graham STR occupancy trends. Seasonal demand shifts significantly influence how often properties are booked. Typically, Junesees the highest demand (peak season occupancy), while January experiences the lowest (low season). Effective strategies, like adjusting minimum stays or offering promotions, can boost occupancy during slower periods. Here's how different property tiers perform in Graham:
- Best-in-class properties (Top 10%) achieve 76%+ occupancy, indicating high desirability and potentially optimized availability.
- Strong performing properties (Top 25%) maintain 56% or higher occupancy, suggesting good market fit and guest satisfaction.
- Typical properties (Median) have an occupancy rate around 33%.
- Entry-level properties (Bottom 25%) average 17% occupancy, potentially facing higher vacancy.
Average Monthly Occupancy Rate Trend in Graham
Average Daily Rate (ADR) Airbnb Trends in Graham (2026)
Effective short term rental pricing strategy in Graham involves understanding monthly ADR fluctuations. The Average Daily Rate (ADR) for Airbnb in Graham typically peaks in June and dips lowest during February. Leveraging Airbnb dynamic pricing tools or strategies based on this seasonality can significantly boost revenue. Here's a look at the typical nightly rates achieved:
- Best-in-class properties (Top 10%) command rates of $951+ per night, often due to premium features or locations.
- Strong performing properties (Top 25%) achieve nightly rates of $543 or more.
- Typical properties (Median) charge around $234 per night.
- Entry-level properties (Bottom 25%) earn around $137 per night.
Average Daily Rate (ADR) Trend by Month in Graham
Get Live Graham Market Intelligence 👇

Explore Real-time Analytics
Airbnb Seasonality Analysis & Trends in Graham (2026)
Peak Season (June, July, August)
- Revenue averages $6,485 per month
- Occupancy rates average 46.3%
- Daily rates average $419
Shoulder Season
- Revenue averages $3,745 per month
- Occupancy maintains around 37.3%
- Daily rates hold near $407
Low Season (January, February, March)
- Revenue drops to average $2,435 per month
- Occupancy decreases to average 29.4%
- Daily rates adjust to average $379
Seasonality Insights for Graham
- The Airbnb seasonality in Graham shows highly seasonal trends requiring careful strategy. While the sections above show seasonal averages, it's also insightful to look at the extremes:
- During the high season, the absolute peak month showcases Graham's highest earning potential, with monthly revenues capable of climbing to $6,787, occupancy reaching a high of 48.3%, and ADRs peaking at $426.
- Conversely, the slowest single month of the year, typically falling within the low season, marks the market's lowest point. In this month, revenue might dip to $1,948, occupancy could drop to 20.3%, and ADRs may adjust down to $361.
- Understanding both the seasonal averages and these monthly peaks and troughs in revenue, occupancy, and ADR is crucial for maximizing your Airbnb profit potential in Graham.
Seasonal Strategies for Maximizing Profit
- Peak Season: Maximize revenue through premium pricing and potentially longer minimum stays. Ensure high availability.
- Low Season: Offer competitive pricing, special promotions (e.g., extended stay discounts), and flexible cancellation policies. Target off-season travelers like remote workers or budget-conscious guests.
- Shoulder Seasons: Implement dynamic pricing that balances peak and low rates. Target weekend travelers or specific events. Offer slightly more flexible terms than peak season.
- Regularly analyze your own performance against these Graham seasonality benchmarks and adjust your pricing and availability strategy accordingly.
Best Areas for Airbnb Investment in Graham (2026)
Exploring the top neighborhoods for short-term rentals in Graham? This section highlights key areas, outlining why they are attractive for hosts and guests, along with notable local attractions. Consider these locations based on your target guest profile and investment strategy.
| Neighborhood / Area | Why Host Here? (Target Guests & Appeal) | Key Attractions & Landmarks |
|---|---|---|
| Lake Graham | A serene lake perfect for fishing, boating, and enjoying nature. Great for travelers seeking a peaceful getaway with outdoor activities. | Lake Graham Park, Fishing, Boating, Nature Trails, Wildlife Viewing |
| Historic Downtown Graham | Rich in history and charm, this downtown area features unique shops, restaurants, and cultural sites. Ideal for guests looking to explore local character and history. | Graham Historic Museum, Graham Square, Local Restaurants, Art Galleries, Seasonal Events |
| Palo Pinto Mountains State Park | A beautiful state park offering hiking, camping, and scenic views. Popular with nature lovers and outdoor enthusiasts looking to explore Texas landscapes. | Hiking Trails, Camping Sites, Wildlife Watching, Panoramic Views |
| Graham Regional Airport Area | Convenient access for travelers flying in and out, making it ideal for business travelers or those needing easy airport access. | Airport Proximity, Nearby Accommodations, Transport Links |
| Local Vineyards | Graham is home to several local vineyards and wineries, attracting wine enthusiasts and guests seeking unique tasting experiences. | Wine Tastings, Vineyard Tours, Special Events |
| Graham City Parks | Family-friendly parks offering recreational activities and playgrounds, appealing to families traveling with children. | Playgrounds, Picnic Areas, Sports Facilities, Nature Trails |
| Annual Events Venues | Graham hosts various annual events like rodeos, festivals, and fairs, drawing in visitors throughout the year. | Rodeo Events, Festivals, Local Markets |
| Arts and Culture Spots | The growing art scene in Graham offers various cultural activities and experiences for art lovers and creatives. | Local Art Exhibits, Workshops, Cultural Festivals |
Understanding Airbnb License Requirements & STR Laws in Graham (2026)
While Graham, Texas, United States currently shows low STR regulations, specific Airbnb license requirements might still exist or change. Always verify the latest short term rental regulations and Airbnb license requirements directly with local government authorities for Graham to ensure full compliance before hosting.
(Source: AirROI data, 2026, finding no licensed listings among those analyzed)
Top Performing Airbnb Properties in Graham (2026)
Benchmark your potential! Explore examples of top-performing Airbnb properties in Grahambased on Trailing Twelve Month (TTM) revenue. Analyze their characteristics, revenue, occupancy rate, and ADR to understand what drives success in this market.
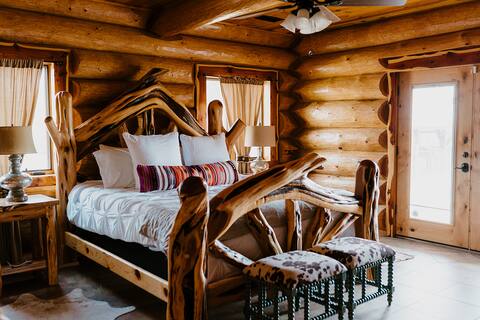
CO-vibes Log Cabin on 10 Acres, Pool + Outdoor Bar
Entire Place • 4 bedrooms
Lucky Enough @ PK Lake
Entire Place • 5 bedrooms
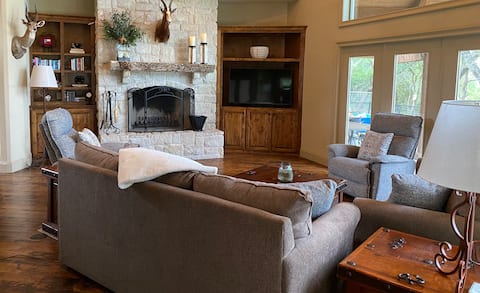
Lakefront with a view, private dock, pool/hot tub
Entire Place • 4 bedrooms
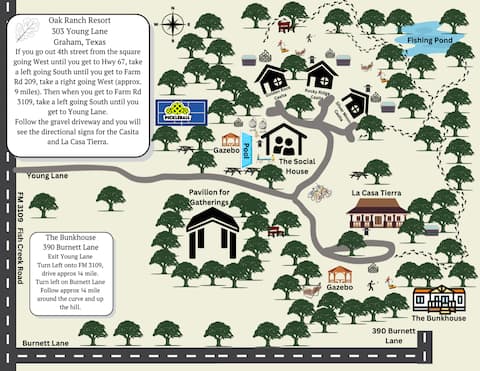
Oak Ranch Resort - Sleeps 40
Entire Place • 12 bedrooms
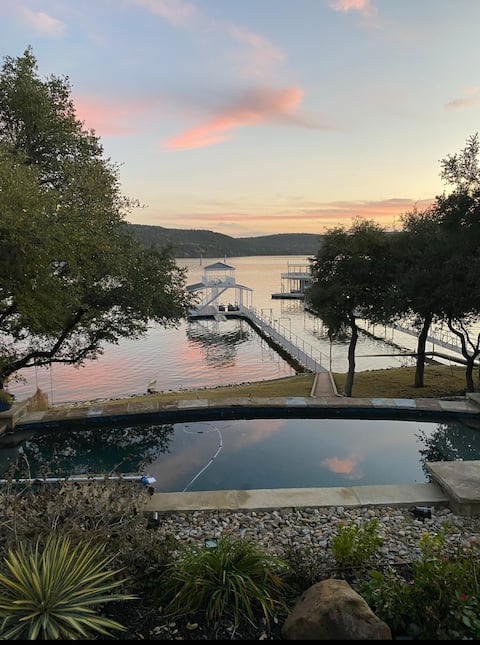
Lakefront Paradise on Possum Kingdom Lake
Entire Place • 5 bedrooms
Sunset Manor- with a DOCK & HOT TUB!
Entire Place • 5 bedrooms
Note: Performance varies based on location, size, amenities, seasonality, and management quality. Data reflects the past 12 months.
Top Performing Airbnb Hosts in Graham (2026)
Learn from the best! This table showcases top-performing Airbnb hosts in Graham based on the number of properties managed and estimated total revenue over the past year. Analyze their scale and performance metrics.
| Host Name | Properties | Grossing Revenue | Stay Reviews | Avg Rating |
|---|---|---|---|---|
| Kalli | 2 | $281,914 | 85 | 4.92/5.0 |
| SmartsRentals | 4 | $235,534 | 9 | 5.00/5.0 |
| Richard And Jane | 1 | $169,832 | 20 | 5.00/5.0 |
| Steven | 2 | $142,626 | 80 | 4.72/5.0 |
| Pam | 4 | $105,627 | 100 | 4.98/5.0 |
| Melissa | 1 | $103,107 | 40 | 4.85/5.0 |
| Phil | 1 | $97,767 | 2 | Not Rated |
| Stacy | 1 | $69,973 | 28 | 5.00/5.0 |
| Gwen | 1 | $69,622 | 12 | 5.00/5.0 |
| Maria | 2 | $66,698 | 105 | 4.98/5.0 |
Analyzing the strategies of top hosts, such as their property selection, pricing, and guest communication, can offer valuable lessons for optimizing your own Airbnb operations in Graham.
Dive Deeper: Advanced Graham STR Market Data (2026)
Ready to unlock more insights? AirROI provides access to advanced metrics and comprehensive Airbnb data for Graham. Explore detailed analytics beyond this report to refine your investment strategy, optimize pricing, and maximize your vacation rental profits.
Explore Advanced MetricsGraham Short-Term Rental Market Composition (2026): Property & Room Types
Room Type Distribution
Property Type Distribution
Market Composition Insights for Graham
- The Graham Airbnb market composition is heavily skewed towards Entire Home/Apt listings, which make up 96.9% of the 64 active rentals. This indicates strong guest preference for privacy and space.
- Looking at the property type distribution in Graham, House properties are the most common (57.8%), reflecting the local real estate landscape.
- Houses represent a significant 57.8% portion, catering likely to families or larger groups.
- Smaller segments like hotel/boutique, others, unique stays (combined 12.5%) offer potential for unique stay experiences.
Graham Airbnb Room Capacity Analysis (2026): Bedroom Distribution
Distribution of Listings by Number of Bedrooms
Room Capacity Insights for Graham
- The dominant room capacity in Graham is 2 bedrooms listings, making up 21.9% of the market. This suggests a strong demand for properties suitable for couples or solo travelers.
- Together, 2 bedrooms and 1 bedroom properties represent 43.8% of the active Airbnb listings in Graham, indicating a high concentration in these sizes.
- A significant 48.4% of listings offer 3+ bedrooms, catering to larger groups and families seeking more space in Graham.
Graham Vacation Rental Guest Capacity Trends (2026)
Distribution of Listings by Guest Capacity
Guest Capacity Insights for Graham
- The most common guest capacity trend in Graham vacation rentals is listings accommodating 8+ guests (42.2%). This suggests the primary traveler segment is likely larger groups.
- Properties designed for 8+ guests and 4 guests dominate the Graham STR market, accounting for 61.0% of listings.
- 57.9% of properties accommodate 6+ guests, serving the market segment for larger families or group travel in Graham.
- On average, properties in Graham are equipped to host 5.6 guests.
Graham Airbnb Booking Patterns (2026): Available vs. Booked Days
Available Days Distribution
Booked Days Distribution
Booking Pattern Insights for Graham
- The most common availability pattern in Graham falls within the 271-366 days range, representing 50% of listings. This suggests many properties have significant open periods on their calendars.
- Approximately 82.8% of listings show high availability (181+ days open annually), indicating potential for increased bookings or specific owner usage patterns.
- For booked days, the 31-90 days range is most frequent in Graham (37.5%), reflecting common guest stay durations or potential owner blocking patterns.
- A notable 18.8% of properties secure long booking periods (181+ days booked per year), highlighting successful long-term rental strategies or significant owner usage.
Graham Airbnb Minimum Stay Requirements Analysis
Distribution of Listings by Minimum Night Requirement
1 Night
21 listings
32.8% of total
2 Nights
18 listings
28.1% of total
3 Nights
6 listings
9.4% of total
4-6 Nights
1 listings
1.6% of total
30+ Nights
18 listings
28.1% of total
Key Insights
- The most prevalent minimum stay requirement in Graham is 1 Night, adopted by 32.8% of listings. This highlights the market's preference for shorter, flexible bookings.
- A strong majority (60.9%) of the Graham Airbnb data shows acceptance of very short stays (1-2 nights), indicating a dynamic, high-turnover market.
- A significant segment (28.1%) caters to monthly stays (30+ nights) in Graham, pointing to opportunities in the extended-stay market.
Recommendations
- Align with the market by considering a 1 Night minimum stay, as 32.8% of Graham hosts use this setting.
- Explore offering discounts for stays of 30+ nights to attract the 28.1% of the market seeking extended stays.
- Adjust minimum nights based on seasonality – potentially shorter during low season and longer during peak demand periods in Graham.
Graham Airbnb Cancellation Policy Trends Analysis (2026)
Limited
1 listings
1.6% of total
Flexible
17 listings
26.6% of total
Moderate
11 listings
17.2% of total
Firm
19 listings
29.7% of total
Strict
16 listings
25% of total
Cancellation Policy Insights for Graham
- The prevailing Airbnb cancellation policy trend in Graham is Firm, used by 29.7% of listings.
- A majority (54.7%) of hosts in Graham utilize Firm or Strict policies, indicating a market where hosts prioritize booking security.
Recommendations for Hosts
- Consider adopting a Firm policy to align with the 29.7% market standard in Graham.
- Regularly review your cancellation policy against competitors and market demand shifts in Graham.
Graham STR Booking Lead Time Analysis (2026)
Average Booking Lead Time by Month
Booking Lead Time Insights for Graham
- The overall average booking lead time for vacation rentals in Graham is 47 days.
- Guests book furthest in advance for stays during November (average 69 days), likely coinciding with peak travel demand or local events.
- The shortest booking windows occur for stays in January (average 12 days), indicating more last-minute travel plans during this time.
- Seasonally, Fall (60 days avg.) sees the longest lead times, while Winter (25 days avg.) has the shortest, reflecting typical travel planning cycles.
Recommendations for Hosts
- Use the overall average lead time (47 days) as a baseline for your pricing and availability strategy in Graham.
- For November stays, consider implementing length-of-stay discounts or slightly higher rates for bookings made less than 69 days out to capitalize on advance planning.
- During January, focus on last-minute booking availability and promotions, as guests book with very short notice (12 days avg.).
- Target marketing efforts for the Fall season well in advance (at least 60 days) to capture early planners.
- Monitor your own booking lead times against these Graham averages to identify opportunities for dynamic pricing adjustments.
Popular & Essential Airbnb Amenities in Graham (2026)
Amenity Prevalence
Amenity Insights for Graham
- Essential amenities in Graham that guests expect include: TV, Wifi, Air conditioning. Lacking these (any) could significantly impact bookings.
- Popular amenities like Free parking on premises, Smoke alarm, Hot water are common but not universal. Offering these can provide a competitive edge.
Recommendations for Hosts
- Ensure your listing includes all essential amenities for Graham: TV, Wifi, Air conditioning.
- Prioritize adding missing essentials: Wifi, Air conditioning.
- Consider adding popular differentiators like Free parking on premises or Smoke alarm to increase appeal.
- Highlight unique or less common amenities you offer (e.g., hot tub, dedicated workspace, EV charger) in your listing description and photos.
- Regularly check competitor amenities in Graham to stay competitive.
Graham Airbnb Guest Demographics & Profile Analysis (2026)
Guest Profile Summary for Graham
- The typical guest profile for Airbnb in Graham consists of primarily domestic travelers (99%), often arriving from nearby Lubbock, typically belonging to the Post-2000s (Gen Z/Alpha) group (50%), primarily speaking English or Spanish.
- Domestic travelers account for 98.9% of guests.
- Key international markets include United States (98.9%) and Poland (0.4%).
- Top languages spoken are English (76.2%) followed by Spanish (12.3%).
- A significant demographic segment is the Post-2000s (Gen Z/Alpha) group, representing 50% of guests.
Recommendations for Hosts
- Target domestic marketing efforts towards travelers from Lubbock and Fort Worth.
- Tailor amenities and listing descriptions to appeal to the dominant Post-2000s (Gen Z/Alpha) demographic (e.g., highlight fast WiFi, smart home features, local guides).
- Highlight unique local experiences or amenities relevant to the primary guest profile.
- Consider seasonal promotions aligned with peak travel times for key origin markets.
Nearby Short-Term Rental Market Comparison
How does the Graham Airbnb market stack up against its neighbors? Compare key performance metrics like average monthly revenue, ADR, and occupancy rates in surrounding areas to understand the broader regional STR landscape.
| Market | Active Properties | Monthly Revenue | Daily Rate | Avg. Occupancy |
|---|---|---|---|---|
| Strawn | 27 | $8,233 | $847.64 | 34% |
| Valley View | 25 | $5,111 | $484.73 | 39% |
| Bluff Dale | 18 | $4,063 | $411.68 | 29% |
| Flower Mound | 79 | $3,760 | $326.24 | 45% |
| Azle | 62 | $3,533 | $323.80 | 41% |
| Westworth Village | 11 | $3,530 | $240.30 | 48% |
| Tuscola | 11 | $3,458 | $245.08 | 51% |
| Highland Village | 15 | $3,363 | $345.42 | 48% |
| North Richland Hills | 95 | $3,119 | $257.08 | 45% |
| Corinth | 20 | $3,098 | $261.99 | 43% |