Houston, Texas Airbnb Market Data 2026: STR Report & Statistics
How much can you earn on Airbnb in Houston, Texas? Based on AirROI's 2026 dataset (July 2025 – June 2026), the short answer is $19,718 per year — at a $221 nightly rate, 37.1% occupancy, and a $81 RevPAR that reflects moderate rate-to-revenue efficiency with room to optimize.
Houston's 9,234 active listings and moderate demand with room for well-positioned listings to outperform make it a major short-term rental market. Supply grew 21.8% over the past year, yet revenue and nightly rates both trended upward — a signal that traveler demand is outpacing new inventory rather than being diluted by it. For hosts, pricing power remains intact even as competition increases.
Regulation is high, and hosts should factor licensing costs and compliance timelines into their launch plan. The data points to a market where fundamentals reward execution — the right property, priced well, in the right neighborhood still outperforms.

Table of Contents [hide] [show]
What Are the Key Airbnb Metrics in Houston?
In Houston, the headline Airbnb metrics are $19,718 in average annual revenue,37.1% occupancy, $221 ADR, and $81 in RevPAR, and guests book about 30 days in advance.
How Much Do Airbnb Hosts Earn Monthly in Houston?
Understanding the monthly revenue variations for Airbnb listings in Houston is key to maximizing your short term rental income potential. Seasonality significantly impacts earnings. Our analysis, based on data from the past 12 months, shows that the peak revenue month for STRs in Houston is typically March, while January often presents the lowest earnings, highlighting opportunities for strategic pricing adjustments during shoulder and low seasons. Explore the typical Airbnb income in Houston across different performance tiers:
- Best-in-class properties (Top 10%) achieve $5,925+ monthly, often utilizing dynamic pricing and superior guest experiences.
- Strong performing properties (Top 25%) earn $3,608 or more, indicating effective management and desirable locations/amenities.
- Typical properties (Median) generate around $1,994 per month, representing the average market performance.
- Entry-level properties (Bottom 25%) see earnings around $920, often with potential for optimization.
Average Monthly Airbnb Earnings Trend in Houston
What Is the Monthly Airbnb Occupancy Rate in Houston?
Maximize your bookings by understanding the Houston STR occupancy trends. Seasonal demand shifts significantly influence how often properties are booked. Typically, Marchsees the highest demand (peak season occupancy), while June experiences the lowest (low season). Effective strategies, like adjusting minimum stays or offering promotions, can boost occupancy during slower periods. Here's how different property tiers perform in Houston:
- Best-in-class properties (Top 10%) achieve 75%+ occupancy, indicating high desirability and potentially optimized availability.
- Strong performing properties (Top 25%) maintain 58% or higher occupancy, suggesting good market fit and guest satisfaction.
- Typical properties (Median) have an occupancy rate around 38%.
- Entry-level properties (Bottom 25%) average 19% occupancy, potentially facing higher vacancy.
Average Monthly Occupancy Rate Trend in Houston
What Is the Average Airbnb Nightly Rate in Houston?
Effective short term rental pricing strategy in Houston involves understanding monthly ADR fluctuations. The Average Daily Rate (ADR) for Airbnb in Houston typically peaks in June and dips lowest during January. Leveraging Airbnb dynamic pricing tools or strategies based on this seasonality can significantly boost revenue. Here's a look at the typical nightly rates achieved:
- Best-in-class properties (Top 10%) command rates of $390+ per night, often due to premium features or locations.
- Strong performing properties (Top 25%) achieve nightly rates of $256 or more.
- Typical properties (Median) charge around $162 per night.
- Entry-level properties (Bottom 25%) earn around $102 per night.
Average Daily Rate (ADR) Trend by Month in Houston
What Is the RevPAR for Airbnb in Houston?
RevPAR in Houston is currently $81. Because RevPAR combines nightly rates with realized occupancy, it is one of the cleanest ways to compare how efficiently listings turn demand into revenue across the market.
- Entry-level properties (Bottom 25%) see $33 RevPAR.
- Typical properties (Median) generate $62 RevPAR.
- Strong performers (Top 25%) earn $103 RevPAR.
- Best-in-class (Top 10%) achieve $160 RevPAR.
Average Monthly RevPAR Trend in Houston
RevPAR Insights for Houston
- The average RevPAR in Houston is $81. This metric combines nightly rates with realized occupancy, making it one of the best single-number indicators of market efficiency.
- The gap between the top 10% ($160) and bottom 25% ($33) is $127, indicating significant performance disparity driven by property quality, pricing strategy, and location.
- RevPAR peaks in Jun and bottoms out in Jan, mirroring the broader seasonal demand pattern and suggesting opportunities for dynamic pricing.
Recommendations for Hosts
- Track your own RevPAR monthly against these Houston benchmarks. If your RevPAR falls below the median of $62, examine whether low occupancy or low ADR is the primary drag.
- Top-quartile listings achieve $103+ RevPAR through a combination of competitive pricing, strong reviews, and strategic amenities. Target this tier through incremental improvements.
- Use RevPAR rather than revenue alone when comparing properties of different sizes — it normalizes for available nights and gives a more accurate picture of performance.
Get Live Houston Market Intelligence 👇
Explore Real-time Analytics
When Is the Peak Season for Airbnb in Houston?
Houston's peak Airbnb season falls in March, June, July, while the softest stretch is January, February, September. Overall, the market shows moderate seasonality with distinct peak and low periods, which should guide pricing, minimum stays, and cash-flow planning.
Peak Season (March, June, July)
- Revenue averages $3,607 per month
- Occupancy rates average 42.7%
- Daily rates average $257
Shoulder Season
- Revenue averages $2,586 per month
- Occupancy maintains around 39.7%
- Daily rates hold near $198
Low Season (January, February, September)
- Revenue drops to average $2,340 per month
- Occupancy decreases to average 38.7%
- Daily rates adjust to average $192
Seasonality Insights for Houston
- The Airbnb seasonality pattern in Houston shows moderate seasonality with distinct peak and low periods. While the sections above show seasonal averages, it is also insightful to look at the extremes:
- During the high season, the absolute peak month showcases Houston's highest earning potential, with monthly revenues climbing to $4,010, occupancy reaching 51.1%, and ADRs peaking at $355.
- Conversely, the slowest single month marks the market's lowest point — revenue may dip to $2,171, occupancy could drop to 32.7%, and ADRs may adjust to $184.
- Lower occupancy paired with meaningful seasonality means hosts in Houston need to maximize every peak-season booking and seriously consider whether off-season pricing adjustments or minimum-stay changes can capture incremental revenue.
Seasonal Strategies for Maximizing Profit
- Peak Season: Maximize revenue through premium pricing. In a high-regulation market like Houston, ensure your permit covers the number of nights you plan to book — some jurisdictions cap annual rental days.
- Low Season: Offer competitive pricing, extended-stay discounts, and flexible cancellation policies. Target off-season travelers like remote workers, budget-conscious guests, and travelers with flexible schedules.
- Shoulder Seasons: Implement dynamic pricing that bridges peak and low rates. Target weekend travelers, local events, and business visitors. Slightly more flexible terms than peak season can help maintain occupancy without deep discounting.
- Regularly analyze your own performance against these Houston seasonality benchmarks and adjust your pricing and availability strategy accordingly.
Do You Need a License for Airbnb in Houston?
Houston, Texas, United States has a high regulation classification, yet only 47% of listings show registration evidence. That gap between regulation on the books and compliance on the ground can shift quickly — municipalities often tighten enforcement in waves, putting unregistered operators at risk of fines or delisting. Always verify the latest short-term rental regulations and Airbnb license requirements directly with local government authorities for Houston to ensure full compliance before hosting.
(Source: AirROI data, 2026, based on 47% licensed listings)
What Are the Best Neighborhoods for Airbnb in Houston?
In a large, heavily regulated market like Houston, neighborhood selection is one of the strongest levers for Airbnb investment performance. Zoning rules, permitting availability, and guest demand patterns can vary block by block. The 8 neighborhoods below represent areas where short-term rental activity concentrates — understanding why each one attracts guests and hosts helps investors evaluate where their property type and budget fit best.
| Neighborhood / Area | Why Host Here? (Target Guests & Appeal) | Key Attractions & Landmarks |
|---|---|---|
| Montrose | Eclectic neighborhood known for its diverse culture, vibrant arts scene, and historic homes. Popular among young professionals and artists, Montrose offers unique dining, shopping, and nightlife options. | Menil Collection, Buffalo Bayou Park, Montrose Farmers Market, The Contemporary Arts Museum, Czech Cultural Center Houston |
| The Heights | Charming neighborhood with a mix of historic homes and modern developments. The Heights is known for its parks, local shops, and dining options, making it attractive for families and young professionals. | Woodland Park, Heights Hike and Bike Trail, The Heights Theater, Local boutiques, Great dining options |
| Downtown | Houston's central business district with a variety of entertainment, dining, and cultural attractions. Ideal for business travelers and tourists wanting to be at the heart of the city's activity. | Discovery Green, Minute Maid Park, Theatre District, George R. Brown Convention Center, Various bars and restaurants |
| Galleria/Uptown | Upscale area known for its luxury shopping and dining. The Galleria is one of the largest malls in the U.S., attracting shoppers and tourists alike, making it a prime location for hosting. | The Galleria Mall, Uptown Park, Highland Village, Post Oak Boulevard, Various fine dining options |
| Midtown | A vibrant neighborhood that combines residential, retail, and nightlife, making it popular with young professionals and families. Midtown has a lively atmosphere and is close to downtown. | Midtown Park, Restaurants and bars along Bagby Street, Houston Dynamo games, Arts and entertainment venues |
| Museum District | Cultural hub of Houston, home to many museums and cultural institutions. This area attracts tourists and families, making it a great place for short-term rentals. | Houston Museum of Natural Science, The Houston Zoo, The Menil Collection, The Contemporary Arts Museum, Various art galleries |
| Rice Village | Trendy shopping and dining area adjacent to Rice University. It attracts students, young professionals, and families, making it a vibrant place for hosting Airbnb. | Rice Village Shopping Center, Unique boutiques, Restaurants and cafes, Proximity to Rice University, Parks and green spaces |
| Woodlands | Planned community known for its beautiful parks, upscale homes, and shopping areas. The Woodlands offers a suburban experience with access to urban amenities, appealing to families and travelers. | The Woodlands Mall, Waterway Square, George Mitchell Nature Preserve, Cynthia Woods Mitchell Pavilion, Various outdoor activities |
Because Houston has a high regulation profile, confirming that short-term rental permits are available in your target neighborhood is a critical first step before committing to a property purchase. Regulation can vary at the neighborhood or district level even within the same city.
What Types of Properties Are on Airbnb in Houston?
Room Type Distribution
Property Type Distribution
Market Composition Insights for Houston
- The Houston Airbnb market composition is heavily skewed towards Entire Home/Apt listings, which make up 85.6% of the 9,234 active rentals. This indicates strong guest preference for privacy and space.
- Looking at the property type distribution in Houston, House properties are the most common (59.8%), reflecting the local real estate landscape.
- Houses represent a significant 59.8% portion, catering likely to families or larger groups.
- Smaller segments like hotel/boutique, others, outdoor/unique, unique stays (combined 6.2%) offer potential for unique stay experiences.
Houston Airbnb Room Capacity Analysis (2026): Bedroom Distribution
Distribution of Listings by Number of Bedrooms
Room Capacity Insights for Houston
- The dominant room capacity in Houston is 1 bedroom listings, making up 27.5% of the market. This suggests a strong demand for properties suitable for couples or solo travelers.
- Together, 1 bedroom and 3 bedrooms properties represent 54.0% of the active Airbnb listings in Houston, indicating a high concentration in these sizes.
- A significant 40.6% of listings offer 3+ bedrooms, catering to larger groups and families seeking more space in Houston.
Houston Vacation Rental Guest Capacity Trends (2026)
Distribution of Listings by Guest Capacity
Guest Capacity Insights for Houston
- The most common guest capacity trend in Houston vacation rentals is listings accommodating 8+ guests (28.7%). This suggests the primary traveler segment is likely larger groups.
- Properties designed for 8+ guests and 6 guests dominate the Houston STR market, accounting for 44.4% of listings.
- 47.6% of properties accommodate 6+ guests, serving the market segment for larger families or group travel in Houston.
- On average, properties in Houston are equipped to host 4.8 guests.
How Do Listings in Houston Compare on Quality?
Listing quality in Houston can be approximated through presentation depth, bedroom count, and how often hosts disclose exact locations. These signals show how professionally the local supply base is merchandised.
Listing Quality Insights for Houston
- At 30.6 photos per listing on average, Houston hosts invest well in visual presentation. Listings with 20+ photos consistently outperform in search ranking and conversion.
- 20.0% of listings show their exact location. Lower disclosure rates can increase booking hesitation — guests want to know exactly where they are staying.
Recommendations for Hosts
- Enable exact location if possible — it removes a common source of guest uncertainty and can improve your listing's position in map-based searches.
- Use these quality indicators as a self-audit checklist. Listings that exceed the Houston averages across all three metrics are better positioned for premium pricing.
What Amenities Do Airbnb Guests Expect in Houston?
Amenity Prevalence
Amenity Insights for Houston
- Essential amenities in Houston that guests expect include: Wifi, Air conditioning, Smoke alarm, TV. Lacking these (any) could significantly impact bookings.
- Popular amenities like Heating, Kitchen, Free parking on premises are common but not universal. Offering these can provide a competitive edge.
Recommendations for Hosts
- Ensure your listing includes all essential amenities for Houston: Wifi, Air conditioning, Smoke alarm, TV.
- Prioritize adding missing essentials: Wifi, Air conditioning, Smoke alarm, TV.
- Consider adding popular differentiators like Heating or Kitchen to increase appeal.
- Highlight unique or less common amenities you offer (e.g., hot tub, dedicated workspace, EV charger) in your listing description and photos.
- Regularly check competitor amenities in Houston to stay competitive.
Which Airbnb Amenities Boost Revenue in Houston?
Not every amenity matters equally. This table focuses on the amenities most associated with higher revenue in Houston, which makes it more useful for prioritizing upgrades than a simple popularity list alone.
| Amenity | Prevalence | Revenue With | Revenue Without | Revenue Uplift |
|---|---|---|---|---|
TV | 96.9% | $20,192 | $4,767 | 323.6% |
Heating | 93.9% | $20,477 | $7,964 | 157.1% |
Kitchen | 93.7% | $20,488 | $8,339 | 145.7% |
Coffee maker | 81.8% | $22,037 | $9,282 | 137.4% |
Boat slipHigh opportunity | 0.2% | $44,616 | $19,675 | 126.8% |
Dishes and silverware | 85.3% | $21,473 | $9,568 | 124.4% |
Cooking basics | 83.5% | $21,691 | $9,769 | 122.0% |
River viewHigh opportunity | 0.1% | $42,944 | $19,693 | 118.1% |
Refrigerator | 85.4% | $21,374 | $10,020 | 113.3% |
Dryer | 82.1% | $21,780 | $10,242 | 112.7% |
Revenue Impact Insights for Houston
- TV tops the revenue impact list with a 323.6% uplift — listings with this amenity earn $20,192 vs. $4,767 without it.
- High-opportunity amenities — Boat slip, River view — combine revenue uplift above 100% with prevalence under 10%, meaning most competitors haven't adopted them yet.
- TV, Heating, Kitchen, Coffee maker, Dishes and silverware, Cooking basics, Refrigerator, Dryer — while widespread — still correlate with meaningful revenue gains, making them table stakes rather than true differentiators.
Recommendations for Hosts
- Prioritize adding Boat slip — it has the best combination of high revenue impact and low market saturation in Houston.
- Focus your upgrade budget on amenities in the top half of this table. Below-median amenities may improve guest experience but contribute less to revenue growth.
- Highlight revenue-impacting amenities prominently in your listing title, photos, and description — guests can't value what they don't notice.
Dive Deeper: Advanced Houston STR Market Data (2026)
Ready to unlock more insights? AirROI provides access to advanced metrics and comprehensive Airbnb data for Houston. Explore detailed analytics beyond this report to refine your investment strategy, optimize pricing, and maximize your vacation rental profits.
Explore Advanced MetricsHouston Airbnb Guest Demographics & Profile Analysis (2026)
Guest Profile Summary for Houston
- The typical guest profile for Airbnb in Houston consists of primarily domestic travelers (91%), often arriving from nearby Houston, typically belonging to the Post-2000s (Gen Z/Alpha) group (50%), primarily speaking English or Spanish.
- Domestic travelers account for 90.5% of guests.
- Key international markets include United States (90.5%) and Mexico (2.2%).
- Top languages spoken are English (65.3%) followed by Spanish (19.6%).
- A significant demographic segment is the Post-2000s (Gen Z/Alpha) group, representing 50% of guests.
Recommendations for Hosts
- Target domestic marketing efforts towards travelers from Houston and Austin.
- Tailor amenities and listing descriptions to appeal to the dominant Post-2000s (Gen Z/Alpha) demographic (e.g., highlight fast WiFi, smart home features, local guides).
- Highlight unique local experiences or amenities relevant to the primary guest profile.
- Consider seasonal promotions aligned with peak travel times for key origin markets.
What Are Airbnb Guest Ratings in Houston?
Listings in Houston average 4.75 out of 5 overall, with about 47.9 reviews per active listing and 26.3% of listings carrying the Guest Favorite badge.
Rating Breakdown by Category
Guest Rating Insights for Houston
- An average rating of 4.75 places Houston in solid territory. Most guests leave satisfied, though there is room for hosts to push toward the top tier.
- The strongest subcategory is Communication (4.86), while Location (4.7) trails behind — a useful signal for hosts looking to prioritize upgrades.
- 26.3% of listings carry the Guest Favorite badge, a strong trust signal that can meaningfully lift click-through and booking rates.
Recommendations for Hosts
- Focus improvement efforts on Location — even small gains in the weakest subcategory can lift overall ratings and search ranking.
- Encourage guests to leave reviews after checkout. Listings with more reviews rank higher in search results and convert browsers into bookers more effectively.
- With only 26.3% of listings earning Guest Favorite status, hosts who consistently exceed expectations have a clear competitive advantage.
Houston Airbnb Booking Patterns (2026): Available vs. Booked Days
Available Days Distribution
Booked Days Distribution
Booking Pattern Insights for Houston
- The most common availability pattern in Houston falls within the 271-366 days range, representing 60.1% of listings. This suggests many properties have significant open periods on their calendars.
- Approximately 87.6% of listings show high availability (181+ days open annually), indicating potential for increased bookings or specific owner usage patterns.
- For booked days, the 31-90 days range is most frequent in Houston (34%), reflecting common guest stay durations or potential owner blocking patterns.
- A notable 13.4% of properties secure long booking periods (181+ days booked per year), highlighting successful long-term rental strategies or significant owner usage.
How Far in Advance Do Guests Book Airbnb in Houston?
Average Booking Lead Time by Month
Booking Lead Time Insights for Houston
- The overall average booking lead time for vacation rentals in Houston is 30 days.
- Guests book furthest in advance for stays during June (average 54 days), likely coinciding with peak travel demand or local events.
- The shortest booking windows occur for stays in January (average 23 days), indicating more last-minute travel plans during this time.
- Seasonally, Summer (35 days avg.) sees the longest lead times, while Winter (26 days avg.) has the shortest, reflecting typical travel planning cycles.
Recommendations for Hosts
- Use the overall average lead time (30 days) as a baseline for your pricing and availability strategy in Houston.
- For June stays, consider implementing length-of-stay discounts or slightly higher rates for bookings made less than 54 days out to capitalize on advance planning.
- Target marketing efforts for the Summer season well in advance (at least 35 days) to capture early planners.
- Monitor your own booking lead times against these Houston averages to identify opportunities for dynamic pricing adjustments.
What Is the Average Length of Stay for Airbnb in Houston?
Guests in Houston stay about 6.3 nights on average, generating roughly 164,094 reservations and 17.8 bookings per listing in the latest AirROI dataset. The most common check-in time is 3:00 PM and check-out is 11:00 AM.
Monthly Length of Stay in Houston
Check-in Time Distribution
Check-out Time Distribution
Stay Pattern Insights for Houston
- A mid-range stay length points to leisure-driven demand — weekend getaways and short vacations. Hosts should optimize for quick turnover efficiency while keeping the guest experience smooth.
- 17.8 bookings per listing is a manageable pace that balances revenue with operational overhead.
- Stay lengths peak in Jul (6.2 nights) and shorten in May (4.2 nights). Adjust minimum-night requirements seasonally to match.
Recommendations for Hosts
- Leverage the longer-stay pattern by offering weekly discounts — even 5-10% off can convert browsing into bookings for guests considering an extended stay.
- Set your check-in time to match or beat the market standard of 3:00 PM. Offering early check-in flexibility can be a low-cost differentiator.
- Monitor length-of-stay seasonality to adjust minimum-night requirements — longer minimums during peak periods maximize revenue while shorter minimums fill gaps in shoulder seasons.
Houston Airbnb Minimum Stay Requirements Analysis
Distribution of Listings by Minimum Night Requirement
1 Night
2270 listings
24.6% of total
2 Nights
2121 listings
23% of total
3 Nights
409 listings
4.4% of total
4-6 Nights
399 listings
4.3% of total
7-29 Nights
1029 listings
11.1% of total
30+ Nights
3004 listings
32.5% of total
Key Insights
- The most prevalent minimum stay requirement in Houston is 30+ Nights, adopted by 32.5% of listings. This highlights the market's preference for longer commitments.
- A significant segment (32.5%) caters to monthly stays (30+ nights) in Houston, pointing to opportunities in the extended-stay market.
Recommendations
- Align with the market by considering a 30+ Nights minimum stay, as 32.5% of Houston hosts use this setting.
- If feasible, allowing 1-night stays, especially midweek or during low season, could capture last-minute bookings, as only 24.6% currently do.
- Explore offering discounts for stays of 30+ nights to attract the 32.5% of the market seeking extended stays.
- Adjust minimum nights based on seasonality – potentially shorter during low season and longer during peak demand periods in Houston.
Houston Airbnb Cancellation Policy Trends Analysis (2026)
Super Strict 60 Days
81 listings
0.9% of total
Limited
655 listings
7.1% of total
Super Strict 30 Days
142 listings
1.5% of total
Flexible
1927 listings
20.9% of total
Moderate
2231 listings
24.2% of total
Firm
2908 listings
31.5% of total
Strict
1285 listings
13.9% of total
Cancellation Policy Insights for Houston
- The prevailing Airbnb cancellation policy trend in Houston is Firm, used by 31.5% of listings.
- There's a relatively balanced mix between guest-friendly (45.1%) and stricter (45.4%) policies, offering choices for different guest needs.
Recommendations for Hosts
- Consider adopting a Firm policy to align with the 31.5% market standard in Houston.
- Using a Strict policy might deter some guests, as only 13.9% of listings use it. Evaluate if potential revenue protection outweighs possible lower booking rates.
- Regularly review your cancellation policy against competitors and market demand shifts in Houston.
How Much Are Airbnb Cleaning Fees in Houston?
Cleaning fees in Houston are meaningful operating levers, not just pass-through charges. What matters most is how often hosts charge them, how high they run relative to market norms, and how large a share of gross revenue they consume.
Cleaning Fee Insights for Houston
- 88.3% of listings charge a cleaning fee, making it standard practice in Houston. Guests expect it and factor it into their booking decisions.
- The gap between the average ($348) and median ($125) cleaning fee indicates some high-end properties are pulling the average up considerably.
- Cleaning fees represent 11.1% of gross revenue on average — a significant line item that impacts total guest cost and competitiveness.
Recommendations for Hosts
- Price your cleaning fee competitively against the Houston median of $125. Fees significantly above market norms can deter bookings, especially for shorter stays.
- Consider whether bundling the cleaning fee into a slightly higher nightly rate might improve conversion, since many guests filter by total price and separate fees can feel punitive.
- Monitor competitor cleaning fees regularly. Airbnb's search algorithm factors in total price, so a well-calibrated cleaning fee can improve your listing's ranking.
What Do the Top Airbnb Listings in Houston Look Like?
Benchmark your potential! Explore examples of top-performing Airbnb properties in Houstonbased on Trailing Twelve Month (TTM) revenue. Analyze their characteristics, revenue, occupancy rate, and ADR to understand what drives success in this market.
Modern 14BR/14BA Duo • Sleeps 36 • Houston Rooftop
Entire Place • 14 bedrooms

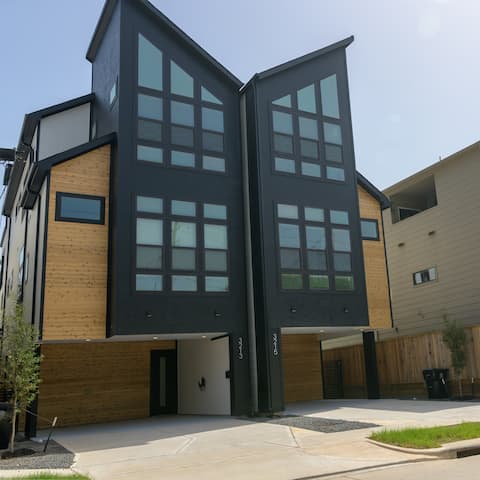
2 homes side-by-side custom designed | sleeps 22
Entire Place • 7 bedrooms

"Bali in Houston"/5 miles to FIFA&Rodeo/8Br&8Bath
Entire Place • 8 bedrooms

Private 25 Acre Estate w/ Lake: Fish & Canoe!
Entire Place • 6 bedrooms

14-Bed VIP Oasis| 65ft POoL 20 MiNs. to NRG (WC26)
Entire Place • 14 bedrooms

World Cup 2 min from Fan Festival Sleeps 22+Casita
Entire Place • 6 bedrooms
Note: Performance varies based on location, size, amenities, seasonality, and management quality. Data reflects the past 12 months.
Who Are the Top Airbnb Hosts in Houston?
Learn from the best! This table showcases top-performing Airbnb hosts in Houston based on the number of properties managed and estimated total revenue over the past year. Analyze their scale and performance metrics.
| Host Name | Properties | Grossing Revenue | Stay Reviews | Avg Rating |
|---|---|---|---|---|
| Phillip | 247 | $6,723,675 | 14363 | 4.59/5.0 |
| Fernando And Armando | 64 | $3,316,868 | 4480 | 4.81/5.0 |
| Evolve | 98 | $2,078,879 | 1600 | 4.62/5.0 |
| Starlike Host | 12 | $1,590,906 | 276 | 4.92/5.0 |
| Goldnest | 16 | $1,485,130 | 557 | 4.71/5.0 |
| Hple-N | 53 | $1,403,885 | 1000 | 4.50/5.0 |
| Rent With Jovan | 11 | $1,172,613 | 305 | 4.73/5.0 |
| Ehab | 49 | $1,169,751 | 1745 | 4.73/5.0 |
| Casey | 15 | $1,126,344 | 419 | 4.80/5.0 |
| Greg | 12 | $1,079,981 | 504 | 4.63/5.0 |
Analyzing the strategies of top hosts, such as their property selection, pricing, and guest communication, can offer valuable lessons for optimizing your own Airbnb operations in Houston.
Who Are the Airbnb Hosts in Houston?
Houston has a relatively balanced host base.
Host Profile Insights for Houston
- A 48.1% Superhost share is healthy — enough experienced operators to anchor quality without making the market impenetrable for newcomers.
- 7.6% of listings are professionally managed, reflecting a market still dominated by individual hosts.
- 11.7% of listings have Instant Book enabled. Lower Instant Book adoption means many guests must request approval, which can slow conversions.
- 65.9% of listings use Airbnb's simplified pricing (host-only fee), where the host pays the entire platform service fee and the guest sees one all-in price with no separate Airbnb service charge. High adoption signals a professional, PMS-connected host base — Airbnb mandates simplified pricing for software-connected listings.
Recommendations for Hosts
- Earning Superhost status can significantly improve search ranking and guest trust. Focus on maintaining high response rates, low cancellations, and strong reviews.
- Consider enabling Instant Book — it reduces booking friction and Airbnb's algorithm tends to favor Instant Book listings in search results.
- With 42.4% cohosted listings, there may be a growing local market for property management services.
- Benchmark your host metrics against these Houston averages regularly and adjust your hosting strategy based on what top performers do differently.
Top Professional Management Companies in Houston
These are the highest-grossing professional property management operations in Houston, ranked by total revenue across their portfolio. Their performance metrics offer a benchmark for what institutional-level hosting looks like in this market.
| Company | Listings | Revenue | ADR | Occ. | Rating |
|---|---|---|---|---|---|
| Fernando And Armando | 64 | $3,316,868 | $293 | 60.1% | 4.81/5 |
| Evolve | 98 | $2,078,879 | $298 | 31.8% | 4.62/5 |
| Goldnest | 16 | $1,485,130 | $719 | 39.9% | 4.71/5 |
| Hple-N | 53 | $1,403,885 | $315 | 33.1% | 4.50/5 |
| Casey | 15 | $1,126,344 | $566 | 42.7% | 4.80/5 |
| Vistavant | 39 | $906,184 | $299 | 33.5% | 4.89/5 |
| Lodgeur | 95 | $882,790 | $139 | 39.3% | 4.78/5 |
| Damon | 21 | $753,465 | $440 | 36.2% | 4.77/5 |
| RSB Living | 15 | $745,998 | $445 | 40.7% | 4.80/5 |
| Exceed OK | 15 | $740,356 | $261 | 57.5% | 4.77/5 |
Management Company Insights for Houston
- The leading management company, Fernando And Armando, operates 64 listings with $3,316,868 in gross revenue — a useful benchmark for what scale looks like in Houston.
- Top managers average 43 properties each, pointing to a market where portfolio scale is a meaningful competitive factor.
- Professionally managed listings in the top tier average 4.75/5 in guest ratings — demonstrating that scale and quality can coexist.
Recommendations
- With only 7.6% of listings professionally managed, there may be an opportunity to differentiate through more structured operations and consistent guest experiences.
- Study how top management companies price, position, and maintain their portfolios — their ADR and occupancy rates reflect strategies refined across dozens of listings.
- If you're considering hiring a property manager, compare their portfolio performance against these benchmarks before committing.
How Does Houston's Airbnb Market Compare to Nearby Cities?
How does the Houston Airbnb market stack up against its neighbors? Compare key performance metrics like average monthly revenue, ADR, and occupancy rates in surrounding areas to understand the broader regional STR landscape.
Compared with Deer Park, Houston has 7 percentage points lower occupancy and about $18 lower ADR. That helps frame whether this market is winning more on demand, pricing, or both.
| Market | Active Properties | Monthly Revenue | Daily Rate | Avg. Occupancy |
|---|---|---|---|---|
| Midfield | 10 | $4,529 | $560.95 | 23% |
| Crystal Beach | 141 | $3,756 | $446.74 | 33% |
| Jamaica Beach | 210 | $3,609 | $423.54 | 36% |
| Hockley | 11 | $3,303 | $290.24 | 40% |
| Bolivar Peninsula | 1,023 | $3,066 | $423.96 | 32% |
| Schulenburg | 28 | $2,872 | $357.73 | 30% |
| Seabrook | 59 | $2,851 | $280.39 | 36% |
| Columbus | 18 | $2,849 | $326.70 | 32% |
| Deer Park | 16 | $2,793 | $239.31 | 44% |
| Chappell Hill | 10 | $2,760 | $550.80 | 31% |
Frequently Asked Questions About Airbnb in Houston
These quick answers summarize the most common investor and operator questions using AirROI's latest market data for Houston.
How much do Airbnb hosts make in Houston?
Houston hosts earn about $19,718 per year on average, with an average nightly rate of $221 and RevPAR of $81. Those figures describe the typical revenue environment for active listings in Houston, Texas, not the ceiling for the best operators. Source: AirROI 2026 data, Houston market, July 2025 to June 2026.
What is the average Airbnb occupancy rate in Houston?
The average Airbnb occupancy rate in Houston is 37.1%. March is the strongest month and January is the softest, so hosts should expect demand to move meaningfully throughout the year rather than stay flat.
What is the average Airbnb daily rate in Houston?
Listings in Houston average $221 per night. The broader pricing spread also matters: lower-performing listings cluster closer to the lower quartiles, while premium homes can price materially above the city average when demand spikes or listing quality stands out.
How many Airbnb listings are active in Houston?
Houston currently has about 9,234 active Airbnb listings in AirROI's market dataset. That supply count helps explain how competitive the market is, how much depth there is for benchmarking, and whether the market behaves like a niche destination or a scaled urban market.
How strict are short-term rental regulations in Houston?
AirROI currently classifies the short-term rental regulation level in Houston as High. The dataset also shows about 46.9% of listings with registration evidence. That is a market signal, not legal advice, so hosts should still confirm current licensing and compliance rules locally before listing.
What is the RevPAR for Airbnb in Houston?
RevPAR in Houston is about $81. That metric combines pricing and occupancy into one efficiency number, so it is often a better quick benchmark than ADR alone when investors want to compare how well listings convert nightly rates into realized revenue.
Is Airbnb profitable in Houston?
Occupancy of 37.1% means Houston is a more selective market. Profitability is achievable but requires careful cost management, premium positioning, or targeting longer stays to reduce turnover. Average annual revenue is $19,718, but individual returns depend on property type, location within the city, and the host's operating efficiency.
How far in advance do guests book Airbnb in Houston?
The average booking lead time in Houston is about 30 days — a moderate lead time that gives hosts planning visibility while still benefiting from last-minute bookings. Hosts who understand their market's booking cadence can adjust minimum stays and pricing windows accordingly.
What are the best neighborhoods for Airbnb in Houston?
Based on AirROI's analysis, some of the top neighborhoods for short-term rentals in Houston include Montrose, The Heights, Downtown. Each area attracts different guest profiles — from business travelers to leisure visitors — so the best location depends on the property type and target audience a host is aiming for. See the full neighborhood breakdown above.
What type of property performs best on Airbnb in Houston?
entire_home listings make up 85.6% of the active supply in Houston. The most common configuration does not always mean the most profitable — operators who identify underserved property types or bedroom counts can sometimes outperform the market average by filling a gap in local supply.
How does Houston compare to nearby Airbnb markets?
Among neighboring markets, Midfield posts $54,343 in average annual revenue with 22.7% occupancy, compared to Houston's $19,718 and 37.1%. Comparing nearby markets helps investors understand whether a destination's performance reflects local demand or broader regional trends.
What is the average length of stay in Houston?
The average Airbnb stay length in Houston is about 6.3 nights. That matters for turnover, cleaning operations, and pricing strategy because shorter stays increase changeovers while longer stays can smooth occupancy and reduce operational friction.
What is the average Airbnb guest rating in Houston?
Airbnb listings in Houston average 4.75 out of 5 overall. About 26.3% of listings carry the guest favorite badge, which suggests a meaningful share of inventory is competing on review quality rather than price alone.
Which amenities boost Airbnb revenue in Houston?
TV and Heating are among the strongest revenue-linked amenities in Houston. In AirROI's latest dataset, listings with these amenities outperform those without on average revenue, which makes amenities analysis useful for prioritizing investment and listing upgrades.
Do Airbnb hosts charge cleaning fees in Houston?
Yes. About 88.3% of active Airbnb listings in Houston charge a cleaning fee, and the average fee is $348. The more important operating benchmark is how much of gross revenue that fee consumes, not just the absolute dollar amount.
What percentage of Airbnb hosts are Superhosts in Houston?
A 48.1% Superhost rate signals a highly competitive market where review quality and responsiveness are table stakes, not differentiators.
About AirROI Market Data
AirROI tracks over 20 million properties across 190+ countries and maintains 15+ years of historical performance data, making it one of the deepest Airbnb and STR intelligence platforms available. The analytics pipeline aggregates listing-level data monthly — revenue, occupancy, nightly rates, RevPAR, guest demographics, booking patterns, and competitive supply — so investors and operators can benchmark any market against its own history and against neighboring destinations.
Real estate investors, property managers, financial institutions, hedge funds, tourism boards, hospitality consultants, tech platforms, and academic researchers rely on AirROI data to underwrite acquisitions, optimize pricing, model macro trends, and conduct peer-reviewed research. Data is available through in-depth market reports like this one and the Airbnb API with 22 endpoints and an Airbnb MCP Server for AI agents.
AirROI proprietary analytics as of 2026-06-30. Metrics reflect trailing twelve-month aggregates from active listings. Revenue figures are market averages, not projections. Neighborhood descriptions are AI-generated and reviewed for accuracy. For full methodology, see the data methodology page.