Hurst Airbnb Market Analysis 2025: Short Term Rental Data & Vacation Rental Statistics in Texas, United States
Is Airbnb profitable in Hurst in 2025? Explore comprehensive Airbnb analytics for Hurst, Texas, United States to uncover income potential. This 2025 STR market report for Hurst, based on AirROI data from July 2024 to June 2025, reveals key trends in the niche market of 19 active listings.
Whether you're considering an Airbnb investment in Hurst, optimizing your existing vacation rental, or exploring rental arbitrage opportunities, understanding the Hurst Airbnb data is crucial. Leveraging the low regulation environment is key to maximizing your short term rental income potential. Let's dive into the specifics.
Key Hurst Airbnb Performance Metrics Overview
Monthly Airbnb Revenue Variations & Income Potential in Hurst (2025)
Understanding the monthly revenue variations for Airbnb listings in Hurst is key to maximizing your short term rental income potential. Seasonality significantly impacts earnings. Our analysis, based on data from the past 12 months, shows that the peak revenue month for STRs in Hurst is typically March, while June often presents the lowest earnings, highlighting opportunities for strategic pricing adjustments during shoulder and low seasons. Explore the typical Airbnb income in Hurst across different performance tiers:
- Best-in-class properties (Top 10%) achieve $4,208+ monthly, often utilizing dynamic pricing and superior guest experiences.
- Strong performing properties (Top 25%) earn $3,006 or more, indicating effective management and desirable locations/amenities.
- Typical properties (Median) generate around $1,642 per month, representing the average market performance.
- Entry-level properties (Bottom 25%) see earnings around $797, often with potential for optimization.
Average Monthly Airbnb Earnings Trend in Hurst
Hurst Airbnb Occupancy Rate Trends (2025)
Maximize your bookings by understanding the Hurst STR occupancy trends. Seasonal demand shifts significantly influence how often properties are booked. Typically, Marchsees the highest demand (peak season occupancy), while June experiences the lowest (low season). Effective strategies, like adjusting minimum stays or offering promotions, can boost occupancy during slower periods. Here's how different property tiers perform in Hurst:
- Best-in-class properties (Top 10%) achieve 74%+ occupancy, indicating high desirability and potentially optimized availability.
- Strong performing properties (Top 25%) maintain 58% or higher occupancy, suggesting good market fit and guest satisfaction.
- Typical properties (Median) have an occupancy rate around 36%.
- Entry-level properties (Bottom 25%) average 21% occupancy, potentially facing higher vacancy.
Average Monthly Occupancy Rate Trend in Hurst
Average Daily Rate (ADR) Airbnb Trends in Hurst (2025)
Effective short term rental pricing strategy in Hurst involves understanding monthly ADR fluctuations. The Average Daily Rate (ADR) for Airbnb in Hurst typically peaks in June and dips lowest during August. Leveraging Airbnb dynamic pricing tools or strategies based on this seasonality can significantly boost revenue. Here's a look at the typical nightly rates achieved:
- Best-in-class properties (Top 10%) command rates of $240+ per night, often due to premium features or locations.
- Strong performing properties (Top 25%) achieve nightly rates of $196 or more.
- Typical properties (Median) charge around $106 per night.
- Entry-level properties (Bottom 25%) earn around $57 per night.
Average Daily Rate (ADR) Trend by Month in Hurst
Get Live Hurst Market Intelligence 👇

Explore Real-time Analytics
Airbnb Seasonality Analysis & Trends in Hurst (2025)
Peak Season (March, April, August)
- Revenue averages $2,735 per month
- Occupancy rates average 48.7%
- Daily rates average $141
Shoulder Season
- Revenue averages $1,961 per month
- Occupancy maintains around 40.0%
- Daily rates hold near $132
Low Season (January, May, June)
- Revenue drops to average $1,645 per month
- Occupancy decreases to average 33.6%
- Daily rates adjust to average $149
Seasonality Insights for Hurst
- The Airbnb seasonality in Hurst shows moderate seasonality with distinct peak and low periods. While the sections above show seasonal averages, it's also insightful to look at the extremes:
- During the high season, the absolute peak month showcases Hurst's highest earning potential, with monthly revenues capable of climbing to $2,998, occupancy reaching a high of 52.0%, and ADRs peaking at $165.
- Conversely, the slowest single month of the year, typically falling within the low season, marks the market's lowest point. In this month, revenue might dip to $1,558, occupancy could drop to 27.6%, and ADRs may adjust down to $127.
- Understanding both the seasonal averages and these monthly peaks and troughs in revenue, occupancy, and ADR is crucial for maximizing your Airbnb profit potential in Hurst.
Seasonal Strategies for Maximizing Profit
- Peak Season: Maximize revenue through premium pricing and potentially longer minimum stays. Ensure high availability.
- Low Season: Offer competitive pricing, special promotions (e.g., extended stay discounts), and flexible cancellation policies. Target off-season travelers like remote workers or budget-conscious guests.
- Shoulder Seasons: Implement dynamic pricing that balances peak and low rates. Target weekend travelers or specific events. Offer slightly more flexible terms than peak season.
- Regularly analyze your own performance against these Hurst seasonality benchmarks and adjust your pricing and availability strategy accordingly.
Best Areas for Airbnb Investment in Hurst (2025)
Exploring the top neighborhoods for short-term rentals in Hurst? This section highlights key areas, outlining why they are attractive for hosts and guests, along with notable local attractions. Consider these locations based on your target guest profile and investment strategy.
| Neighborhood / Area | Why Host Here? (Target Guests & Appeal) | Key Attractions & Landmarks |
|---|---|---|
| Hurst Town Center | A vibrant area with shopping, dining, and entertainment options. It's a focal point for local events and activities, appealing to both tourists and locals. | NorthEast Mall, Hurst Recreation Center, Hurst Plaza, Bob Eden Park, Cinemark Tinseltown |
| Forest Hills | A residential neighborhood known for its family-friendly atmosphere and proximity to parks, making it ideal for families visiting the area. | Bassey Park, Parks at Hurst, Thompson Park |
| Hurst-Euless-Bedford (HEB) | A centralized area that connects Hurst, Euless, and Bedford, offering convenience to attractions in all three cities. It’s a growing hot spot for short-term rentals. | Hurst Community Park, Bedford Splash, Playgrounds and recreational areas |
| Shady Grove | A quieter, residential area that's perfect for visitors looking for a home-away-from-home feel while being close to the Dallas-Fort Worth attractions. | Shady Grove Park, Local dining options, Community events |
| Hurst Hills | A peaceful neighborhood known for its parks and family-friendly environment, attracting travelers looking for a serene stay close to the city. | Parks in Hurst Hills, Neighborhood shops, Community centers |
| Northwest Hurst | Offers a suburban feel with great access to major highways, making it easy for guests to explore the Dallas-Fort Worth area while enjoying a quieter setting. | Local parks, Sandy Lake Amusement Park, Nearby shopping centers |
| South Hurst | An attractive area with a mix of residential and commercial spaces, appealing to visitors looking for convenience and comfort. | Shopping options, Dining establishments, Local gyms |
| Hurst Sports Complex | Ideal for sports enthusiasts, this area hosts various sporting events and activities, drawing families and individuals to the facilities. | Hurst Sports Complex, Local sports events, Recreational activities |
Understanding Airbnb License Requirements & STR Laws in Hurst (2025)
While Hurst, Texas, United States currently shows low STR regulations, specific Airbnb license requirements might still exist or change. Always verify the latest short term rental regulations and Airbnb license requirements directly with local government authorities for Hurst to ensure full compliance before hosting.
(Source: AirROI data, 2025, based on 5% licensed listings)
Top Performing Airbnb Properties in Hurst (2025)
Benchmark your potential! Explore examples of top-performing Airbnb properties in Hurstbased on Trailing Twelve Month (TTM) revenue. Analyze their characteristics, revenue, occupancy rate, and ADR to understand what drives success in this market.

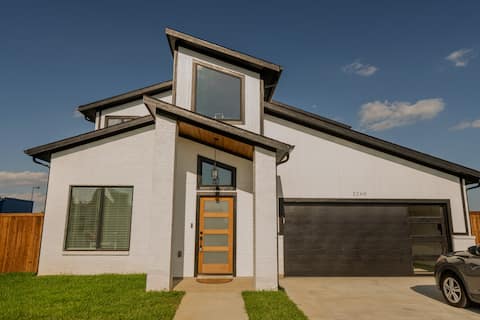
Spacious DFW 4BR for 8 Guests
Entire Place • 4 bedrooms

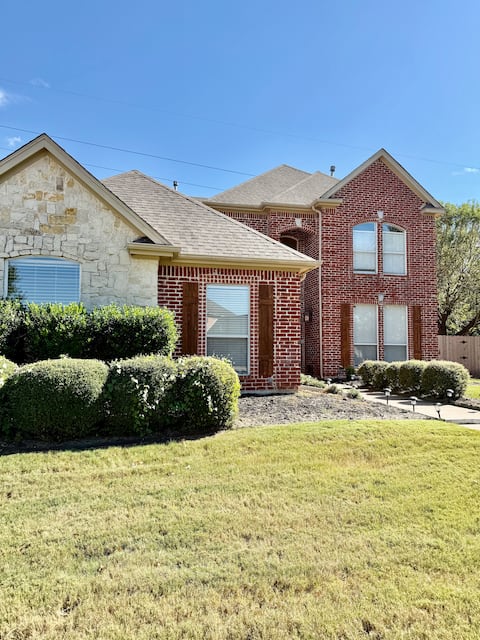
Centrally located 3 bdrm w pool & office
Entire Place • 3 bedrooms
NEW Urban Cowboy. Near DFW airport & AT&T stadium
Entire Place • 4 bedrooms

Relaxing retreat
Entire Place • 3 bedrooms
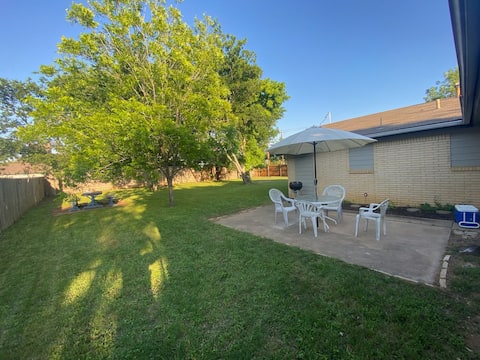
Spacious Backyard Family Friendly Home
Entire Place • 3 bedrooms
Cottonbelt Trail
Entire Place • 4 bedrooms
Note: Performance varies based on location, size, amenities, seasonality, and management quality. Data reflects the past 12 months.
Top Performing Airbnb Hosts in Hurst (2025)
Learn from the best! This table showcases top-performing Airbnb hosts in Hurst based on the number of properties managed and estimated total revenue over the past year. Analyze their scale and performance metrics.
| Host Name | Properties | Grossing Revenue | Stay Reviews | Avg Rating |
|---|---|---|---|---|
| Matthew | 1 | $48,293 | 34 | 4.94/5.0 |
| Brie | 2 | $38,714 | 64 | 4.76/5.0 |
| Alberta | 2 | $34,135 | 17 | 5.00/5.0 |
| Kathleen | 1 | $28,331 | 86 | 4.93/5.0 |
| Supriya | 1 | $25,877 | 8 | 4.63/5.0 |
| Cherise | 1 | $21,287 | 2 | Not Rated |
| Host #518089898 | 1 | $12,685 | 0 | Not Rated |
| Cornelius | 1 | $9,545 | 3 | 5.00/5.0 |
| Eddie | 3 | $9,282 | 246 | 4.96/5.0 |
| Natalia | 1 | $7,746 | 13 | 4.69/5.0 |
Analyzing the strategies of top hosts, such as their property selection, pricing, and guest communication, can offer valuable lessons for optimizing your own Airbnb operations in Hurst.
Dive Deeper: Advanced Hurst STR Market Data (2025)
Ready to unlock more insights? AirROI provides access to advanced metrics and comprehensive Airbnb data for Hurst. Explore detailed analytics beyond this report to refine your investment strategy, optimize pricing, and maximize your vacation rental profits.
Explore Advanced MetricsHurst Short-Term Rental Market Composition (2025): Property & Room Types
Room Type Distribution
Property Type Distribution
Market Composition Insights for Hurst
- The Hurst Airbnb market composition is heavily skewed towards Entire Home/Apt listings, which make up 73.7% of the 19 active rentals. This indicates strong guest preference for privacy and space.
- Looking at the property type distribution in Hurst, House properties are the most common (89.5%), reflecting the local real estate landscape.
- Houses represent a significant 89.5% portion, catering likely to families or larger groups.
- The presence of 5.3% Hotel/Boutique listings indicates integration with traditional hospitality.
Hurst Airbnb Room Capacity Analysis (2025): Bedroom Distribution
Distribution of Listings by Number of Bedrooms
Room Capacity Insights for Hurst
- The dominant room capacity in Hurst is 4 bedrooms listings, making up 26.3% of the market. This suggests a strong demand for properties suitable for families or small groups.
- Together, 4 bedrooms and 3 bedrooms properties represent 47.4% of the active Airbnb listings in Hurst, indicating a high concentration in these sizes.
- A significant 47.4% of listings offer 3+ bedrooms, catering to larger groups and families seeking more space in Hurst.
Hurst Vacation Rental Guest Capacity Trends (2025)
Distribution of Listings by Guest Capacity
Guest Capacity Insights for Hurst
- The most common guest capacity trend in Hurst vacation rentals is listings accommodating 6 guests (26.3%). This suggests the primary traveler segment is likely larger groups.
- Properties designed for 6 guests and 8+ guests dominate the Hurst STR market, accounting for 47.4% of listings.
- 57.9% of properties accommodate 6+ guests, serving the market segment for larger families or group travel in Hurst.
- On average, properties in Hurst are equipped to host 4.5 guests.
Hurst Airbnb Booking Patterns (2025): Available vs. Booked Days
Available Days Distribution
Booked Days Distribution
Booking Pattern Insights for Hurst
- The most common availability pattern in Hurst falls within the 271-366 days range, representing 68.4% of listings. This suggests many properties have significant open periods on their calendars.
- Approximately 89.5% of listings show high availability (181+ days open annually), indicating potential for increased bookings or specific owner usage patterns.
- For booked days, the 1-30 days range is most frequent in Hurst (31.6%), reflecting common guest stay durations or potential owner blocking patterns.
- A notable 10.5% of properties secure long booking periods (181+ days booked per year), highlighting successful long-term rental strategies or significant owner usage.
Hurst Airbnb Minimum Stay Requirements Analysis
Distribution of Listings by Minimum Night Requirement
1 Night
6 listings
33.3% of total
2 Nights
4 listings
22.2% of total
4-6 Nights
1 listings
5.6% of total
7-29 Nights
1 listings
5.6% of total
30+ Nights
6 listings
33.3% of total
Key Insights
- The most prevalent minimum stay requirement in Hurst is 1 Night, adopted by 33.3% of listings. This highlights the market's preference for shorter, flexible bookings.
- A significant segment (33.3%) caters to monthly stays (30+ nights) in Hurst, pointing to opportunities in the extended-stay market.
Recommendations
- Align with the market by considering a 1 Night minimum stay, as 33.3% of Hurst hosts use this setting.
- Explore offering discounts for stays of 30+ nights to attract the 33.3% of the market seeking extended stays.
- Adjust minimum nights based on seasonality – potentially shorter during low season and longer during peak demand periods in Hurst.
Hurst Airbnb Cancellation Policy Trends Analysis (2025)
Flexible
6 listings
33.3% of total
Moderate
9 listings
50% of total
Firm
1 listings
5.6% of total
Strict
2 listings
11.1% of total
Cancellation Policy Insights for Hurst
- The prevailing Airbnb cancellation policy trend in Hurst is Moderate, used by 50% of listings.
- The market strongly favors guest-friendly terms, with 83.3% of listings offering Flexible or Moderate policies. This suggests guests in Hurst may expect booking flexibility.
Recommendations for Hosts
- Consider adopting a Moderate policy to align with the 50% market standard in Hurst.
- Using a Strict policy might deter some guests, as only 11.1% of listings use it. Evaluate if potential revenue protection outweighs possible lower booking rates.
- Regularly review your cancellation policy against competitors and market demand shifts in Hurst.
Hurst STR Booking Lead Time Analysis (2025)
Average Booking Lead Time by Month
Booking Lead Time Insights for Hurst
- The overall average booking lead time for vacation rentals in Hurst is 26 days.
- Guests book furthest in advance for stays during September (average 85 days), likely coinciding with peak travel demand or local events.
- The shortest booking windows occur for stays in July (average 7 days), indicating more last-minute travel plans during this time.
- Seasonally, Fall (48 days avg.) sees the longest lead times, while Summer (9 days avg.) has the shortest, reflecting typical travel planning cycles.
Recommendations for Hosts
- Use the overall average lead time (26 days) as a baseline for your pricing and availability strategy in Hurst.
- For September stays, consider implementing length-of-stay discounts or slightly higher rates for bookings made less than 85 days out to capitalize on advance planning.
- During July, focus on last-minute booking availability and promotions, as guests book with very short notice (7 days avg.).
- Target marketing efforts for the Fall season well in advance (at least 48 days) to capture early planners.
- Monitor your own booking lead times against these Hurst averages to identify opportunities for dynamic pricing adjustments.
Popular & Essential Airbnb Amenities in Hurst (2025)
Amenity data is currently unavailable for Hurst.
Hurst Airbnb Guest Demographics & Profile Analysis (2025)
Guest Profile Summary for Hurst
- The typical guest profile for Airbnb in Hurst consists of primarily domestic travelers (98%), often arriving from nearby Amarillo, typically belonging to the Post-2000s (Gen Z/Alpha) group (50%), primarily speaking English or Spanish.
- Domestic travelers account for 97.7% of guests.
- Key international markets include United States (97.7%) and Australia (1.2%).
- Top languages spoken are English (83.9%) followed by Spanish (14.5%).
- A significant demographic segment is the Post-2000s (Gen Z/Alpha) group, representing 50% of guests.
Recommendations for Hosts
- Target domestic marketing efforts towards travelers from Amarillo and El Paso.
- Tailor amenities and listing descriptions to appeal to the dominant Post-2000s (Gen Z/Alpha) demographic (e.g., highlight fast WiFi, smart home features, local guides).
- Highlight unique local experiences or amenities relevant to the primary guest profile.
- Consider seasonal promotions aligned with peak travel times for key origin markets.
Nearby Short-Term Rental Market Comparison
How does the Hurst Airbnb market stack up against its neighbors? Compare key performance metrics like average monthly revenue, ADR, and occupancy rates in surrounding areas to understand the broader regional STR landscape.
| Market | Active Properties | Monthly Revenue | Daily Rate | Avg. Occupancy |
|---|---|---|---|---|
| Strawn | 25 | $5,858 | $724.01 | 30% |
| Star Harbor | 13 | $5,469 | $630.74 | 35% |
| Valley View | 25 | $4,348 | $439.81 | 40% |
| Groesbeck | 10 | $4,052 | $389.00 | 35% |
| Anna | 19 | $3,952 | $276.59 | 43% |
| DeSoto | 33 | $3,841 | $279.99 | 45% |
| Kennedale | 10 | $3,684 | $369.17 | 41% |
| Valley Mills | 19 | $3,559 | $379.63 | 40% |
| Highland Village | 15 | $3,537 | $320.38 | 47% |
| Palo Pinto | 11 | $3,396 | $312.97 | 43% |