Jefferson Airbnb Market Analysis 2026: Short Term Rental Data & Vacation Rental Statistics in Texas, United States
Is Airbnb profitable in Jefferson in 2026? Explore comprehensive Airbnb analytics for Jefferson, Texas, United States to uncover income potential. This 2026 STR market report for Jefferson, based on AirROI data from February 2025 to January 2026, reveals key trends in the niche market of 99 active listings.
Whether you're considering an Airbnb investment in Jefferson, optimizing your existing vacation rental, or exploring rental arbitrage opportunities, understanding the Jefferson Airbnb data is crucial. Leveraging the low regulation environment is key to maximizing your short term rental income potential. Let's dive into the specifics.
Key Jefferson Airbnb Performance Metrics Overview
Monthly Airbnb Revenue Variations & Income Potential in Jefferson (2026)
Understanding the monthly revenue variations for Airbnb listings in Jefferson is key to maximizing your short term rental income potential. Seasonality significantly impacts earnings. Our analysis, based on data from the past 12 months, shows that the peak revenue month for STRs in Jefferson is typically November, while January often presents the lowest earnings, highlighting opportunities for strategic pricing adjustments during shoulder and low seasons. Explore the typical Airbnb income in Jefferson across different performance tiers:
- Best-in-class properties (Top 10%) achieve $4,267+ monthly, often utilizing dynamic pricing and superior guest experiences.
- Strong performing properties (Top 25%) earn $2,659 or more, indicating effective management and desirable locations/amenities.
- Typical properties (Median) generate around $1,605 per month, representing the average market performance.
- Entry-level properties (Bottom 25%) see earnings around $858, often with potential for optimization.
Average Monthly Airbnb Earnings Trend in Jefferson
Jefferson Airbnb Occupancy Rate Trends (2026)
Maximize your bookings by understanding the Jefferson STR occupancy trends. Seasonal demand shifts significantly influence how often properties are booked. Typically, Novembersees the highest demand (peak season occupancy), while January experiences the lowest (low season). Effective strategies, like adjusting minimum stays or offering promotions, can boost occupancy during slower periods. Here's how different property tiers perform in Jefferson:
- Best-in-class properties (Top 10%) achieve 63%+ occupancy, indicating high desirability and potentially optimized availability.
- Strong performing properties (Top 25%) maintain 47% or higher occupancy, suggesting good market fit and guest satisfaction.
- Typical properties (Median) have an occupancy rate around 30%.
- Entry-level properties (Bottom 25%) average 18% occupancy, potentially facing higher vacancy.
Average Monthly Occupancy Rate Trend in Jefferson
Average Daily Rate (ADR) Airbnb Trends in Jefferson (2026)
Effective short term rental pricing strategy in Jefferson involves understanding monthly ADR fluctuations. The Average Daily Rate (ADR) for Airbnb in Jefferson typically peaks in November and dips lowest during April. Leveraging Airbnb dynamic pricing tools or strategies based on this seasonality can significantly boost revenue. Here's a look at the typical nightly rates achieved:
- Best-in-class properties (Top 10%) command rates of $272+ per night, often due to premium features or locations.
- Strong performing properties (Top 25%) achieve nightly rates of $193 or more.
- Typical properties (Median) charge around $159 per night.
- Entry-level properties (Bottom 25%) earn around $143 per night.
Average Daily Rate (ADR) Trend by Month in Jefferson
Get Live Jefferson Market Intelligence 👇

Explore Real-time Analytics
Airbnb Seasonality Analysis & Trends in Jefferson (2026)
Peak Season (November, July, October)
- Revenue averages $2,440 per month
- Occupancy rates average 39.9%
- Daily rates average $188
Shoulder Season
- Revenue averages $2,080 per month
- Occupancy maintains around 34.0%
- Daily rates hold near $184
Low Season (January, February, April)
- Revenue drops to average $1,578 per month
- Occupancy decreases to average 27.5%
- Daily rates adjust to average $178
Seasonality Insights for Jefferson
- The Airbnb seasonality in Jefferson shows moderate seasonality with distinct peak and low periods. While the sections above show seasonal averages, it's also insightful to look at the extremes:
- During the high season, the absolute peak month showcases Jefferson's highest earning potential, with monthly revenues capable of climbing to $2,532, occupancy reaching a high of 42.7%, and ADRs peaking at $191.
- Conversely, the slowest single month of the year, typically falling within the low season, marks the market's lowest point. In this month, revenue might dip to $1,412, occupancy could drop to 23.6%, and ADRs may adjust down to $173.
- Understanding both the seasonal averages and these monthly peaks and troughs in revenue, occupancy, and ADR is crucial for maximizing your Airbnb profit potential in Jefferson.
Seasonal Strategies for Maximizing Profit
- Peak Season: Maximize revenue through premium pricing and potentially longer minimum stays. Ensure high availability.
- Low Season: Offer competitive pricing, special promotions (e.g., extended stay discounts), and flexible cancellation policies. Target off-season travelers like remote workers or budget-conscious guests.
- Shoulder Seasons: Implement dynamic pricing that balances peak and low rates. Target weekend travelers or specific events. Offer slightly more flexible terms than peak season.
- Regularly analyze your own performance against these Jefferson seasonality benchmarks and adjust your pricing and availability strategy accordingly.
Best Areas for Airbnb Investment in Jefferson (2026)
Exploring the top neighborhoods for short-term rentals in Jefferson? This section highlights key areas, outlining why they are attractive for hosts and guests, along with notable local attractions. Consider these locations based on your target guest profile and investment strategy.
| Neighborhood / Area | Why Host Here? (Target Guests & Appeal) | Key Attractions & Landmarks |
|---|---|---|
| Historic Downtown Jefferson | Charming area rich in history and architecture, ideal for guests interested in heritage and southern hospitality. Proximity to antique shops, restaurants, and local events makes it attractive to tourists. | Jefferson Historical Museum, Caddo Lake State Park, Historic Jefferson Ghost Walk, Theatre on the Bayou, Big Cypress Bayou |
| Caddo Lake | Beautiful natural area attracting nature enthusiasts and those looking to escape into the outdoors. Perfect for visitors seeking fishing, boating, and wildlife watching experiences. | Caddo Lake State Park, Caddo Lake Fishing, Kayaking and canoeing, Wildlife observation, Caddo Lake National Wildlife Refuge |
| Lake O' the Pines | Scenic spot near a large reservoir, ideal for water activities and relaxation. Appeals to families and outdoor lovers, enhancing the potential for summer bookings. | Lake O' the Pines, Lakeside parks and picnicking, Fishing and boating, Campsites, Hiking trails |
| Jefferson Riverport | Historic riverport area perfect for guests interested in river tours and boating. Offers unique experiences on the water, appealing to adventurers and history buffs. | Jefferson Riverport, Riverboat tours, Historical exhibits, Fishing opportunities, Scenic views |
| Lakeside RV Parks | Popular for RV travelers looking for a friendly stopover. Benefits from accommodating families and individuals exploring East Texas while providing comfort and convenience. | RV camping facilities, Lakeside activities, Fishing, Community events, Picnic areas |
| Local Wineries and Vineyards | Emerging wine region attracting wine lovers and tourists looking for tastings and vineyard tours. A unique offering to enhance the Airbnb experience for guests. | Local wineries, Wine tastings, Vineyard tours, Grapevine trails, Wine festivals |
| Nearby Piney Woods | Enjoys proximity to the vast Piney Woods forest area, attracting nature lovers and outdoor adventurers. Great for hiking, bird watching, and exploring East Texas flora. | Hiking trails, Bird watching, Piney Woods scenic views, Camping, Nature exploration |
| Antique District | Home to a variety of antique shops and stores, appealing to collectors and history enthusiasts. Offers a charming atmosphere for guests seeking unique finds. | Antique shops, Local artisan stores, Historical tours, Cultural events, Flea markets |
Understanding Airbnb License Requirements & STR Laws in Jefferson (2026)
While Jefferson, Texas, United States currently shows low STR regulations, specific Airbnb license requirements might still exist or change. Always verify the latest short term rental regulations and Airbnb license requirements directly with local government authorities for Jefferson to ensure full compliance before hosting.
(Source: AirROI data, 2026, finding no licensed listings among those analyzed)
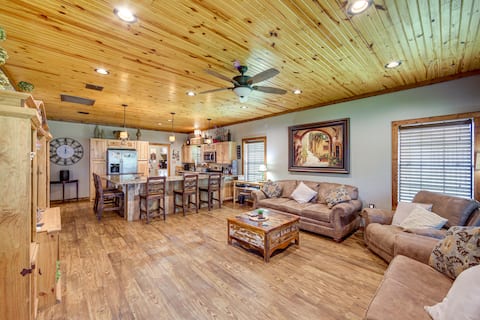
Top Performing Airbnb Properties in Jefferson (2026)
Benchmark your potential! Explore examples of top-performing Airbnb properties in Jeffersonbased on Trailing Twelve Month (TTM) revenue. Analyze their characteristics, revenue, occupancy rate, and ADR to understand what drives success in this market.

Paddlewhacks-Whole Camp - 5 Cabins & Bunkhouse
Entire Place • 6 bedrooms

Lake O' the Pines Retreat: Private Dock!
Entire Place • 4 bedrooms

Lakefront Cabin/Hot Tub, Scenic Views & EV Charger
Entire Place • 3 bedrooms
Jefferson Vacation Rental with Golf Cart!
Entire Place • 3 bedrooms

Beach Access | Watersports | Lakeside Firepit +
Entire Place • 4 bedrooms

Sunset Cove- Lake O' The Pines / Crystal Cove
Entire Place • 3 bedrooms
Note: Performance varies based on location, size, amenities, seasonality, and management quality. Data reflects the past 12 months.
Top Performing Airbnb Hosts in Jefferson (2026)
Learn from the best! This table showcases top-performing Airbnb hosts in Jefferson based on the number of properties managed and estimated total revenue over the past year. Analyze their scale and performance metrics.
| Host Name | Properties | Grossing Revenue | Stay Reviews | Avg Rating |
|---|---|---|---|---|
| Evolve | 9 | $259,253 | 199 | 4.87/5.0 |
| Jennifer | 6 | $173,361 | 226 | 4.96/5.0 |
| Brian | 10 | $111,593 | 42 | 4.98/5.0 |
| Tracey | 6 | $89,026 | 43 | 5.00/5.0 |
| Teresa | 3 | $79,135 | 472 | 4.88/5.0 |
| Jen | 1 | $64,870 | 95 | 4.92/5.0 |
| Zach And Taylor | 6 | $57,999 | 558 | 4.88/5.0 |
| Rick | 1 | $55,702 | 30 | 4.93/5.0 |
| Nicole | 3 | $55,548 | 68 | 5.00/5.0 |
| Candace | 1 | $55,279 | 106 | 4.97/5.0 |
Analyzing the strategies of top hosts, such as their property selection, pricing, and guest communication, can offer valuable lessons for optimizing your own Airbnb operations in Jefferson.
Dive Deeper: Advanced Jefferson STR Market Data (2026)
Ready to unlock more insights? AirROI provides access to advanced metrics and comprehensive Airbnb data for Jefferson. Explore detailed analytics beyond this report to refine your investment strategy, optimize pricing, and maximize your vacation rental profits.
Explore Advanced MetricsJefferson Short-Term Rental Market Composition (2026): Property & Room Types
Room Type Distribution
Property Type Distribution
Market Composition Insights for Jefferson
- The Jefferson Airbnb market composition is heavily skewed towards Entire Home/Apt listings, which make up 73.7% of the 99 active rentals. This indicates strong guest preference for privacy and space.
- Looking at the property type distribution in Jefferson, House properties are the most common (47.5%), reflecting the local real estate landscape.
- Houses represent a significant 47.5% portion, catering likely to families or larger groups.
- The presence of 28.3% Hotel/Boutique listings indicates integration with traditional hospitality.
- Smaller segments like apartment/condo, others, unique stays (combined 5.0%) offer potential for unique stay experiences.
Jefferson Airbnb Room Capacity Analysis (2026): Bedroom Distribution
Distribution of Listings by Number of Bedrooms
Room Capacity Insights for Jefferson
- The dominant room capacity in Jefferson is 2 bedrooms listings, making up 31.3% of the market. This suggests a strong demand for properties suitable for couples or solo travelers.
- Together, 2 bedrooms and 1 bedroom properties represent 49.5% of the active Airbnb listings in Jefferson, indicating a high concentration in these sizes.
- A significant 21.2% of listings offer 3+ bedrooms, catering to larger groups and families seeking more space in Jefferson.
Jefferson Vacation Rental Guest Capacity Trends (2026)
Distribution of Listings by Guest Capacity
Guest Capacity Insights for Jefferson
- The most common guest capacity trend in Jefferson vacation rentals is listings accommodating 4 guests (22.2%). This suggests the primary traveler segment is likely small families or groups.
- Properties designed for 4 guests and 6 guests dominate the Jefferson STR market, accounting for 37.4% of listings.
- 31.3% of properties accommodate 6+ guests, serving the market segment for larger families or group travel in Jefferson.
- On average, properties in Jefferson are equipped to host 3.7 guests.
Jefferson Airbnb Booking Patterns (2026): Available vs. Booked Days
Available Days Distribution
Booked Days Distribution
Booking Pattern Insights for Jefferson
- The most common availability pattern in Jefferson falls within the 271-366 days range, representing 50.5% of listings. This suggests many properties have significant open periods on their calendars.
- Approximately 85.9% of listings show high availability (181+ days open annually), indicating potential for increased bookings or specific owner usage patterns.
- For booked days, the 31-90 days range is most frequent in Jefferson (40.4%), reflecting common guest stay durations or potential owner blocking patterns.
- A notable 16.2% of properties secure long booking periods (181+ days booked per year), highlighting successful long-term rental strategies or significant owner usage.
Jefferson Airbnb Minimum Stay Requirements Analysis
Distribution of Listings by Minimum Night Requirement
1 Night
47 listings
47.5% of total
2 Nights
40 listings
40.4% of total
3 Nights
1 listings
1% of total
30+ Nights
11 listings
11.1% of total
Key Insights
- The most prevalent minimum stay requirement in Jefferson is 1 Night, adopted by 47.5% of listings. This highlights the market's preference for shorter, flexible bookings.
- A strong majority (87.9%) of the Jefferson Airbnb data shows acceptance of very short stays (1-2 nights), indicating a dynamic, high-turnover market.
- A significant segment (11.1%) caters to monthly stays (30+ nights) in Jefferson, pointing to opportunities in the extended-stay market.
Recommendations
- Align with the market by considering a 1 Night minimum stay, as 47.5% of Jefferson hosts use this setting.
- Explore offering discounts for stays of 30+ nights to attract the 11.1% of the market seeking extended stays.
- Adjust minimum nights based on seasonality – potentially shorter during low season and longer during peak demand periods in Jefferson.
Jefferson Airbnb Cancellation Policy Trends Analysis (2026)
Flexible
15 listings
15.2% of total
Moderate
25 listings
25.3% of total
Firm
47 listings
47.5% of total
Strict
12 listings
12.1% of total
Cancellation Policy Insights for Jefferson
- The prevailing Airbnb cancellation policy trend in Jefferson is Firm, used by 47.5% of listings.
- A majority (59.6%) of hosts in Jefferson utilize Firm or Strict policies, indicating a market where hosts prioritize booking security.
Recommendations for Hosts
- Consider adopting a Firm policy to align with the 47.5% market standard in Jefferson.
- Using a Strict policy might deter some guests, as only 12.1% of listings use it. Evaluate if potential revenue protection outweighs possible lower booking rates.
- Regularly review your cancellation policy against competitors and market demand shifts in Jefferson.
Jefferson STR Booking Lead Time Analysis (2026)
Average Booking Lead Time by Month
Booking Lead Time Insights for Jefferson
- The overall average booking lead time for vacation rentals in Jefferson is 61 days.
- Guests book furthest in advance for stays during October (average 94 days), likely coinciding with peak travel demand or local events.
- The shortest booking windows occur for stays in August (average 40 days), indicating more last-minute travel plans during this time.
- Seasonally, Fall (77 days avg.) sees the longest lead times, while Summer (43 days avg.) has the shortest, reflecting typical travel planning cycles.
Recommendations for Hosts
- Use the overall average lead time (61 days) as a baseline for your pricing and availability strategy in Jefferson.
- For October stays, consider implementing length-of-stay discounts or slightly higher rates for bookings made less than 94 days out to capitalize on advance planning.
- Target marketing efforts for the Fall season well in advance (at least 77 days) to capture early planners.
- Monitor your own booking lead times against these Jefferson averages to identify opportunities for dynamic pricing adjustments.
Popular & Essential Airbnb Amenities in Jefferson (2026)
Amenity Prevalence
Amenity Insights for Jefferson
- Essential amenities in Jefferson that guests expect include: Air conditioning, Smoke alarm, TV, Heating. Lacking these (any) could significantly impact bookings.
- Popular amenities like Wifi, Free parking on premises, Coffee maker are common but not universal. Offering these can provide a competitive edge.
- Warning: Wifi is not universally provided but is considered essential globally. Ensure reliable Wifi is offered.
Recommendations for Hosts
- Ensure your listing includes all essential amenities for Jefferson: Air conditioning, Smoke alarm, TV, Heating.
- Prioritize adding missing essentials: Smoke alarm, TV, Heating.
- Consider adding popular differentiators like Wifi or Free parking on premises to increase appeal.
- Highlight unique or less common amenities you offer (e.g., hot tub, dedicated workspace, EV charger) in your listing description and photos.
- Regularly check competitor amenities in Jefferson to stay competitive.
Jefferson Airbnb Guest Demographics & Profile Analysis (2026)
Guest Profile Summary for Jefferson
- The typical guest profile for Airbnb in Jefferson consists of primarily domestic travelers (98%), often arriving from nearby Dallas, typically belonging to the Post-2000s (Gen Z/Alpha) group (50%), primarily speaking English or Spanish.
- Domestic travelers account for 98.2% of guests.
- Key international markets include United States (98.2%) and United Kingdom (0.5%).
- Top languages spoken are English (84.5%) followed by Spanish (9.6%).
- A significant demographic segment is the Post-2000s (Gen Z/Alpha) group, representing 50% of guests.
Recommendations for Hosts
- Target domestic marketing efforts towards travelers from Dallas and Shreveport.
- Tailor amenities and listing descriptions to appeal to the dominant Post-2000s (Gen Z/Alpha) demographic (e.g., highlight fast WiFi, smart home features, local guides).
- Highlight unique local experiences or amenities relevant to the primary guest profile.
- Consider seasonal promotions aligned with peak travel times for key origin markets.
Nearby Short-Term Rental Market Comparison
How does the Jefferson Airbnb market stack up against its neighbors? Compare key performance metrics like average monthly revenue, ADR, and occupancy rates in surrounding areas to understand the broader regional STR landscape.
| Market | Active Properties | Monthly Revenue | Daily Rate | Avg. Occupancy |
|---|---|---|---|---|
| Holly Lake Ranch | 11 | $3,836 | $358.93 | 36% |
| Gladewater | 15 | $2,975 | $313.40 | 34% |
| Milam | 12 | $2,955 | $346.16 | 41% |
| Point | 12 | $2,822 | $225.27 | 40% |
| Pittsburg | 33 | $2,784 | $244.07 | 35% |
| Eustace | 25 | $2,621 | $404.69 | 36% |
| Bullard | 33 | $2,588 | $219.90 | 43% |
| Brookeland | 56 | $2,363 | $289.67 | 33% |
| Crockett | 21 | $2,342 | $312.88 | 32% |
| Berryville | 15 | $2,340 | $302.54 | 40% |