Montgomery Airbnb Market Analysis 2026: Short Term Rental Data & Vacation Rental Statistics in Texas, United States
Is Airbnb profitable in Montgomery in 2026? Explore comprehensive Airbnb analytics for Montgomery, Texas, United States to uncover income potential. This 2026 STR market report for Montgomery, based on AirROI data from February 2025 to January 2026, reveals key trends in the market of 275 active listings.
Whether you're considering an Airbnb investment in Montgomery, optimizing your existing vacation rental, or exploring rental arbitrage opportunities, understanding the Montgomery Airbnb data is crucial. Leveraging the low regulation environment is key to maximizing your short term rental income potential. Let's dive into the specifics.
Key Montgomery Airbnb Performance Metrics Overview
Monthly Airbnb Revenue Variations & Income Potential in Montgomery (2026)
Understanding the monthly revenue variations for Airbnb listings in Montgomery is key to maximizing your short term rental income potential. Seasonality significantly impacts earnings. Our analysis, based on data from the past 12 months, shows that the peak revenue month for STRs in Montgomery is typically July, while January often presents the lowest earnings, highlighting opportunities for strategic pricing adjustments during shoulder and low seasons. Explore the typical Airbnb income in Montgomery across different performance tiers:
- Best-in-class properties (Top 10%) achieve $6,391+ monthly, often utilizing dynamic pricing and superior guest experiences.
- Strong performing properties (Top 25%) earn $3,718 or more, indicating effective management and desirable locations/amenities.
- Typical properties (Median) generate around $2,008 per month, representing the average market performance.
- Entry-level properties (Bottom 25%) see earnings around $1,052, often with potential for optimization.
Average Monthly Airbnb Earnings Trend in Montgomery
Montgomery Airbnb Occupancy Rate Trends (2026)
Maximize your bookings by understanding the Montgomery STR occupancy trends. Seasonal demand shifts significantly influence how often properties are booked. Typically, Julysees the highest demand (peak season occupancy), while January experiences the lowest (low season). Effective strategies, like adjusting minimum stays or offering promotions, can boost occupancy during slower periods. Here's how different property tiers perform in Montgomery:
- Best-in-class properties (Top 10%) achieve 74%+ occupancy, indicating high desirability and potentially optimized availability.
- Strong performing properties (Top 25%) maintain 54% or higher occupancy, suggesting good market fit and guest satisfaction.
- Typical properties (Median) have an occupancy rate around 34%.
- Entry-level properties (Bottom 25%) average 18% occupancy, potentially facing higher vacancy.
Average Monthly Occupancy Rate Trend in Montgomery
Average Daily Rate (ADR) Airbnb Trends in Montgomery (2026)
Effective short term rental pricing strategy in Montgomery involves understanding monthly ADR fluctuations. The Average Daily Rate (ADR) for Airbnb in Montgomery typically peaks in November and dips lowest during February. Leveraging Airbnb dynamic pricing tools or strategies based on this seasonality can significantly boost revenue. Here's a look at the typical nightly rates achieved:
- Best-in-class properties (Top 10%) command rates of $565+ per night, often due to premium features or locations.
- Strong performing properties (Top 25%) achieve nightly rates of $282 or more.
- Typical properties (Median) charge around $170 per night.
- Entry-level properties (Bottom 25%) earn around $123 per night.
Average Daily Rate (ADR) Trend by Month in Montgomery
Get Live Montgomery Market Intelligence 👇

Explore Real-time Analytics
Airbnb Seasonality Analysis & Trends in Montgomery (2026)
Peak Season (July, June, August)
- Revenue averages $3,897 per month
- Occupancy rates average 42.7%
- Daily rates average $271
Shoulder Season
- Revenue averages $3,005 per month
- Occupancy maintains around 38.8%
- Daily rates hold near $272
Low Season (January, February, September)
- Revenue drops to average $2,155 per month
- Occupancy decreases to average 31.9%
- Daily rates adjust to average $268
Seasonality Insights for Montgomery
- The Airbnb seasonality in Montgomery shows highly seasonal trends requiring careful strategy. While the sections above show seasonal averages, it's also insightful to look at the extremes:
- During the high season, the absolute peak month showcases Montgomery's highest earning potential, with monthly revenues capable of climbing to $4,323, occupancy reaching a high of 46.7%, and ADRs peaking at $294.
- Conversely, the slowest single month of the year, typically falling within the low season, marks the market's lowest point. In this month, revenue might dip to $1,734, occupancy could drop to 25.3%, and ADRs may adjust down to $243.
- Understanding both the seasonal averages and these monthly peaks and troughs in revenue, occupancy, and ADR is crucial for maximizing your Airbnb profit potential in Montgomery.
Seasonal Strategies for Maximizing Profit
- Peak Season: Maximize revenue through premium pricing and potentially longer minimum stays. Ensure high availability.
- Low Season: Offer competitive pricing, special promotions (e.g., extended stay discounts), and flexible cancellation policies. Target off-season travelers like remote workers or budget-conscious guests.
- Shoulder Seasons: Implement dynamic pricing that balances peak and low rates. Target weekend travelers or specific events. Offer slightly more flexible terms than peak season.
- Regularly analyze your own performance against these Montgomery seasonality benchmarks and adjust your pricing and availability strategy accordingly.
Best Areas for Airbnb Investment in Montgomery (2026)
Exploring the top neighborhoods for short-term rentals in Montgomery? This section highlights key areas, outlining why they are attractive for hosts and guests, along with notable local attractions. Consider these locations based on your target guest profile and investment strategy.
| Neighborhood / Area | Why Host Here? (Target Guests & Appeal) | Key Attractions & Landmarks |
|---|---|---|
| Lake Conroe | Popular destination for outdoor enthusiasts and families looking for waterfront activities. Offers boating, fishing, and swimming, making it ideal for vacation rentals. | Lake Conroe, Billy's on the Lake, Nora's Garden, Cedar Landing, Conroe Outlet Mall |
| Montgomery Historic District | Charming small-town atmosphere with historical homes and local shops. Attracts visitors looking for a quaint getaway with local flavor and history. | Montgomery County Courthouse, The Historic Montgomery Post Office, Julius P. Smith House, Local boutiques and cafes |
| Nolan Creek | Scenic area known for its nature trails and parks. Great for visitors who enjoy hiking, picnics, and outdoor activities. | Nolan Creek Park, Walker County Historical Museum, Nature trails, Fishing spots |
| The Woodlands | Affluent community with a vibrant arts scene and extensive shopping and dining options. Very popular among both tourists and business travelers. | The Woodlands Mall, Waterscape Park, Cynthia Woods Mitchell Pavilion, The Market Street, Woodlands Waterway |
| Montgomery Marina | Ideal for those looking to enjoy boating and water sports. A good spot for vacationers seeking adventure and relaxation by the water. | Montgomery Marina, Fishing opportunities, Boat rentals, Shady Lakes |
| Princeton | A serene area with lots of green space, ideal for families and travelers looking to escape the noise of the city. Close proximity to major attractions. | Princeton Park, Buffalo Bayou Park, Local farms and markets |
| Conroe City Center | The central hub of Conroe, offering easy access to dining, shopping, and cultural events. Ideal for short-term stays for business travelers. | Conroe City Hall, Conroe Art League, Local restaurants, Historic sites |
| Hwy 105 Scenic Drive | A picturesque route that attracts those wanting to explore the beauty of Texas Hill Country. Perfect for tourists seeking scenic views and leisure. | Scenic road views, Local wineries, Parks and picnic areas |
Understanding Airbnb License Requirements & STR Laws in Montgomery (2026)
While Montgomery, Texas, United States currently shows low STR regulations, specific Airbnb license requirements might still exist or change. Always verify the latest short term rental regulations and Airbnb license requirements directly with local government authorities for Montgomery to ensure full compliance before hosting.
(Source: AirROI data, 2026, finding no licensed listings among those analyzed)
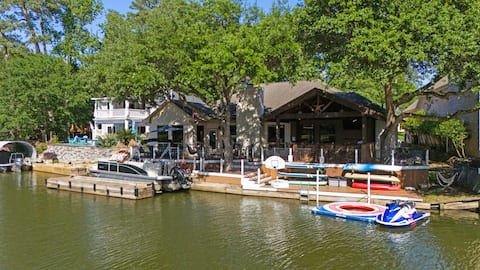
Top Performing Airbnb Properties in Montgomery (2026)
Benchmark your potential! Explore examples of top-performing Airbnb properties in Montgomerybased on Trailing Twelve Month (TTM) revenue. Analyze their characteristics, revenue, occupancy rate, and ADR to understand what drives success in this market.

The Waterfront Villa
Entire Place • 5 bedrooms

Lakefront Sunsets - Pool & Spa at Happy Place
Entire Place • 4 bedrooms
Spacious 5-bedroom waterfront lake house with pool
Entire Place • 5 bedrooms
Relaxing Family Lake House, Fish, BBQ, Rent a Boat
Entire Place • 4 bedrooms

Dock & Outdoor Entertainment: Home on Lake Conroe
Entire Place • 4 bedrooms

Ultimate Lake Resort Xtravaganza | Private Dock
Entire Place • 5 bedrooms
Note: Performance varies based on location, size, amenities, seasonality, and management quality. Data reflects the past 12 months.
Top Performing Airbnb Hosts in Montgomery (2026)
Learn from the best! This table showcases top-performing Airbnb hosts in Montgomery based on the number of properties managed and estimated total revenue over the past year. Analyze their scale and performance metrics.
| Host Name | Properties | Grossing Revenue | Stay Reviews | Avg Rating |
|---|---|---|---|---|
| Evolve | 20 | $595,670 | 306 | 4.70/5.0 |
| Rachel | 3 | $460,607 | 277 | 4.96/5.0 |
| Juan | 5 | $321,192 | 571 | 4.95/5.0 |
| Michael | 14 | $296,409 | 145 | 4.81/5.0 |
| Nick | 4 | $234,272 | 179 | 4.91/5.0 |
| Richard | 1 | $212,537 | 158 | 4.91/5.0 |
| Amy Rogers | 5 | $184,830 | 46 | 4.74/5.0 |
| Ed & Val | 1 | $144,628 | 89 | 4.81/5.0 |
| Christian | 1 | $132,440 | 42 | 5.00/5.0 |
| VacayLux | 7 | $129,356 | 533 | 4.86/5.0 |
Analyzing the strategies of top hosts, such as their property selection, pricing, and guest communication, can offer valuable lessons for optimizing your own Airbnb operations in Montgomery.
Dive Deeper: Advanced Montgomery STR Market Data (2026)
Ready to unlock more insights? AirROI provides access to advanced metrics and comprehensive Airbnb data for Montgomery. Explore detailed analytics beyond this report to refine your investment strategy, optimize pricing, and maximize your vacation rental profits.
Explore Advanced MetricsMontgomery Short-Term Rental Market Composition (2026): Property & Room Types
Room Type Distribution
Property Type Distribution
Market Composition Insights for Montgomery
- The Montgomery Airbnb market composition is heavily skewed towards Entire Home/Apt listings, which make up 97.1% of the 275 active rentals. This indicates strong guest preference for privacy and space.
- Looking at the property type distribution in Montgomery, House properties are the most common (50.9%), reflecting the local real estate landscape.
- Houses represent a significant 50.9% portion, catering likely to families or larger groups.
- Smaller segments like outdoor/unique, others, hotel/boutique, unique stays (combined 10.2%) offer potential for unique stay experiences.
Montgomery Airbnb Room Capacity Analysis (2026): Bedroom Distribution
Distribution of Listings by Number of Bedrooms
Room Capacity Insights for Montgomery
- The dominant room capacity in Montgomery is 2 bedrooms listings, making up 27.6% of the market. This suggests a strong demand for properties suitable for couples or solo travelers.
- Together, 2 bedrooms and 1 bedroom properties represent 52.0% of the active Airbnb listings in Montgomery, indicating a high concentration in these sizes.
- A significant 44.4% of listings offer 3+ bedrooms, catering to larger groups and families seeking more space in Montgomery.
Montgomery Vacation Rental Guest Capacity Trends (2026)
Distribution of Listings by Guest Capacity
Guest Capacity Insights for Montgomery
- The most common guest capacity trend in Montgomery vacation rentals is listings accommodating 8+ guests (40.7%). This suggests the primary traveler segment is likely larger groups.
- Properties designed for 8+ guests and 4 guests dominate the Montgomery STR market, accounting for 61.1% of listings.
- 61.8% of properties accommodate 6+ guests, serving the market segment for larger families or group travel in Montgomery.
- On average, properties in Montgomery are equipped to host 5.9 guests.
Montgomery Airbnb Booking Patterns (2026): Available vs. Booked Days
Available Days Distribution
Booked Days Distribution
Booking Pattern Insights for Montgomery
- The most common availability pattern in Montgomery falls within the 271-366 days range, representing 51.3% of listings. This suggests many properties have significant open periods on their calendars.
- Approximately 85.8% of listings show high availability (181+ days open annually), indicating potential for increased bookings or specific owner usage patterns.
- For booked days, the 91-180 days range is most frequent in Montgomery (37.1%), reflecting common guest stay durations or potential owner blocking patterns.
- A notable 15.3% of properties secure long booking periods (181+ days booked per year), highlighting successful long-term rental strategies or significant owner usage.
Montgomery Airbnb Minimum Stay Requirements Analysis
Distribution of Listings by Minimum Night Requirement
1 Night
63 listings
22.9% of total
2 Nights
139 listings
50.5% of total
3 Nights
7 listings
2.5% of total
4-6 Nights
8 listings
2.9% of total
7-29 Nights
9 listings
3.3% of total
30+ Nights
49 listings
17.8% of total
Key Insights
- The most prevalent minimum stay requirement in Montgomery is 2 Nights, adopted by 50.5% of listings. This highlights the market's preference for shorter, flexible bookings.
- A strong majority (73.4%) of the Montgomery Airbnb data shows acceptance of very short stays (1-2 nights), indicating a dynamic, high-turnover market.
- A significant segment (17.8%) caters to monthly stays (30+ nights) in Montgomery, pointing to opportunities in the extended-stay market.
Recommendations
- Align with the market by considering a 2 Nights minimum stay, as 50.5% of Montgomery hosts use this setting.
- If feasible, allowing 1-night stays, especially midweek or during low season, could capture last-minute bookings, as only 22.9% currently do.
- Explore offering discounts for stays of 30+ nights to attract the 17.8% of the market seeking extended stays.
- Adjust minimum nights based on seasonality – potentially shorter during low season and longer during peak demand periods in Montgomery.
Montgomery Airbnb Cancellation Policy Trends Analysis (2026)
Super Strict 30 Days
1 listings
0.4% of total
Limited
8 listings
2.9% of total
Flexible
46 listings
16.8% of total
Moderate
90 listings
32.8% of total
Firm
82 listings
29.9% of total
Strict
47 listings
17.2% of total
Cancellation Policy Insights for Montgomery
- The prevailing Airbnb cancellation policy trend in Montgomery is Moderate, used by 32.8% of listings.
- There's a relatively balanced mix between guest-friendly (49.6%) and stricter (47.1%) policies, offering choices for different guest needs.
Recommendations for Hosts
- Consider adopting a Moderate policy to align with the 32.8% market standard in Montgomery.
- Regularly review your cancellation policy against competitors and market demand shifts in Montgomery.
Montgomery STR Booking Lead Time Analysis (2026)
Average Booking Lead Time by Month
Booking Lead Time Insights for Montgomery
- The overall average booking lead time for vacation rentals in Montgomery is 39 days.
- Guests book furthest in advance for stays during November (average 49 days), likely coinciding with peak travel demand or local events.
- The shortest booking windows occur for stays in March (average 26 days), indicating more last-minute travel plans during this time.
- Seasonally, Fall (40 days avg.) sees the longest lead times, while Spring (33 days avg.) has the shortest, reflecting typical travel planning cycles.
Recommendations for Hosts
- Use the overall average lead time (39 days) as a baseline for your pricing and availability strategy in Montgomery.
- Target marketing efforts for the Fall season well in advance (at least 40 days) to capture early planners.
- Monitor your own booking lead times against these Montgomery averages to identify opportunities for dynamic pricing adjustments.
Popular & Essential Airbnb Amenities in Montgomery (2026)
Amenity Prevalence
Amenity Insights for Montgomery
- Essential amenities in Montgomery that guests expect include: Wifi, Free parking on premises, Air conditioning, TV, Smoke alarm. Lacking these (any) could significantly impact bookings.
- Popular amenities like Kitchen, Heating, Coffee maker are common but not universal. Offering these can provide a competitive edge.
Recommendations for Hosts
- Ensure your listing includes all essential amenities for Montgomery: Wifi, Free parking on premises, Air conditioning, TV, Smoke alarm.
- Prioritize adding missing essentials: Wifi, Free parking on premises, Air conditioning, TV, Smoke alarm.
- Consider adding popular differentiators like Kitchen or Heating to increase appeal.
- Highlight unique or less common amenities you offer (e.g., hot tub, dedicated workspace, EV charger) in your listing description and photos.
- Regularly check competitor amenities in Montgomery to stay competitive.
Montgomery Airbnb Guest Demographics & Profile Analysis (2026)
Guest Profile Summary for Montgomery
- The typical guest profile for Airbnb in Montgomery consists of primarily domestic travelers (96%), often arriving from nearby Houston, typically belonging to the Post-2000s (Gen Z/Alpha) group (50%), primarily speaking English or Spanish.
- Domestic travelers account for 96.4% of guests.
- Key international markets include United States (96.4%) and Mexico (1.3%).
- Top languages spoken are English (69.5%) followed by Spanish (18.5%).
- A significant demographic segment is the Post-2000s (Gen Z/Alpha) group, representing 50% of guests.
Recommendations for Hosts
- Target domestic marketing efforts towards travelers from Houston and Austin.
- Tailor amenities and listing descriptions to appeal to the dominant Post-2000s (Gen Z/Alpha) demographic (e.g., highlight fast WiFi, smart home features, local guides).
- Highlight unique local experiences or amenities relevant to the primary guest profile.
- Consider seasonal promotions aligned with peak travel times for key origin markets.
Nearby Short-Term Rental Market Comparison
How does the Montgomery Airbnb market stack up against its neighbors? Compare key performance metrics like average monthly revenue, ADR, and occupancy rates in surrounding areas to understand the broader regional STR landscape.
| Market | Active Properties | Monthly Revenue | Daily Rate | Avg. Occupancy |
|---|---|---|---|---|
| Fairfield | 10 | $4,761 | $360.96 | 42% |
| Jamaica Beach | 199 | $3,774 | $394.20 | 37% |
| Crystal Beach | 143 | $3,768 | $408.48 | 35% |
| Bolivar Peninsula | 913 | $3,311 | $396.49 | 34% |
| Columbus | 17 | $3,218 | $413.88 | 29% |
| Deer Park | 14 | $3,208 | $228.63 | 51% |
| Schulenburg | 25 | $3,157 | $349.06 | 31% |
| Chappell Hill | 11 | $2,947 | $509.72 | 31% |
| Streetman | 20 | $2,898 | $336.71 | 32% |
| Seabrook | 54 | $2,872 | $263.19 | 39% |