Robinson Airbnb Market Analysis 2025: Short Term Rental Data & Vacation Rental Statistics in Texas, United States
Is Airbnb profitable in Robinson in 2025? Explore comprehensive Airbnb analytics for Robinson, Texas, United States to uncover income potential. This 2025 STR market report for Robinson, based on AirROI data from May 2024 to April 2025, reveals key trends in the niche market of 17 active listings.
Whether you're considering an Airbnb investment in Robinson, optimizing your existing vacation rental, or exploring rental arbitrage opportunities, understanding the Robinson Airbnb data is crucial. Leveraging the low regulation environment is key to maximizing your short term rental income potential. Let's dive into the specifics.
Key Robinson Airbnb Performance Metrics Overview
Monthly Airbnb Revenue Variations & Income Potential in Robinson (2025)
Understanding the monthly revenue variations for Airbnb listings in Robinson is key to maximizing your short term rental income potential. Seasonality significantly impacts earnings. Our analysis, based on data from the past 12 months, shows that the peak revenue month for STRs in Robinson is typically August, while April often presents the lowest earnings, highlighting opportunities for strategic pricing adjustments during shoulder and low seasons. Explore the typical Airbnb income in Robinson across different performance tiers:
- Best-in-class properties (Top 10%) achieve $5,946+ monthly, often utilizing dynamic pricing and superior guest experiences.
- Strong performing properties (Top 25%) earn $4,013 or more, indicating effective management and desirable locations/amenities.
- Typical properties (Median) generate around $2,217 per month, representing the average market performance.
- Entry-level properties (Bottom 25%) see earnings around $1,123, often with potential for optimization.
Average Monthly Airbnb Earnings Trend in Robinson
Robinson Airbnb Occupancy Rate Trends (2025)
Maximize your bookings by understanding the Robinson STR occupancy trends. Seasonal demand shifts significantly influence how often properties are booked. Typically, Augustsees the highest demand (peak season occupancy), while April experiences the lowest (low season). Effective strategies, like adjusting minimum stays or offering promotions, can boost occupancy during slower periods. Here's how different property tiers perform in Robinson:
- Best-in-class properties (Top 10%) achieve 75%+ occupancy, indicating high desirability and potentially optimized availability.
- Strong performing properties (Top 25%) maintain 61% or higher occupancy, suggesting good market fit and guest satisfaction.
- Typical properties (Median) have an occupancy rate around 41%.
- Entry-level properties (Bottom 25%) average 24% occupancy, potentially facing higher vacancy.
Average Monthly Occupancy Rate Trend in Robinson
Average Daily Rate (ADR) Airbnb Trends in Robinson (2025)
Effective short term rental pricing strategy in Robinson involves understanding monthly ADR fluctuations. The Average Daily Rate (ADR) for Airbnb in Robinson typically peaks in December and dips lowest during September. Leveraging Airbnb dynamic pricing tools or strategies based on this seasonality can significantly boost revenue. Here's a look at the typical nightly rates achieved:
- Best-in-class properties (Top 10%) command rates of $428+ per night, often due to premium features or locations.
- Strong performing properties (Top 25%) achieve nightly rates of $263 or more.
- Typical properties (Median) charge around $169 per night.
- Entry-level properties (Bottom 25%) earn around $117 per night.
Average Daily Rate (ADR) Trend by Month in Robinson
Get Live Robinson Market Intelligence 👇

Explore Real-time Analytics
Airbnb Seasonality Analysis & Trends in Robinson (2025)
Peak Season (August, February, October)
- Revenue averages $3,929 per month
- Occupancy rates average 52.0%
- Daily rates average $209
Shoulder Season
- Revenue averages $2,996 per month
- Occupancy maintains around 44.6%
- Daily rates hold near $210
Low Season (April, May, June)
- Revenue drops to average $1,878 per month
- Occupancy decreases to average 36.7%
- Daily rates adjust to average $211
Seasonality Insights for Robinson
- The Airbnb seasonality in Robinson shows highly seasonal trends requiring careful strategy. While the sections above show seasonal averages, it's also insightful to look at the extremes:
- During the high season, the absolute peak month showcases Robinson's highest earning potential, with monthly revenues capable of climbing to $4,767, occupancy reaching a high of 56.3%, and ADRs peaking at $218.
- Conversely, the slowest single month of the year, typically falling within the low season, marks the market's lowest point. In this month, revenue might dip to $1,240, occupancy could drop to 27.0%, and ADRs may adjust down to $201.
- Understanding both the seasonal averages and these monthly peaks and troughs in revenue, occupancy, and ADR is crucial for maximizing your Airbnb profit potential in Robinson.
Seasonal Strategies for Maximizing Profit
- Peak Season: Maximize revenue through premium pricing and potentially longer minimum stays. Ensure high availability.
- Low Season: Offer competitive pricing, special promotions (e.g., extended stay discounts), and flexible cancellation policies. Target off-season travelers like remote workers or budget-conscious guests.
- Shoulder Seasons: Implement dynamic pricing that balances peak and low rates. Target weekend travelers or specific events. Offer slightly more flexible terms than peak season.
- Regularly analyze your own performance against these Robinson seasonality benchmarks and adjust your pricing and availability strategy accordingly.
Best Areas for Airbnb Investment in Robinson (2025)
Exploring the top neighborhoods for short-term rentals in Robinson? This section highlights key areas, outlining why they are attractive for hosts and guests, along with notable local attractions. Consider these locations based on your target guest profile and investment strategy.
| Neighborhood / Area | Why Host Here? (Target Guests & Appeal) | Key Attractions & Landmarks |
|---|---|---|
| Robinson Park | A peaceful residential area that attracts families and visitors looking for a quiet getaway. Close to parks and local amenities, ideal for those seeking a suburban experience. | Robinson Park, local dining options, community events, outdoor recreation areas, family-friendly attractions |
| Downtown Robinson | The heart of Robinson, offering local shops and eateries. It's becoming a popular spot for tourists wanting to experience local culture and community events. | Historic downtown buildings, local cafes, art galleries, community festivals, Robinson Historical Society |
| Lake Waco | A prime location for outdoor enthusiasts and water activities. It appeals to visitors looking for a lakefront experience with plenty of recreational options. | Lake Waco, water sports, fishing, picnic areas, hiking trails |
| Cedar Ridge | A scenic area with beautiful views and hiking opportunities. It attracts nature lovers and those looking to escape the city for a bit of tranquility. | Cedar Ridge Park, nature trails, scenic viewpoints, bird watching, camping areas |
| Lakeside Estate | A serene neighborhood situated near the lake, attracting those who wish to relax by the water or enjoy outdoor activities. | waterfront access, fishing, boat ramps, picnic spots, natural beauty |
| Robincrest Estates | An upscale residential area known for its spacious homes and proximity to local amenities. It attracts families and tourists looking for comfortable accommodations. | spacious parks, community amenities, nearby schools, shopping centers, family-friendly events |
| Robinson Drive | A convenient area with easy access to major transport routes, making it a great spot for business travelers and those visiting nearby attractions. | local restaurants, shopping options, business services, transport connections, proximity to Waco |
| Brazos Riverfront | A picturesque area along the river that attracts visitors during the summer months for festivals and outdoor activities. Ideal for those looking to enjoy scenic views and events. | Brazos River, annual festivals, walking trails, riverfront parks, water activities |
Understanding Airbnb License Requirements & STR Laws in Robinson (2025)
While Robinson, Texas, United States currently shows low STR regulations, specific Airbnb license requirements might still exist or change. Always verify the latest short term rental regulations and Airbnb license requirements directly with local government authorities for Robinson to ensure full compliance before hosting.
(Source: AirROI data, 2025, finding no licensed listings among those analyzed)
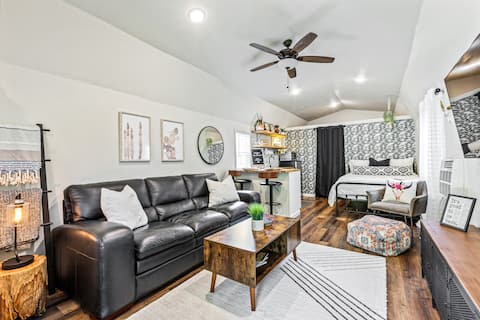
Top Performing Airbnb Properties in Robinson (2025)
Benchmark your potential! Explore examples of top-performing Airbnb properties in Robinsonbased on Trailing Twelve Month (TTM) revenue. Analyze their characteristics, revenue, occupancy rate, and ADR to understand what drives success in this market.
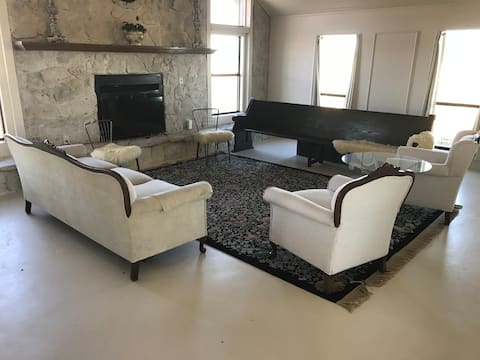
8 miles from Baylor, Countryside estate near Waco
Entire Place • 4 bedrooms

1940's Shiplap Charmer Close to Downtown Waco
Entire Place • 4 bedrooms
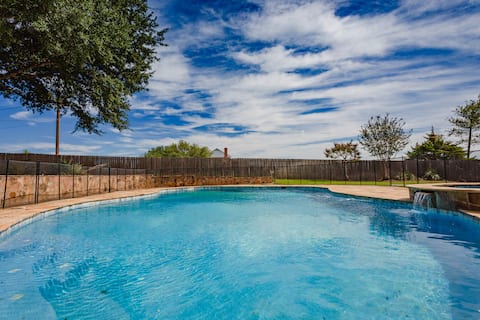
Moonlight Manor | Pool & Hot Tub
Entire Place • 5 bedrooms
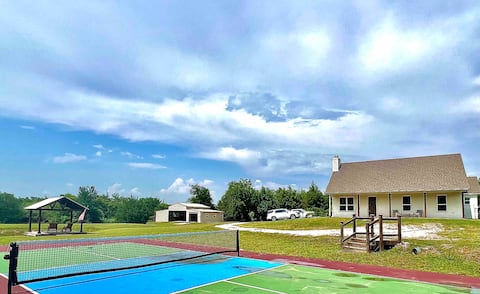
Baylor 11 miles 3 BR Home + Loft Pickleball Court
Entire Place • 3 bedrooms
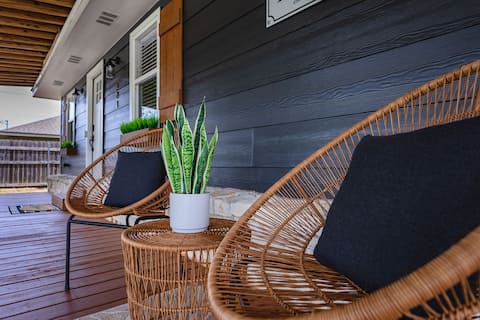
The Porch, 4 mi to BU/Silos!
Entire Place • 3 bedrooms
Cute & Cozy Tiny House Minutes to Downtown Waco!
Entire Place • N/A
Note: Performance varies based on location, size, amenities, seasonality, and management quality. Data reflects the past 12 months.
Top Performing Airbnb Hosts in Robinson (2025)
Learn from the best! This table showcases top-performing Airbnb hosts in Robinson based on the number of properties managed and estimated total revenue over the past year. Analyze their scale and performance metrics.
| Host Name | Properties | Grossing Revenue | Stay Reviews | Avg Rating |
|---|---|---|---|---|
| D&L Vacation | 3 | $93,382 | 64 | 5.00/5.0 |
| Meryl | 2 | $84,904 | 312 | 4.99/5.0 |
| Shannon Benson | 1 | $58,062 | 4 | 5.00/5.0 |
| Jen | 1 | $53,262 | 47 | 4.98/5.0 |
| Lindsey | 1 | $26,935 | 6 | 5.00/5.0 |
| Chloe | 1 | $26,356 | 22 | 5.00/5.0 |
| Veronica | 1 | $20,917 | 23 | 4.91/5.0 |
| Aaron/Gloria | 1 | $15,655 | 253 | 4.91/5.0 |
| Jimmy And Andra | 1 | $12,371 | 80 | 4.96/5.0 |
| Alexandrea | 1 | $11,110 | 115 | 4.76/5.0 |
Analyzing the strategies of top hosts, such as their property selection, pricing, and guest communication, can offer valuable lessons for optimizing your own Airbnb operations in Robinson.
Dive Deeper: Advanced Robinson STR Market Data (2025)
Ready to unlock more insights? AirROI provides access to advanced metrics and comprehensive Airbnb data for Robinson. Explore detailed analytics beyond this report to refine your investment strategy, optimize pricing, and maximize your vacation rental profits.
Explore Advanced MetricsRobinson Short-Term Rental Market Composition (2025): Property & Room Types
Room Type Distribution
Property Type Distribution
Market Composition Insights for Robinson
- The Robinson Airbnb market composition is heavily skewed towards Entire Home/Apt listings, which make up 100% of the 17 active rentals. This indicates strong guest preference for privacy and space.
- Looking at the property type distribution in Robinson, House properties are the most common (64.7%), reflecting the local real estate landscape.
- Houses represent a significant 64.7% portion, catering likely to families or larger groups.
- The presence of 11.8% Hotel/Boutique listings indicates integration with traditional hospitality.
Robinson Airbnb Room Capacity Analysis (2025): Bedroom Distribution
Distribution of Listings by Number of Bedrooms
Room Capacity Insights for Robinson
- The dominant room capacity in Robinson is 2 bedrooms listings, making up 35.3% of the market. This suggests a strong demand for properties suitable for couples or solo travelers.
- Together, 2 bedrooms and 3 bedrooms properties represent 64.7% of the active Airbnb listings in Robinson, indicating a high concentration in these sizes.
- A significant 47.1% of listings offer 3+ bedrooms, catering to larger groups and families seeking more space in Robinson.
Robinson Vacation Rental Guest Capacity Trends (2025)
Distribution of Listings by Guest Capacity
Guest Capacity Insights for Robinson
- The most common guest capacity trend in Robinson vacation rentals is listings accommodating 8+ guests (29.4%). This suggests the primary traveler segment is likely larger groups.
- Properties designed for 8+ guests and 7 guests dominate the Robinson STR market, accounting for 52.9% of listings.
- 58.8% of properties accommodate 6+ guests, serving the market segment for larger families or group travel in Robinson.
- On average, properties in Robinson are equipped to host 5.8 guests.
Robinson Airbnb Booking Patterns (2025): Available vs. Booked Days
Available Days Distribution
Booked Days Distribution
Booking Pattern Insights for Robinson
- The most common availability pattern in Robinson falls within the 181-270 days range, representing 52.9% of listings. This suggests many properties have significant open periods on their calendars.
- Approximately 82.3% of listings show high availability (181+ days open annually), indicating potential for increased bookings or specific owner usage patterns.
- For booked days, the 91-180 days range is most frequent in Robinson (52.9%), reflecting common guest stay durations or potential owner blocking patterns.
- A notable 17.6% of properties secure long booking periods (181+ days booked per year), highlighting successful long-term rental strategies or significant owner usage.
Robinson Airbnb Minimum Stay Requirements Analysis
Distribution of Listings by Minimum Night Requirement
1 Night
6 listings
35.3% of total
2 Nights
10 listings
58.8% of total
30+ Nights
1 listings
5.9% of total
Key Insights
- The most prevalent minimum stay requirement in Robinson is 2 Nights, adopted by 58.8% of listings. This highlights the market's preference for shorter, flexible bookings.
- A strong majority (94.1%) of the Robinson Airbnb data shows acceptance of very short stays (1-2 nights), indicating a dynamic, high-turnover market.
Recommendations
- Align with the market by considering a 2 Nights minimum stay, as 58.8% of Robinson hosts use this setting.
- Explore offering discounts for stays of 30+ nights to attract the 5.9% of the market seeking extended stays.
- Adjust minimum nights based on seasonality – potentially shorter during low season and longer during peak demand periods in Robinson.
Robinson Airbnb Cancellation Policy Trends Analysis (2025)
Flexible
3 listings
18.8% of total
Moderate
8 listings
50% of total
Firm
4 listings
25% of total
Strict
1 listings
6.3% of total
Cancellation Policy Insights for Robinson
- The prevailing Airbnb cancellation policy trend in Robinson is Moderate, used by 50% of listings.
- There's a relatively balanced mix between guest-friendly (68.8%) and stricter (31.3%) policies, offering choices for different guest needs.
- Strict cancellation policies are quite rare (6.3%), potentially making listings with this policy less competitive unless justified by high demand or property type.
Recommendations for Hosts
- Consider adopting a Moderate policy to align with the 50% market standard in Robinson.
- Using a Strict policy might deter some guests, as only 6.3% of listings use it. Evaluate if potential revenue protection outweighs possible lower booking rates.
- Regularly review your cancellation policy against competitors and market demand shifts in Robinson.
Robinson STR Booking Lead Time Analysis (2025)
Average Booking Lead Time by Month
Booking Lead Time Insights for Robinson
- The overall average booking lead time for vacation rentals in Robinson is 26 days.
- Guests book furthest in advance for stays during May (average 47 days), likely coinciding with peak travel demand or local events.
- The shortest booking windows occur for stays in July (average 12 days), indicating more last-minute travel plans during this time.
- Seasonally, Fall (36 days avg.) sees the longest lead times, while Summer (16 days avg.) has the shortest, reflecting typical travel planning cycles.
Recommendations for Hosts
- Use the overall average lead time (26 days) as a baseline for your pricing and availability strategy in Robinson.
- For May stays, consider implementing length-of-stay discounts or slightly higher rates for bookings made less than 47 days out to capitalize on advance planning.
- During July, focus on last-minute booking availability and promotions, as guests book with very short notice (12 days avg.).
- Target marketing efforts for the Fall season well in advance (at least 36 days) to capture early planners.
- Monitor your own booking lead times against these Robinson averages to identify opportunities for dynamic pricing adjustments.
Popular & Essential Airbnb Amenities in Robinson (2025)
Amenity Prevalence
Amenity Insights for Robinson
- Essential amenities in Robinson that guests expect include: Hot water, TV, Smoke alarm, Coffee maker, Air conditioning, Free parking on premises, Heating. Lacking these (any) could significantly impact bookings.
- Popular amenities like Microwave, Refrigerator, Wifi are common but not universal. Offering these can provide a competitive edge.
- Warning: Wifi is not universally provided but is considered essential globally. Ensure reliable Wifi is offered.
Recommendations for Hosts
- Ensure your listing includes all essential amenities for Robinson: Hot water, TV, Smoke alarm, Coffee maker, Air conditioning, Free parking on premises, Heating.
- Consider adding popular differentiators like Microwave or Refrigerator to increase appeal.
- Highlight unique or less common amenities you offer (e.g., hot tub, dedicated workspace, EV charger) in your listing description and photos.
- Regularly check competitor amenities in Robinson to stay competitive.
Robinson Airbnb Guest Demographics & Profile Analysis (2025)
Guest Profile Summary for Robinson
- The typical guest profile for Airbnb in Robinson consists of primarily domestic travelers (99%), often arriving from nearby Houston, typically belonging to the Post-2000s (Gen Z/Alpha) group (50%), primarily speaking English or Spanish.
- Domestic travelers account for 98.6% of guests.
- Key international markets include United States (98.6%) and Canada (0.7%).
- Top languages spoken are English (79.3%) followed by Spanish (11%).
- A significant demographic segment is the Post-2000s (Gen Z/Alpha) group, representing 50% of guests.
Recommendations for Hosts
- Target domestic marketing efforts towards travelers from Houston and Austin.
- Tailor amenities and listing descriptions to appeal to the dominant Post-2000s (Gen Z/Alpha) demographic (e.g., highlight fast WiFi, smart home features, local guides).
- Highlight unique local experiences or amenities relevant to the primary guest profile.
- Consider seasonal promotions aligned with peak travel times for key origin markets.
Nearby Short-Term Rental Market Comparison
How does the Robinson Airbnb market stack up against its neighbors? Compare key performance metrics like average monthly revenue, ADR, and occupancy rates in surrounding areas to understand the broader regional STR landscape.
| Market | Active Properties | Monthly Revenue | Daily Rate | Avg. Occupancy |
|---|---|---|---|---|
| Star Harbor | 13 | $5,789 | $655.40 | 37% |
| Jonestown | 56 | $5,144 | $506.61 | 31% |
| West Lake Hills | 18 | $4,837 | $715.93 | 34% |
| Strawn | 19 | $4,530 | $647.22 | 29% |
| Hudson Bend | 61 | $4,447 | $515.87 | 31% |
| Groesbeck | 10 | $4,122 | $379.44 | 37% |
| Volente | 19 | $3,633 | $417.14 | 33% |
| Round Mountain | 14 | $3,520 | $603.14 | 33% |
| Rowlett | 75 | $3,370 | $321.99 | 44% |
| Dripping Springs | 401 | $3,312 | $368.04 | 34% |