San Benito Airbnb Market Analysis 2026: Short Term Rental Data & Vacation Rental Statistics in Texas, United States
Is Airbnb profitable in San Benito in 2026? Explore comprehensive Airbnb analytics for San Benito, Texas, United States to uncover income potential. This 2026 STR market report for San Benito, based on AirROI data from February 2025 to January 2026, reveals key trends in the niche market of 19 active listings.
Whether you're considering an Airbnb investment in San Benito, optimizing your existing vacation rental, or exploring rental arbitrage opportunities, understanding the San Benito Airbnb data is crucial. Leveraging the low regulation environment is key to maximizing your short term rental income potential. Let's dive into the specifics.
Key San Benito Airbnb Performance Metrics Overview
Monthly Airbnb Revenue Variations & Income Potential in San Benito (2026)
Understanding the monthly revenue variations for Airbnb listings in San Benito is key to maximizing your short term rental income potential. Seasonality significantly impacts earnings. Our analysis, based on data from the past 12 months, shows that the peak revenue month for STRs in San Benito is typically March, while May often presents the lowest earnings, highlighting opportunities for strategic pricing adjustments during shoulder and low seasons. Explore the typical Airbnb income in San Benito across different performance tiers:
- Best-in-class properties (Top 10%) achieve $2,074+ monthly, often utilizing dynamic pricing and superior guest experiences.
- Strong performing properties (Top 25%) earn $1,536 or more, indicating effective management and desirable locations/amenities.
- Typical properties (Median) generate around $908 per month, representing the average market performance.
- Entry-level properties (Bottom 25%) see earnings around $547, often with potential for optimization.
Average Monthly Airbnb Earnings Trend in San Benito
San Benito Airbnb Occupancy Rate Trends (2026)
Maximize your bookings by understanding the San Benito STR occupancy trends. Seasonal demand shifts significantly influence how often properties are booked. Typically, Marchsees the highest demand (peak season occupancy), while May experiences the lowest (low season). Effective strategies, like adjusting minimum stays or offering promotions, can boost occupancy during slower periods. Here's how different property tiers perform in San Benito:
- Best-in-class properties (Top 10%) achieve 73%+ occupancy, indicating high desirability and potentially optimized availability.
- Strong performing properties (Top 25%) maintain 49% or higher occupancy, suggesting good market fit and guest satisfaction.
- Typical properties (Median) have an occupancy rate around 35%.
- Entry-level properties (Bottom 25%) average 19% occupancy, potentially facing higher vacancy.
Average Monthly Occupancy Rate Trend in San Benito
Average Daily Rate (ADR) Airbnb Trends in San Benito (2026)
Effective short term rental pricing strategy in San Benito involves understanding monthly ADR fluctuations. The Average Daily Rate (ADR) for Airbnb in San Benito typically peaks in October and dips lowest during September. Leveraging Airbnb dynamic pricing tools or strategies based on this seasonality can significantly boost revenue. Here's a look at the typical nightly rates achieved:
- Best-in-class properties (Top 10%) command rates of $139+ per night, often due to premium features or locations.
- Strong performing properties (Top 25%) achieve nightly rates of $111 or more.
- Typical properties (Median) charge around $94 per night.
- Entry-level properties (Bottom 25%) earn around $69 per night.
Average Daily Rate (ADR) Trend by Month in San Benito
Get Live San Benito Market Intelligence 👇

Explore Real-time Analytics
Airbnb Seasonality Analysis & Trends in San Benito (2026)
Peak Season (March, February, December)
- Revenue averages $1,748 per month
- Occupancy rates average 55.7%
- Daily rates average $97
Shoulder Season
- Revenue averages $995 per month
- Occupancy maintains around 34.0%
- Daily rates hold near $99
Low Season (May, June, September)
- Revenue drops to average $666 per month
- Occupancy decreases to average 26.4%
- Daily rates adjust to average $92
Seasonality Insights for San Benito
- The Airbnb seasonality in San Benito shows highly seasonal trends requiring careful strategy. While the sections above show seasonal averages, it's also insightful to look at the extremes:
- During the high season, the absolute peak month showcases San Benito's highest earning potential, with monthly revenues capable of climbing to $1,994, occupancy reaching a high of 62.4%, and ADRs peaking at $109.
- Conversely, the slowest single month of the year, typically falling within the low season, marks the market's lowest point. In this month, revenue might dip to $563, occupancy could drop to 19.0%, and ADRs may adjust down to $89.
- Understanding both the seasonal averages and these monthly peaks and troughs in revenue, occupancy, and ADR is crucial for maximizing your Airbnb profit potential in San Benito.
Seasonal Strategies for Maximizing Profit
- Peak Season: Maximize revenue through premium pricing and potentially longer minimum stays. Ensure high availability.
- Low Season: Offer competitive pricing, special promotions (e.g., extended stay discounts), and flexible cancellation policies. Target off-season travelers like remote workers or budget-conscious guests.
- Shoulder Seasons: Implement dynamic pricing that balances peak and low rates. Target weekend travelers or specific events. Offer slightly more flexible terms than peak season.
- Regularly analyze your own performance against these San Benito seasonality benchmarks and adjust your pricing and availability strategy accordingly.
Best Areas for Airbnb Investment in San Benito (2026)
Exploring the top neighborhoods for short-term rentals in San Benito? This section highlights key areas, outlining why they are attractive for hosts and guests, along with notable local attractions. Consider these locations based on your target guest profile and investment strategy.
| Neighborhood / Area | Why Host Here? (Target Guests & Appeal) | Key Attractions & Landmarks |
|---|---|---|
| Downtown San Benito | The heart of San Benito with historic charm. Ideal for visitors looking to explore local shops, restaurants, and cultural attractions. | San Benito Cultural Heritage Museum, City Hall, Los Indios Golf Course |
| San Benito Historical District | Rich in history and character, this district attracts guests interested in cultural experiences and heritage tourism. | Historic San Benito Cemetery, San Benito Jail Museum |
| Silver Palm | A family-friendly neighborhood with parks and local amenities, perfect for travelers seeking a laid-back, suburban feel. | Silver Palm Park, local dining options |
| North San Benito | Primarily residential but offers quiet surroundings and access to outdoor activities, appealing to nature lovers and families. | Resaca de la Palma State Park, Boca Chica Beach, Local fishing areas |
| Los Indios | A small but growing area with easy access to shopping and dining, ideal for budget-conscious travelers. | Local markets, Easy access to highway |
| South San Benito | A quieter neighborhood with a rural atmosphere, great for those looking for relaxation away from the busy tourist sites. | Nearby farms, Community parks |
| San Juan | Close proximity to San Benito, providing a unique blend of local culture and convenience. | San Juan Shrine, local eateries, cultural festivals |
| Bayview | Nestled on the edge of the bay, this area offers stunning views and outdoor activities for nature enthusiasts. | Bayview Park, water sports opportunities, fishing spots |
Understanding Airbnb License Requirements & STR Laws in San Benito (2026)
While San Benito, Texas, United States currently shows low STR regulations, specific Airbnb license requirements might still exist or change. Always verify the latest short term rental regulations and Airbnb license requirements directly with local government authorities for San Benito to ensure full compliance before hosting.
(Source: AirROI data, 2026, finding no licensed listings among those analyzed)
Top Performing Airbnb Properties in San Benito (2026)
Benchmark your potential! Explore examples of top-performing Airbnb properties in San Benitobased on Trailing Twelve Month (TTM) revenue. Analyze their characteristics, revenue, occupancy rate, and ADR to understand what drives success in this market.
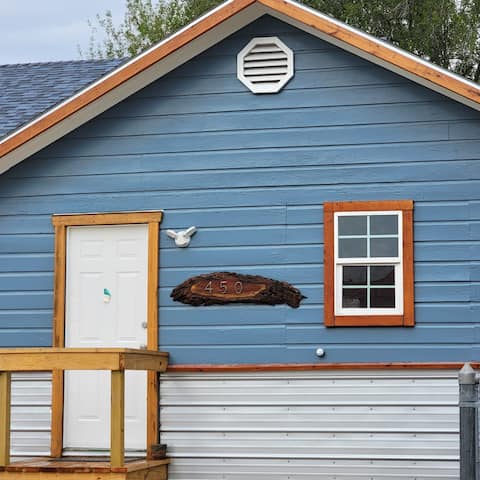
The New Comfy Blue Cottage
Entire Place • 2 bedrooms
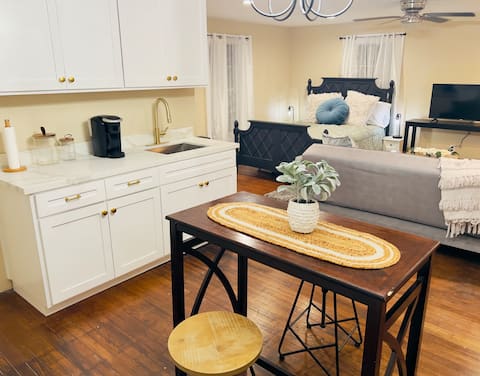
Cozy studio apartment with new pool!
Entire Place • 1 bedroom
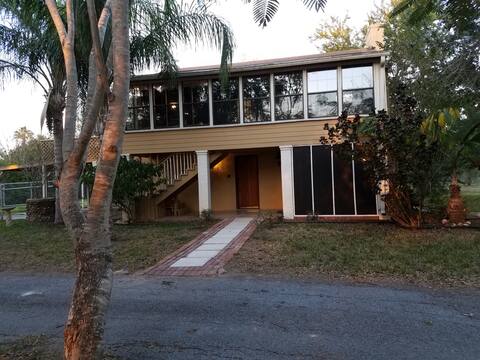
Birder's Paradise! Lake view apartment.
Entire Place • 1 bedroom

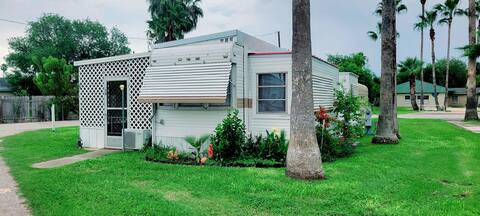
C2-- Cozy Cottage in a Spanish Hacienda
Entire Place • 1 bedroom
Joyful Cottage
Entire Place • 1 bedroom

C3--Great Cottage w/LOTS of Extras!
Entire Place • 1 bedroom
Note: Performance varies based on location, size, amenities, seasonality, and management quality. Data reflects the past 12 months.
Top Performing Airbnb Hosts in San Benito (2026)
Learn from the best! This table showcases top-performing Airbnb hosts in San Benito based on the number of properties managed and estimated total revenue over the past year. Analyze their scale and performance metrics.
| Host Name | Properties | Grossing Revenue | Stay Reviews | Avg Rating |
|---|---|---|---|---|
| Clarissa | 4 | $32,312 | 240 | 4.93/5.0 |
| Morgan | 2 | $19,490 | 31 | 4.88/5.0 |
| Fernando | 1 | $16,188 | 13 | 5.00/5.0 |
| Frank | 2 | $15,818 | 109 | 4.89/5.0 |
| Gracie | 1 | $9,815 | 15 | 5.00/5.0 |
| Melinda | 1 | $9,250 | 11 | 4.82/5.0 |
| Reynaldo | 1 | $7,946 | 75 | 4.96/5.0 |
| Patricia | 1 | $4,795 | 20 | 5.00/5.0 |
| Joel | 1 | $4,663 | 118 | 4.80/5.0 |
| David | 1 | $3,371 | 2 | Not Rated |
Analyzing the strategies of top hosts, such as their property selection, pricing, and guest communication, can offer valuable lessons for optimizing your own Airbnb operations in San Benito.
Dive Deeper: Advanced San Benito STR Market Data (2026)
Ready to unlock more insights? AirROI provides access to advanced metrics and comprehensive Airbnb data for San Benito. Explore detailed analytics beyond this report to refine your investment strategy, optimize pricing, and maximize your vacation rental profits.
Explore Advanced MetricsSan Benito Short-Term Rental Market Composition (2026): Property & Room Types
Room Type Distribution
Property Type Distribution
Market Composition Insights for San Benito
- The San Benito Airbnb market composition is heavily skewed towards Entire Home/Apt listings, which make up 100% of the 19 active rentals. This indicates strong guest preference for privacy and space.
- Looking at the property type distribution in San Benito, House properties are the most common (52.6%), reflecting the local real estate landscape.
- Houses represent a significant 52.6% portion, catering likely to families or larger groups.
- The presence of 5.3% Hotel/Boutique listings indicates integration with traditional hospitality.
San Benito Airbnb Room Capacity Analysis (2026): Bedroom Distribution
Distribution of Listings by Number of Bedrooms
Room Capacity Insights for San Benito
- The dominant room capacity in San Benito is 1 bedroom listings, making up 73.7% of the market. This suggests a strong demand for properties suitable for couples or solo travelers.
- Together, 1 bedroom and 3 bedrooms properties represent 89.5% of the active Airbnb listings in San Benito, indicating a high concentration in these sizes.
- With over half the market (73.7%) consisting of studios or 1-bedroom units, San Benito is particularly well-suited for individuals or couples.
San Benito Vacation Rental Guest Capacity Trends (2026)
Distribution of Listings by Guest Capacity
Guest Capacity Insights for San Benito
- The most common guest capacity trend in San Benito vacation rentals is listings accommodating 2 guests (42.1%). This suggests the primary traveler segment is likely couples or solo travelers.
- Properties designed for 2 guests and 4 guests dominate the San Benito STR market, accounting for 73.7% of listings.
- A significant 47.4% of listings cater specifically to 1-2 guests, highlighting strong demand from couples and solo travelers in San Benito.
- 10.6% of properties accommodate 6+ guests, serving the market segment for larger families or group travel in San Benito.
- On average, properties in San Benito are equipped to host 3.2 guests.
San Benito Airbnb Booking Patterns (2026): Available vs. Booked Days
Available Days Distribution
Booked Days Distribution
Booking Pattern Insights for San Benito
- The most common availability pattern in San Benito falls within the 271-366 days range, representing 63.2% of listings. This suggests many properties have significant open periods on their calendars.
- Approximately 94.8% of listings show high availability (181+ days open annually), indicating potential for increased bookings or specific owner usage patterns.
- For booked days, the 31-90 days range is most frequent in San Benito (42.1%), reflecting common guest stay durations or potential owner blocking patterns.
- A notable 5.3% of properties secure long booking periods (181+ days booked per year), highlighting successful long-term rental strategies or significant owner usage.
San Benito Airbnb Minimum Stay Requirements Analysis
Distribution of Listings by Minimum Night Requirement
1 Night
3 listings
15.8% of total
2 Nights
8 listings
42.1% of total
7-29 Nights
4 listings
21.1% of total
30+ Nights
4 listings
21.1% of total
Key Insights
- The most prevalent minimum stay requirement in San Benito is 2 Nights, adopted by 42.1% of listings. This highlights the market's preference for shorter, flexible bookings.
- A significant segment (21.1%) caters to monthly stays (30+ nights) in San Benito, pointing to opportunities in the extended-stay market.
Recommendations
- Align with the market by considering a 2 Nights minimum stay, as 42.1% of San Benito hosts use this setting.
- If feasible, allowing 1-night stays, especially midweek or during low season, could capture last-minute bookings, as only 15.8% currently do.
- A 2-night minimum appears standard (42.1%). Consider this for weekends or peak periods.
- Explore offering discounts for stays of 30+ nights to attract the 21.1% of the market seeking extended stays.
- Adjust minimum nights based on seasonality – potentially shorter during low season and longer during peak demand periods in San Benito.
San Benito Airbnb Cancellation Policy Trends Analysis (2026)
Flexible
11 listings
57.9% of total
Moderate
6 listings
31.6% of total
Firm
2 listings
10.5% of total
Cancellation Policy Insights for San Benito
- The prevailing Airbnb cancellation policy trend in San Benito is Flexible, used by 57.9% of listings.
- The market strongly favors guest-friendly terms, with 89.5% of listings offering Flexible or Moderate policies. This suggests guests in San Benito may expect booking flexibility.
Recommendations for Hosts
- Consider adopting a Flexible policy to align with the 57.9% market standard in San Benito.
- Given the high prevalence of Flexible policies (57.9%), offering this can enhance booking appeal, especially during shoulder seasons.
- Regularly review your cancellation policy against competitors and market demand shifts in San Benito.
San Benito STR Booking Lead Time Analysis (2026)
Average Booking Lead Time by Month
Booking Lead Time Insights for San Benito
- The overall average booking lead time for vacation rentals in San Benito is 49 days.
- Guests book furthest in advance for stays during February (average 113 days), likely coinciding with peak travel demand or local events.
- The shortest booking windows occur for stays in September (average 5 days), indicating more last-minute travel plans during this time.
- Seasonally, Winter (73 days avg.) sees the longest lead times, while Fall (12 days avg.) has the shortest, reflecting typical travel planning cycles.
Recommendations for Hosts
- Use the overall average lead time (49 days) as a baseline for your pricing and availability strategy in San Benito.
- For February stays, consider implementing length-of-stay discounts or slightly higher rates for bookings made less than 113 days out to capitalize on advance planning.
- During September, focus on last-minute booking availability and promotions, as guests book with very short notice (5 days avg.).
- Target marketing efforts for the Winter season well in advance (at least 73 days) to capture early planners.
- Monitor your own booking lead times against these San Benito averages to identify opportunities for dynamic pricing adjustments.
Popular & Essential Airbnb Amenities in San Benito (2026)
Amenity Prevalence
Amenity Insights for San Benito
- Essential amenities in San Benito that guests expect include: Air conditioning, Free parking on premises, Hot water, Refrigerator. Lacking these (any) could significantly impact bookings.
- Popular amenities like Dishes and silverware, Heating, Smoke alarm are common but not universal. Offering these can provide a competitive edge.
- Warning: Wifi is not universally provided but is considered essential globally. Ensure reliable Wifi is offered.
Recommendations for Hosts
- Ensure your listing includes all essential amenities for San Benito: Air conditioning, Free parking on premises, Hot water, Refrigerator.
- Consider adding popular differentiators like Dishes and silverware or Heating to increase appeal.
- Highlight unique or less common amenities you offer (e.g., hot tub, dedicated workspace, EV charger) in your listing description and photos.
- Regularly check competitor amenities in San Benito to stay competitive.
San Benito Airbnb Guest Demographics & Profile Analysis (2026)
Guest Profile Summary for San Benito
- The typical guest profile for Airbnb in San Benito consists of primarily domestic travelers (96%), often arriving from nearby Houston, typically belonging to the Post-2000s (Gen Z/Alpha) group (50%), primarily speaking English or Spanish.
- Domestic travelers account for 95.9% of guests.
- Key international markets include United States (95.9%) and Canada (4.1%).
- Top languages spoken are English (37.7%) followed by Spanish (14.5%).
- A significant demographic segment is the Post-2000s (Gen Z/Alpha) group, representing 50% of guests.
Recommendations for Hosts
- Target domestic marketing efforts towards travelers from Houston and San Antonio.
- Tailor amenities and listing descriptions to appeal to the dominant Post-2000s (Gen Z/Alpha) demographic (e.g., highlight fast WiFi, smart home features, local guides).
- Highlight unique local experiences or amenities relevant to the primary guest profile.
- Consider seasonal promotions aligned with peak travel times for key origin markets.
Nearby Short-Term Rental Market Comparison
How does the San Benito Airbnb market stack up against its neighbors? Compare key performance metrics like average monthly revenue, ADR, and occupancy rates in surrounding areas to understand the broader regional STR landscape.
| Market | Active Properties | Monthly Revenue | Daily Rate | Avg. Occupancy |
|---|---|---|---|---|
| City-by-the Sea | 24 | $4,479 | $520.08 | 35% |
| Port Aransas | 2,361 | $3,422 | $437.85 | 34% |
| South Padre Island | 2,347 | $2,957 | $341.64 | 36% |
| Port Mansfield | 29 | $2,788 | $374.59 | 32% |
| Alton | 13 | $2,484 | $392.58 | 23% |
| Rio Hondo | 46 | $2,381 | $309.67 | 31% |
| Port Isabel | 249 | $2,138 | $253.87 | 38% |
| Portland | 10 | $2,123 | $239.57 | 50% |
| Corpus Christi | 1,950 | $2,047 | $224.99 | 39% |
| Kingsville | 16 | $2,008 | $152.10 | 46% |