Tool Airbnb Market Analysis 2026: Short Term Rental Data & Vacation Rental Statistics in Texas, United States
Is Airbnb profitable in Tool in 2026? Explore comprehensive Airbnb analytics for Tool, Texas, United States to uncover income potential. This 2026 STR market report for Tool, based on AirROI data from February 2025 to January 2026, reveals key trends in the niche market of 47 active listings.
Whether you're considering an Airbnb investment in Tool, optimizing your existing vacation rental, or exploring rental arbitrage opportunities, understanding the Tool Airbnb data is crucial. Leveraging the low regulation environment is key to maximizing your short term rental income potential. Let's dive into the specifics.
Key Tool Airbnb Performance Metrics Overview
Monthly Airbnb Revenue Variations & Income Potential in Tool (2026)
Understanding the monthly revenue variations for Airbnb listings in Tool is key to maximizing your short term rental income potential. Seasonality significantly impacts earnings. Our analysis, based on data from the past 12 months, shows that the peak revenue month for STRs in Tool is typically July, while January often presents the lowest earnings, highlighting opportunities for strategic pricing adjustments during shoulder and low seasons. Explore the typical Airbnb income in Tool across different performance tiers:
- Best-in-class properties (Top 10%) achieve $6,430+ monthly, often utilizing dynamic pricing and superior guest experiences.
- Strong performing properties (Top 25%) earn $3,962 or more, indicating effective management and desirable locations/amenities.
- Typical properties (Median) generate around $2,362 per month, representing the average market performance.
- Entry-level properties (Bottom 25%) see earnings around $1,275, often with potential for optimization.
Average Monthly Airbnb Earnings Trend in Tool
Tool Airbnb Occupancy Rate Trends (2026)
Maximize your bookings by understanding the Tool STR occupancy trends. Seasonal demand shifts significantly influence how often properties are booked. Typically, Julysees the highest demand (peak season occupancy), while January experiences the lowest (low season). Effective strategies, like adjusting minimum stays or offering promotions, can boost occupancy during slower periods. Here's how different property tiers perform in Tool:
- Best-in-class properties (Top 10%) achieve 57%+ occupancy, indicating high desirability and potentially optimized availability.
- Strong performing properties (Top 25%) maintain 41% or higher occupancy, suggesting good market fit and guest satisfaction.
- Typical properties (Median) have an occupancy rate around 26%.
- Entry-level properties (Bottom 25%) average 13% occupancy, potentially facing higher vacancy.
Average Monthly Occupancy Rate Trend in Tool
Average Daily Rate (ADR) Airbnb Trends in Tool (2026)
Effective short term rental pricing strategy in Tool involves understanding monthly ADR fluctuations. The Average Daily Rate (ADR) for Airbnb in Tool typically peaks in June and dips lowest during January. Leveraging Airbnb dynamic pricing tools or strategies based on this seasonality can significantly boost revenue. Here's a look at the typical nightly rates achieved:
- Best-in-class properties (Top 10%) command rates of $530+ per night, often due to premium features or locations.
- Strong performing properties (Top 25%) achieve nightly rates of $393 or more.
- Typical properties (Median) charge around $290 per night.
- Entry-level properties (Bottom 25%) earn around $189 per night.
Average Daily Rate (ADR) Trend by Month in Tool
Get Live Tool Market Intelligence 👇

Explore Real-time Analytics
Airbnb Seasonality Analysis & Trends in Tool (2026)
Peak Season (July, June, August)
- Revenue averages $4,684 per month
- Occupancy rates average 38.1%
- Daily rates average $374
Shoulder Season
- Revenue averages $2,889 per month
- Occupancy maintains around 29.9%
- Daily rates hold near $342
Low Season (January, February, September)
- Revenue drops to average $1,939 per month
- Occupancy decreases to average 20.8%
- Daily rates adjust to average $326
Seasonality Insights for Tool
- The Airbnb seasonality in Tool shows highly seasonal trends requiring careful strategy. While the sections above show seasonal averages, it's also insightful to look at the extremes:
- During the high season, the absolute peak month showcases Tool's highest earning potential, with monthly revenues capable of climbing to $5,023, occupancy reaching a high of 42.4%, and ADRs peaking at $385.
- Conversely, the slowest single month of the year, typically falling within the low season, marks the market's lowest point. In this month, revenue might dip to $1,741, occupancy could drop to 16.9%, and ADRs may adjust down to $317.
- Understanding both the seasonal averages and these monthly peaks and troughs in revenue, occupancy, and ADR is crucial for maximizing your Airbnb profit potential in Tool.
Seasonal Strategies for Maximizing Profit
- Peak Season: Maximize revenue through premium pricing and potentially longer minimum stays. Ensure high availability.
- Low Season: Offer competitive pricing, special promotions (e.g., extended stay discounts), and flexible cancellation policies. Target off-season travelers like remote workers or budget-conscious guests.
- Shoulder Seasons: Implement dynamic pricing that balances peak and low rates. Target weekend travelers or specific events. Offer slightly more flexible terms than peak season.
- Regularly analyze your own performance against these Tool seasonality benchmarks and adjust your pricing and availability strategy accordingly.
Best Areas for Airbnb Investment in Tool (2026)
Exploring the top neighborhoods for short-term rentals in Tool? This section highlights key areas, outlining why they are attractive for hosts and guests, along with notable local attractions. Consider these locations based on your target guest profile and investment strategy.
| Neighborhood / Area | Why Host Here? (Target Guests & Appeal) | Key Attractions & Landmarks |
|---|---|---|
| West End | A vibrant area known for its nightlife and entertainment, making it a popular choice for tourists looking for an exciting stay full of activities. | The Rustic, Klyde Warren Park, AT&T Performing Arts Center, Dallas Museum of Art, American Airlines Center |
| Deep Ellum | A historic arts district famous for its live music scene and eclectic nightlife. Great for travelers seeking an artistic and cultural experience. | Deep Ellum Art Company, Cane Rosso, The Bomb Factory, Lizard Lounge, Street murals |
| Uptown | An upscale neighborhood filled with trendy restaurants, boutiques, and parks, ideal for visitors wanting a luxurious urban experience. | Katy Trail, The Quadrangle, The McKinney Avenue Trolley, West Village, Bishop Arts District |
| Lower Greenville | Known for its lively bar scene and diverse dining options, appealing to young adults and nightlife seekers. | Greenville Avenue, The Granada Theater, Barcadia, The Grape, Trader Joe's |
| Oak Cliff | A diverse area with a rich culture, known for its vibrant arts scene and historic sites. Great for travelers looking for a local experience. | Bishop Arts District, Oak Cliff Nature Preserve, Texas Theatre, Kessler Theater, Dallas Zoo |
| Victory Park | A bustling area near the American Airlines Center, perfect for sports fans and tourists interested in entertainment. | American Airlines Center, Victory Park Lake, The Perot Museum of Nature and Science, The Dallas World Aquarium, Clyde Warren Park |
| Arts District | Home to several museums, theaters, and art galleries. Ideal for cultural enthusiasts visiting the city. | Dallas Museum of Art, Nasher Sculpture Center, The Morton H. Meyerson Symphony Center, The Crow Collection of Asian Art, Texas Ballet Theater |
| Fort Worth Stockyards | A historic district reflecting Texas' ranching heritage, offering unique experiences for tourists interested in the Old West. | Fort Worth Stockyards National Historic District, Billy Bob's Texas, The Texas Cowboy Hall of Fame, Cattle Drives, The Stockyard Station |
Understanding Airbnb License Requirements & STR Laws in Tool (2026)
While Tool, Texas, United States currently shows low STR regulations, specific Airbnb license requirements might still exist or change. Always verify the latest short term rental regulations and Airbnb license requirements directly with local government authorities for Tool to ensure full compliance before hosting.
(Source: AirROI data, 2026, finding no licensed listings among those analyzed)
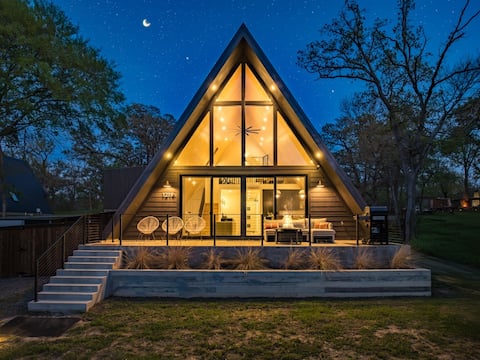
Top Performing Airbnb Properties in Tool (2026)
Benchmark your potential! Explore examples of top-performing Airbnb properties in Toolbased on Trailing Twelve Month (TTM) revenue. Analyze their characteristics, revenue, occupancy rate, and ADR to understand what drives success in this market.
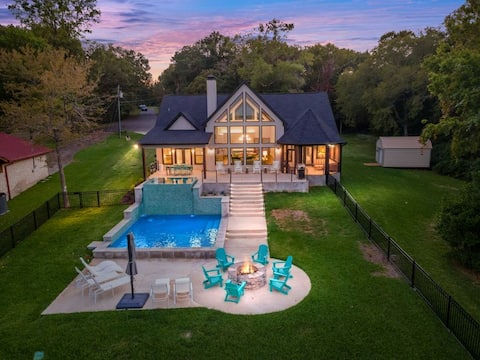
Lakeview Hideway
Entire Place • 4 bedrooms

Sleeps 20+| Lakefront Kayaks| Boats/Jetski Rentals
Entire Place • 5 bedrooms

New! 3 Acre, 5Bd/4.5Bth Lakehome w/Hottub/Cinema
Entire Place • 5 bedrooms
NEW-Hammock Deck/Lake Views/Fire Pit/Grill/Arcade
Entire Place • 3 bedrooms

The Lakehouse | Lakefront Boat & RV Getaway
Entire Place • 3 bedrooms

Lakefront w/ Dock, Theater, 350mb WIFI, Arcades
Entire Place • 4 bedrooms
Note: Performance varies based on location, size, amenities, seasonality, and management quality. Data reflects the past 12 months.
Top Performing Airbnb Hosts in Tool (2026)
Learn from the best! This table showcases top-performing Airbnb hosts in Tool based on the number of properties managed and estimated total revenue over the past year. Analyze their scale and performance metrics.
| Host Name | Properties | Grossing Revenue | Stay Reviews | Avg Rating |
|---|---|---|---|---|
| Janie | 1 | $127,352 | 105 | 4.90/5.0 |
| Paul | 1 | $108,611 | 27 | 4.93/5.0 |
| Craig | 1 | $60,662 | 67 | 4.78/5.0 |
| Lindsay And Tevin | 1 | $55,456 | 34 | 4.97/5.0 |
| Morgan | 2 | $54,993 | 28 | 4.88/5.0 |
| SideCribz | 1 | $51,398 | 28 | 4.86/5.0 |
| Joel | 1 | $50,821 | 59 | 4.95/5.0 |
| Brenda | 1 | $48,662 | 120 | 4.96/5.0 |
| Danelle | 1 | $46,677 | 21 | 5.00/5.0 |
| Brooks | 1 | $45,539 | 6 | 4.83/5.0 |
Analyzing the strategies of top hosts, such as their property selection, pricing, and guest communication, can offer valuable lessons for optimizing your own Airbnb operations in Tool.
Dive Deeper: Advanced Tool STR Market Data (2026)
Ready to unlock more insights? AirROI provides access to advanced metrics and comprehensive Airbnb data for Tool. Explore detailed analytics beyond this report to refine your investment strategy, optimize pricing, and maximize your vacation rental profits.
Explore Advanced MetricsTool Short-Term Rental Market Composition (2026): Property & Room Types
Room Type Distribution
Property Type Distribution
Market Composition Insights for Tool
- The Tool Airbnb market composition is heavily skewed towards Entire Home/Apt listings, which make up 100% of the 47 active rentals. This indicates strong guest preference for privacy and space.
- Looking at the property type distribution in Tool, House properties are the most common (93.6%), reflecting the local real estate landscape.
- Houses represent a significant 93.6% portion, catering likely to families or larger groups.
- Smaller segments like outdoor/unique, unique stays (combined 6.4%) offer potential for unique stay experiences.
Tool Airbnb Room Capacity Analysis (2026): Bedroom Distribution
Distribution of Listings by Number of Bedrooms
Room Capacity Insights for Tool
- The dominant room capacity in Tool is 3 bedrooms listings, making up 46.8% of the market. This suggests a strong demand for properties suitable for families or small groups.
- Together, 3 bedrooms and 4 bedrooms properties represent 83.0% of the active Airbnb listings in Tool, indicating a high concentration in these sizes.
- A significant 93.6% of listings offer 3+ bedrooms, catering to larger groups and families seeking more space in Tool.
Tool Vacation Rental Guest Capacity Trends (2026)
Distribution of Listings by Guest Capacity
Guest Capacity Insights for Tool
- The most common guest capacity trend in Tool vacation rentals is listings accommodating 8+ guests (78.7%). This suggests the primary traveler segment is likely larger groups.
- Properties designed for 8+ guests and 6 guests dominate the Tool STR market, accounting for 89.3% of listings.
- 97.8% of properties accommodate 6+ guests, serving the market segment for larger families or group travel in Tool.
- On average, properties in Tool are equipped to host 7.6 guests.
Tool Airbnb Booking Patterns (2026): Available vs. Booked Days
Available Days Distribution
Booked Days Distribution
Booking Pattern Insights for Tool
- The most common availability pattern in Tool falls within the 181-270 days range, representing 51.1% of listings. This suggests many properties have significant open periods on their calendars.
- Approximately 97.9% of listings show high availability (181+ days open annually), indicating potential for increased bookings or specific owner usage patterns.
- For booked days, the 91-180 days range is most frequent in Tool (51.1%), reflecting common guest stay durations or potential owner blocking patterns.
- A notable 2.1% of properties secure long booking periods (181+ days booked per year), highlighting successful long-term rental strategies or significant owner usage.
Tool Airbnb Minimum Stay Requirements Analysis
Distribution of Listings by Minimum Night Requirement
1 Night
4 listings
8.5% of total
2 Nights
23 listings
48.9% of total
3 Nights
1 listings
2.1% of total
4-6 Nights
1 listings
2.1% of total
7-29 Nights
1 listings
2.1% of total
30+ Nights
17 listings
36.2% of total
Key Insights
- The most prevalent minimum stay requirement in Tool is 2 Nights, adopted by 48.9% of listings. This highlights the market's preference for shorter, flexible bookings.
- A significant segment (36.2%) caters to monthly stays (30+ nights) in Tool, pointing to opportunities in the extended-stay market.
Recommendations
- Align with the market by considering a 2 Nights minimum stay, as 48.9% of Tool hosts use this setting.
- If feasible, allowing 1-night stays, especially midweek or during low season, could capture last-minute bookings, as only 8.5% currently do.
- A 2-night minimum appears standard (48.9%). Consider this for weekends or peak periods.
- Explore offering discounts for stays of 30+ nights to attract the 36.2% of the market seeking extended stays.
- Adjust minimum nights based on seasonality – potentially shorter during low season and longer during peak demand periods in Tool.
Tool Airbnb Cancellation Policy Trends Analysis (2026)
Flexible
9 listings
19.1% of total
Moderate
17 listings
36.2% of total
Firm
14 listings
29.8% of total
Strict
7 listings
14.9% of total
Cancellation Policy Insights for Tool
- The prevailing Airbnb cancellation policy trend in Tool is Moderate, used by 36.2% of listings.
- There's a relatively balanced mix between guest-friendly (55.3%) and stricter (44.7%) policies, offering choices for different guest needs.
Recommendations for Hosts
- Consider adopting a Moderate policy to align with the 36.2% market standard in Tool.
- Using a Strict policy might deter some guests, as only 14.9% of listings use it. Evaluate if potential revenue protection outweighs possible lower booking rates.
- Regularly review your cancellation policy against competitors and market demand shifts in Tool.
Tool STR Booking Lead Time Analysis (2026)
Average Booking Lead Time by Month
Booking Lead Time Insights for Tool
- The overall average booking lead time for vacation rentals in Tool is 37 days.
- Guests book furthest in advance for stays during July (average 60 days), likely coinciding with peak travel demand or local events.
- The shortest booking windows occur for stays in March (average 20 days), indicating more last-minute travel plans during this time.
- Seasonally, Summer (48 days avg.) sees the longest lead times, while Spring (28 days avg.) has the shortest, reflecting typical travel planning cycles.
Recommendations for Hosts
- Use the overall average lead time (37 days) as a baseline for your pricing and availability strategy in Tool.
- For July stays, consider implementing length-of-stay discounts or slightly higher rates for bookings made less than 60 days out to capitalize on advance planning.
- Target marketing efforts for the Summer season well in advance (at least 48 days) to capture early planners.
- Monitor your own booking lead times against these Tool averages to identify opportunities for dynamic pricing adjustments.
Popular & Essential Airbnb Amenities in Tool (2026)
Amenity Prevalence
Amenity Insights for Tool
- Essential amenities in Tool that guests expect include: Air conditioning, Smoke alarm, TV, Hot water, Kitchen, Washer, Heating, Free parking on premises, Hangers, Coffee maker. Lacking these (any) could significantly impact bookings.
Recommendations for Hosts
- Ensure your listing includes all essential amenities for Tool: Air conditioning, Smoke alarm, TV, Hot water, Kitchen, Washer, Heating, Free parking on premises, Hangers, Coffee maker.
- Prioritize adding missing essentials: Washer, Heating, Free parking on premises, Hangers, Coffee maker.
- Highlight unique or less common amenities you offer (e.g., hot tub, dedicated workspace, EV charger) in your listing description and photos.
- Regularly check competitor amenities in Tool to stay competitive.
Tool Airbnb Guest Demographics & Profile Analysis (2026)
Guest Profile Summary for Tool
- The typical guest profile for Airbnb in Tool consists of primarily domestic travelers (98%), often arriving from nearby Dallas, typically belonging to the Post-2000s (Gen Z/Alpha) group (50%), primarily speaking English or Spanish.
- Domestic travelers account for 98.0% of guests.
- Key international markets include United States (98%) and Mexico (0.8%).
- Top languages spoken are English (76.4%) followed by Spanish (17%).
- A significant demographic segment is the Post-2000s (Gen Z/Alpha) group, representing 50% of guests.
Recommendations for Hosts
- Target domestic marketing efforts towards travelers from Dallas and Austin.
- Tailor amenities and listing descriptions to appeal to the dominant Post-2000s (Gen Z/Alpha) demographic (e.g., highlight fast WiFi, smart home features, local guides).
- Highlight unique local experiences or amenities relevant to the primary guest profile.
- Consider seasonal promotions aligned with peak travel times for key origin markets.
Nearby Short-Term Rental Market Comparison
How does the Tool Airbnb market stack up against its neighbors? Compare key performance metrics like average monthly revenue, ADR, and occupancy rates in surrounding areas to understand the broader regional STR landscape.
| Market | Active Properties | Monthly Revenue | Daily Rate | Avg. Occupancy |
|---|---|---|---|---|
| Star Harbor | 11 | $5,474 | $741.72 | 33% |
| Valley View | 25 | $5,111 | $484.73 | 39% |
| Bluff Dale | 18 | $4,063 | $411.68 | 29% |
| Red Oak | 17 | $3,978 | $288.35 | 50% |
| DeSoto | 29 | $3,947 | $332.58 | 47% |
| Holly Lake Ranch | 11 | $3,836 | $358.93 | 36% |
| Flower Mound | 79 | $3,760 | $326.24 | 45% |
| Azle | 62 | $3,533 | $323.80 | 41% |
| Westworth Village | 11 | $3,530 | $240.30 | 48% |
| Highland Village | 15 | $3,363 | $345.42 | 48% |