La Sal Airbnb Market Analysis 2026: Short Term Rental Data & Vacation Rental Statistics in Utah, United States
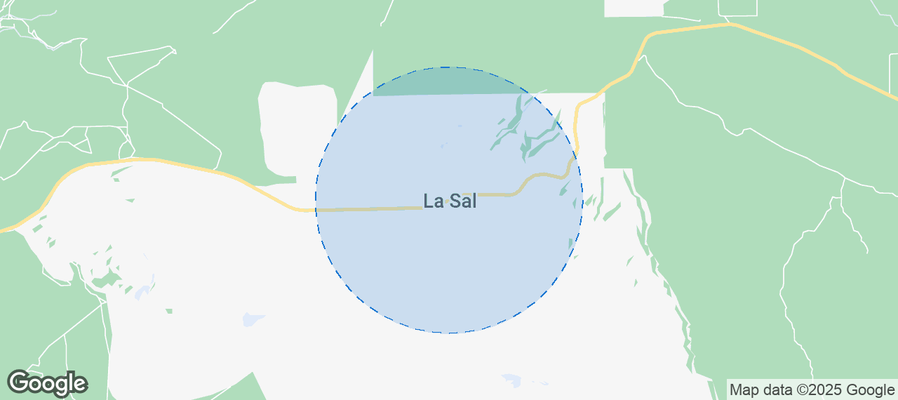
Is Airbnb profitable in La Sal in 2026? Explore comprehensive Airbnb analytics for La Sal, Utah, United States to uncover income potential. This 2026 STR market report for La Sal, based on AirROI data from February 2025 to January 2026, reveals key trends in the niche market of 22 active listings.
Whether you're considering an Airbnb investment in La Sal, optimizing your existing vacation rental, or exploring rental arbitrage opportunities, understanding the La Sal Airbnb data is crucial. Leveraging the low regulation environment is key to maximizing your short term rental income potential. Let's dive into the specifics.
Key La Sal Airbnb Performance Metrics Overview
Monthly Airbnb Revenue Variations & Income Potential in La Sal (2026)
Understanding the monthly revenue variations for Airbnb listings in La Sal is key to maximizing your short term rental income potential. Seasonality significantly impacts earnings. Our analysis, based on data from the past 12 months, shows that the peak revenue month for STRs in La Sal is typically March, while January often presents the lowest earnings, highlighting opportunities for strategic pricing adjustments during shoulder and low seasons. Explore the typical Airbnb income in La Sal across different performance tiers:
- Best-in-class properties (Top 10%) achieve $3,518+ monthly, often utilizing dynamic pricing and superior guest experiences.
- Strong performing properties (Top 25%) earn $2,405 or more, indicating effective management and desirable locations/amenities.
- Typical properties (Median) generate around $1,519 per month, representing the average market performance.
- Entry-level properties (Bottom 25%) see earnings around $851, often with potential for optimization.
Average Monthly Airbnb Earnings Trend in La Sal
La Sal Airbnb Occupancy Rate Trends (2026)
Maximize your bookings by understanding the La Sal STR occupancy trends. Seasonal demand shifts significantly influence how often properties are booked. Typically, Marchsees the highest demand (peak season occupancy), while January experiences the lowest (low season). Effective strategies, like adjusting minimum stays or offering promotions, can boost occupancy during slower periods. Here's how different property tiers perform in La Sal:
- Best-in-class properties (Top 10%) achieve 59%+ occupancy, indicating high desirability and potentially optimized availability.
- Strong performing properties (Top 25%) maintain 43% or higher occupancy, suggesting good market fit and guest satisfaction.
- Typical properties (Median) have an occupancy rate around 28%.
- Entry-level properties (Bottom 25%) average 18% occupancy, potentially facing higher vacancy.
Average Monthly Occupancy Rate Trend in La Sal
Average Daily Rate (ADR) Airbnb Trends in La Sal (2026)
Effective short term rental pricing strategy in La Sal involves understanding monthly ADR fluctuations. The Average Daily Rate (ADR) for Airbnb in La Sal typically peaks in October and dips lowest during January. Leveraging Airbnb dynamic pricing tools or strategies based on this seasonality can significantly boost revenue. Here's a look at the typical nightly rates achieved:
- Best-in-class properties (Top 10%) command rates of $236+ per night, often due to premium features or locations.
- Strong performing properties (Top 25%) achieve nightly rates of $197 or more.
- Typical properties (Median) charge around $160 per night.
- Entry-level properties (Bottom 25%) earn around $141 per night.
Average Daily Rate (ADR) Trend by Month in La Sal
Get Live La Sal Market Intelligence 👇
Explore Real-time Analytics
Airbnb Seasonality Analysis & Trends in La Sal (2026)
Peak Season (March, October, April)
- Revenue averages $2,839 per month
- Occupancy rates average 47.2%
- Daily rates average $188
Shoulder Season
- Revenue averages $1,895 per month
- Occupancy maintains around 33.1%
- Daily rates hold near $179
Low Season (January, February, August)
- Revenue drops to average $819 per month
- Occupancy decreases to average 18.6%
- Daily rates adjust to average $169
Seasonality Insights for La Sal
- The Airbnb seasonality in La Sal shows highly seasonal trends requiring careful strategy. While the sections above show seasonal averages, it's also insightful to look at the extremes:
- During the high season, the absolute peak month showcases La Sal's highest earning potential, with monthly revenues capable of climbing to $2,922, occupancy reaching a high of 53.2%, and ADRs peaking at $197.
- Conversely, the slowest single month of the year, typically falling within the low season, marks the market's lowest point. In this month, revenue might dip to $658, occupancy could drop to 14.5%, and ADRs may adjust down to $165.
- Understanding both the seasonal averages and these monthly peaks and troughs in revenue, occupancy, and ADR is crucial for maximizing your Airbnb profit potential in La Sal.
Seasonal Strategies for Maximizing Profit
- Peak Season: Maximize revenue through premium pricing and potentially longer minimum stays. Ensure high availability.
- Low Season: Offer competitive pricing, special promotions (e.g., extended stay discounts), and flexible cancellation policies. Target off-season travelers like remote workers or budget-conscious guests.
- Shoulder Seasons: Implement dynamic pricing that balances peak and low rates. Target weekend travelers or specific events. Offer slightly more flexible terms than peak season.
- Regularly analyze your own performance against these La Sal seasonality benchmarks and adjust your pricing and availability strategy accordingly.
Best Areas for Airbnb Investment in La Sal (2026)
Exploring the top neighborhoods for short-term rentals in La Sal? This section highlights key areas, outlining why they are attractive for hosts and guests, along with notable local attractions. Consider these locations based on your target guest profile and investment strategy.
| Neighborhood / Area | Why Host Here? (Target Guests & Appeal) | Key Attractions & Landmarks |
|---|---|---|
| Fish Springs Wilderness | A remote and scenic area offering unique wildlife and outdoor activities. Ideal for those looking to escape to nature and attract adventurous travelers. | Great Salt Lake, Birdwatching, Photography opportunities, Hiking trails, Camping, Wildlife viewing |
| Antelope Island State Park | A popular destination known for its stunning landscapes and bison herds. Great for nature lovers and outdoor activities, appealing to a wide range of visitors. | Bison Herds, Hiking Trails, Beach Areas, Stargazing, Photography, Visitor Center |
| Bonneville Salt Flats | Famous for its vast, flat landscapes and unique geological features. Attracts photographers, motorsport enthusiasts, and those seeking an unusual adventure. | Land Speed Racing, Photography, Walking on the Flats, Stargazing |
| Great Salt Lake Audubon Society | Ideal for bird watching and nature experiences, attracting eco-tourists and families looking for educational experiences in wildlife. | Birdwatching, Nature Trails, Educational Programs, Wildlife Viewing |
| Golden Spike National Historical Park | Historical landmark that attracts history buffs and families interested in early American engineering and railroad history. | Historical Exhibits, Visitor Center, Reenactments, Scenic Views |
| Layton | A growing city close to Salt Lake City with access to parks, shopping, and dining, making it appealing for family-oriented travelers. | Layton Park, Shopping Centers, Dining Options, Parks and Recreation Areas |
| Hill Air Force Base Museum | An interesting attraction for military enthusiasts and families, offering educational experiences about aviation and military history. | Aviation Exhibits, Historic Aircraft, Educational Programs |
| Ogden | A vibrant city with a rich history and access to natural beauty, making it attractive for both cultural and outdoor tourism. | Historic 25th Street, Ogden Botanical Gardens, Snowbasin Resort, Railroad Museum |
Understanding Airbnb License Requirements & STR Laws in La Sal (2026)
While La Sal, Utah, United States currently shows low STR regulations, specific Airbnb license requirements might still exist or change. Always verify the latest short term rental regulations and Airbnb license requirements directly with local government authorities for La Sal to ensure full compliance before hosting.
(Source: AirROI data, 2026, finding no licensed listings among those analyzed)
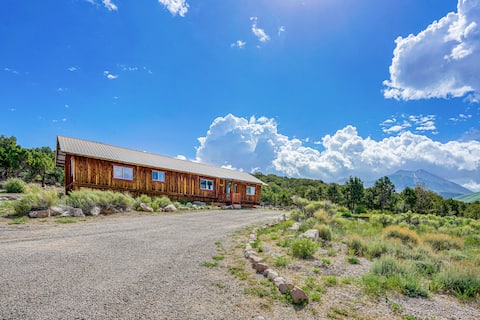
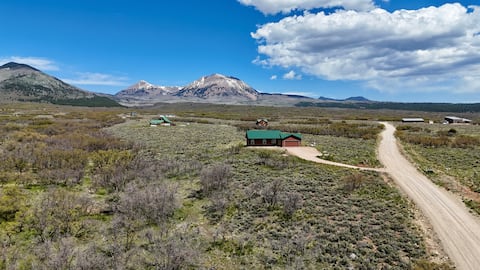
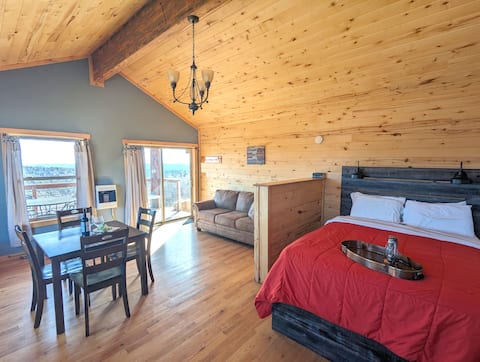
Top Performing Airbnb Properties in La Sal (2026)
Benchmark your potential! Explore examples of top-performing Airbnb properties in La Salbased on Trailing Twelve Month (TTM) revenue. Analyze their characteristics, revenue, occupancy rate, and ADR to understand what drives success in this market.
‘Sunset Cabin’ near Moab w/ Stunning Views!
Entire Place • 2 bedrooms
Yellow Door Retreat I Mountain Views I Privacy
Entire Place • 3 bedrooms

Mount Peale Cabin 3 (Near Moab)
Entire Place • 3 bedrooms

The Destination: Window to the La Sals & Moab, UT
Entire Place • 3 bedrooms
Wolf Springs Ranch, Cabin 5
Entire Place • 1 bedroom
Aspen Cabin
Entire Place • 3 bedrooms
Note: Performance varies based on location, size, amenities, seasonality, and management quality. Data reflects the past 12 months.
Top Performing Airbnb Hosts in La Sal (2026)
Learn from the best! This table showcases top-performing Airbnb hosts in La Sal based on the number of properties managed and estimated total revenue over the past year. Analyze their scale and performance metrics.
| Host Name | Properties | Grossing Revenue | Stay Reviews | Avg Rating |
|---|---|---|---|---|
| Canyons And Coastlines Lodging | 9 | $125,241 | 156 | 4.82/5.0 |
| Amanda | 7 | $83,233 | 41 | 5.00/5.0 |
| Jeff Gauvin | 3 | $64,566 | 50 | 4.95/5.0 |
| Evolve | 1 | $41,556 | 16 | 4.94/5.0 |
| Mary | 1 | $17,403 | 8 | 4.75/5.0 |
| Karry | 1 | $11,487 | 41 | 4.93/5.0 |
Analyzing the strategies of top hosts, such as their property selection, pricing, and guest communication, can offer valuable lessons for optimizing your own Airbnb operations in La Sal.
Dive Deeper: Advanced La Sal STR Market Data (2026)
Ready to unlock more insights? AirROI provides access to advanced metrics and comprehensive Airbnb data for La Sal. Explore detailed analytics beyond this report to refine your investment strategy, optimize pricing, and maximize your vacation rental profits.
Explore Advanced MetricsLa Sal Short-Term Rental Market Composition (2026): Property & Room Types
Room Type Distribution
Property Type Distribution
Market Composition Insights for La Sal
- The La Sal Airbnb market composition is heavily skewed towards Entire Home/Apt listings, which make up 72.7% of the 22 active rentals. This indicates strong guest preference for privacy and space.
- Looking at the property type distribution in La Sal, Outdoor/Unique properties are the most common (59.1%), reflecting the local real estate landscape.
- The presence of 27.3% Hotel/Boutique listings indicates integration with traditional hospitality.
La Sal Airbnb Room Capacity Analysis (2026): Bedroom Distribution
Distribution of Listings by Number of Bedrooms
Room Capacity Insights for La Sal
- The dominant room capacity in La Sal is 1 bedroom listings, making up 40.9% of the market. This suggests a strong demand for properties suitable for couples or solo travelers.
- Together, 1 bedroom and 3 bedrooms properties represent 59.1% of the active Airbnb listings in La Sal, indicating a high concentration in these sizes.
- A significant 22.7% of listings offer 3+ bedrooms, catering to larger groups and families seeking more space in La Sal.
La Sal Vacation Rental Guest Capacity Trends (2026)
Distribution of Listings by Guest Capacity
Guest Capacity Insights for La Sal
- The most common guest capacity trend in La Sal vacation rentals is listings accommodating 6 guests (36.4%). This suggests the primary traveler segment is likely larger groups.
- Properties designed for 6 guests and 4 guests dominate the La Sal STR market, accounting for 63.7% of listings.
- 40.9% of properties accommodate 6+ guests, serving the market segment for larger families or group travel in La Sal.
- On average, properties in La Sal are equipped to host 3.7 guests.
La Sal Airbnb Booking Patterns (2026): Available vs. Booked Days
Available Days Distribution
Booked Days Distribution
Booking Pattern Insights for La Sal
- The most common availability pattern in La Sal falls within the 271-366 days range, representing 72.7% of listings. This suggests many properties have significant open periods on their calendars.
- Approximately 100.0% of listings show high availability (181+ days open annually), indicating potential for increased bookings or specific owner usage patterns.
- For booked days, the 31-90 days range is most frequent in La Sal (68.2%), reflecting common guest stay durations or potential owner blocking patterns.
La Sal Airbnb Minimum Stay Requirements Analysis
Distribution of Listings by Minimum Night Requirement
1 Night
15 listings
68.2% of total
2 Nights
4 listings
18.2% of total
3 Nights
1 listings
4.5% of total
30+ Nights
2 listings
9.1% of total
Key Insights
- The most prevalent minimum stay requirement in La Sal is 1 Night, adopted by 68.2% of listings. This highlights the market's preference for shorter, flexible bookings.
- A strong majority (86.4%) of the La Sal Airbnb data shows acceptance of very short stays (1-2 nights), indicating a dynamic, high-turnover market.
Recommendations
- Align with the market by considering a 1 Night minimum stay, as 68.2% of La Sal hosts use this setting.
- Explore offering discounts for stays of 30+ nights to attract the 9.1% of the market seeking extended stays.
- Adjust minimum nights based on seasonality – potentially shorter during low season and longer during peak demand periods in La Sal.
La Sal Airbnb Cancellation Policy Trends Analysis (2026)
Super Strict 30 Days
6 listings
27.3% of total
Flexible
3 listings
13.6% of total
Moderate
9 listings
40.9% of total
Firm
3 listings
13.6% of total
Strict
1 listings
4.5% of total
Cancellation Policy Insights for La Sal
- The prevailing Airbnb cancellation policy trend in La Sal is Moderate, used by 40.9% of listings.
- There's a relatively balanced mix between guest-friendly (54.5%) and stricter (18.1%) policies, offering choices for different guest needs.
- Strict cancellation policies are quite rare (4.5%), potentially making listings with this policy less competitive unless justified by high demand or property type.
Recommendations for Hosts
- Consider adopting a Moderate policy to align with the 40.9% market standard in La Sal.
- Using a Strict policy might deter some guests, as only 4.5% of listings use it. Evaluate if potential revenue protection outweighs possible lower booking rates.
- Regularly review your cancellation policy against competitors and market demand shifts in La Sal.
La Sal STR Booking Lead Time Analysis (2026)
Average Booking Lead Time by Month
Booking Lead Time Insights for La Sal
- The overall average booking lead time for vacation rentals in La Sal is 43 days.
- Guests book furthest in advance for stays during May (average 65 days), likely coinciding with peak travel demand or local events.
- The shortest booking windows occur for stays in January (average 3 days), indicating more last-minute travel plans during this time.
- Seasonally, Spring (49 days avg.) sees the longest lead times, while Winter (18 days avg.) has the shortest, reflecting typical travel planning cycles.
Recommendations for Hosts
- Use the overall average lead time (43 days) as a baseline for your pricing and availability strategy in La Sal.
- For May stays, consider implementing length-of-stay discounts or slightly higher rates for bookings made less than 65 days out to capitalize on advance planning.
- During January, focus on last-minute booking availability and promotions, as guests book with very short notice (3 days avg.).
- Target marketing efforts for the Spring season well in advance (at least 49 days) to capture early planners.
- Monitor your own booking lead times against these La Sal averages to identify opportunities for dynamic pricing adjustments.
Popular & Essential Airbnb Amenities in La Sal (2026)
Amenity Prevalence
Amenity Insights for La Sal
- Essential amenities in La Sal that guests expect include: Smoke alarm, Free parking on premises, Kitchen, Wifi, Hot water, Heating, Carbon monoxide alarm. Lacking these (any) could significantly impact bookings.
- Popular amenities like Dining table, Cooking basics, Dishes and silverware are common but not universal. Offering these can provide a competitive edge.
Recommendations for Hosts
- Ensure your listing includes all essential amenities for La Sal: Smoke alarm, Free parking on premises, Kitchen, Wifi, Hot water, Heating, Carbon monoxide alarm.
- Prioritize adding missing essentials: Hot water, Heating, Carbon monoxide alarm.
- Consider adding popular differentiators like Dining table or Cooking basics to increase appeal.
- Highlight unique or less common amenities you offer (e.g., hot tub, dedicated workspace, EV charger) in your listing description and photos.
- Regularly check competitor amenities in La Sal to stay competitive.
La Sal Airbnb Guest Demographics & Profile Analysis (2026)
Guest Profile Summary for La Sal
- The typical guest profile for Airbnb in La Sal consists of primarily domestic travelers (91%), often arriving from nearby Denver, typically belonging to the Post-2000s (Gen Z/Alpha) group (50%), primarily speaking English or Spanish.
- Domestic travelers account for 91.0% of guests.
- Key international markets include United States (91%) and Germany (5.6%).
- Top languages spoken are English (57.4%) followed by Spanish (10.6%).
- A significant demographic segment is the Post-2000s (Gen Z/Alpha) group, representing 50% of guests.
Recommendations for Hosts
- Target domestic marketing efforts towards travelers from Denver and Salt Lake City.
- Tailor amenities and listing descriptions to appeal to the dominant Post-2000s (Gen Z/Alpha) demographic (e.g., highlight fast WiFi, smart home features, local guides).
- Highlight unique local experiences or amenities relevant to the primary guest profile.
- Consider seasonal promotions aligned with peak travel times for key origin markets.
Nearby Short-Term Rental Market Comparison
How does the La Sal Airbnb market stack up against its neighbors? Compare key performance metrics like average monthly revenue, ADR, and occupancy rates in surrounding areas to understand the broader regional STR landscape.
| Market | Active Properties | Monthly Revenue | Daily Rate | Avg. Occupancy |
|---|---|---|---|---|
| Placerville | 19 | $4,824 | $525.16 | 41% |
| Spanish Valley | 96 | $4,655 | $353.11 | 45% |
| Moab | 1,006 | $4,110 | $313.12 | 48% |
| Hanksville | 13 | $2,859 | $200.89 | 55% |
| Hesperus | 27 | $2,723 | $345.57 | 37% |
| San Juan County | 10 | $2,719 | $286.82 | 37% |
| Bluff | 18 | $2,663 | $230.65 | 44% |
| Mesa | 28 | $2,640 | $287.97 | 34% |
| Palisade | 111 | $2,572 | $251.76 | 43% |
| Clifton | 25 | $2,561 | $201.23 | 46% |