Montgomery Airbnb Market Analysis 2026: Short Term Rental Data & Vacation Rental Statistics in Vermont, United States
Is Airbnb profitable in Montgomery in 2026? Explore comprehensive Airbnb analytics for Montgomery, Vermont, United States to uncover income potential. This 2026 STR market report for Montgomery, based on AirROI data from February 2025 to January 2026, reveals key trends in the niche market of 61 active listings.
Whether you're considering an Airbnb investment in Montgomery, optimizing your existing vacation rental, or exploring rental arbitrage opportunities, understanding the Montgomery Airbnb data is crucial. Leveraging the low regulation environment is key to maximizing your short term rental income potential. Let's dive into the specifics.
Key Montgomery Airbnb Performance Metrics Overview
Monthly Airbnb Revenue Variations & Income Potential in Montgomery (2026)
Understanding the monthly revenue variations for Airbnb listings in Montgomery is key to maximizing your short term rental income potential. Seasonality significantly impacts earnings. Our analysis, based on data from the past 12 months, shows that the peak revenue month for STRs in Montgomery is typically March, while April often presents the lowest earnings, highlighting opportunities for strategic pricing adjustments during shoulder and low seasons. Explore the typical Airbnb income in Montgomery across different performance tiers:
- Best-in-class properties (Top 10%) achieve $6,326+ monthly, often utilizing dynamic pricing and superior guest experiences.
- Strong performing properties (Top 25%) earn $4,109 or more, indicating effective management and desirable locations/amenities.
- Typical properties (Median) generate around $2,589 per month, representing the average market performance.
- Entry-level properties (Bottom 25%) see earnings around $1,515, often with potential for optimization.
Average Monthly Airbnb Earnings Trend in Montgomery
Montgomery Airbnb Occupancy Rate Trends (2026)
Maximize your bookings by understanding the Montgomery STR occupancy trends. Seasonal demand shifts significantly influence how often properties are booked. Typically, Februarysees the highest demand (peak season occupancy), while April experiences the lowest (low season). Effective strategies, like adjusting minimum stays or offering promotions, can boost occupancy during slower periods. Here's how different property tiers perform in Montgomery:
- Best-in-class properties (Top 10%) achieve 73%+ occupancy, indicating high desirability and potentially optimized availability.
- Strong performing properties (Top 25%) maintain 57% or higher occupancy, suggesting good market fit and guest satisfaction.
- Typical properties (Median) have an occupancy rate around 36%.
- Entry-level properties (Bottom 25%) average 22% occupancy, potentially facing higher vacancy.
Average Monthly Occupancy Rate Trend in Montgomery
Average Daily Rate (ADR) Airbnb Trends in Montgomery (2026)
Effective short term rental pricing strategy in Montgomery involves understanding monthly ADR fluctuations. The Average Daily Rate (ADR) for Airbnb in Montgomery typically peaks in January and dips lowest during May. Leveraging Airbnb dynamic pricing tools or strategies based on this seasonality can significantly boost revenue. Here's a look at the typical nightly rates achieved:
- Best-in-class properties (Top 10%) command rates of $412+ per night, often due to premium features or locations.
- Strong performing properties (Top 25%) achieve nightly rates of $301 or more.
- Typical properties (Median) charge around $239 per night.
- Entry-level properties (Bottom 25%) earn around $181 per night.
Average Daily Rate (ADR) Trend by Month in Montgomery
Get Live Montgomery Market Intelligence 👇

Explore Real-time Analytics
Airbnb Seasonality Analysis & Trends in Montgomery (2026)
Peak Season (March, February, January)
- Revenue averages $4,538 per month
- Occupancy rates average 56.1%
- Daily rates average $269
Shoulder Season
- Revenue averages $3,003 per month
- Occupancy maintains around 36.5%
- Daily rates hold near $258
Low Season (April, May, September)
- Revenue drops to average $2,220 per month
- Occupancy decreases to average 31.2%
- Daily rates adjust to average $240
Seasonality Insights for Montgomery
- The Airbnb seasonality in Montgomery shows highly seasonal trends requiring careful strategy. While the sections above show seasonal averages, it's also insightful to look at the extremes:
- During the high season, the absolute peak month showcases Montgomery's highest earning potential, with monthly revenues capable of climbing to $4,952, occupancy reaching a high of 62.6%, and ADRs peaking at $303.
- Conversely, the slowest single month of the year, typically falling within the low season, marks the market's lowest point. In this month, revenue might dip to $2,102, occupancy could drop to 30.7%, and ADRs may adjust down to $229.
- Understanding both the seasonal averages and these monthly peaks and troughs in revenue, occupancy, and ADR is crucial for maximizing your Airbnb profit potential in Montgomery.
Seasonal Strategies for Maximizing Profit
- Peak Season: Maximize revenue through premium pricing and potentially longer minimum stays. Ensure high availability.
- Low Season: Offer competitive pricing, special promotions (e.g., extended stay discounts), and flexible cancellation policies. Target off-season travelers like remote workers or budget-conscious guests.
- Shoulder Seasons: Implement dynamic pricing that balances peak and low rates. Target weekend travelers or specific events. Offer slightly more flexible terms than peak season.
- Regularly analyze your own performance against these Montgomery seasonality benchmarks and adjust your pricing and availability strategy accordingly.
Best Areas for Airbnb Investment in Montgomery (2026)
Exploring the top neighborhoods for short-term rentals in Montgomery? This section highlights key areas, outlining why they are attractive for hosts and guests, along with notable local attractions. Consider these locations based on your target guest profile and investment strategy.
| Neighborhood / Area | Why Host Here? (Target Guests & Appeal) | Key Attractions & Landmarks |
|---|---|---|
| Downtown Montgomery | The heart of the town, offering a mix of historic charm and modern amenities. Great for those looking to explore local restaurants and shops. | Montgomery Riverwalk, Civil Rights Memorial, Alabama State Capitol, Dexter Avenue King Memorial Baptist Church |
| Lake Edgemere | Ideal for nature lovers and those seeking a relaxing retreat by the water. Popular for boating, fishing, and swimming. | Lake Edgemere, Montgomery Zoo, Blount Cultural Park |
| East Montgomery | Known for its suburban feel and proximity to parks and schools. Attractive to families and those looking for spacious, comfortable stays. | Montgomery Botanical Gardens, East Montgomery Park |
| Old Cloverdale | A historic neighborhood filled with beautiful homes and rich history. Aesthetic charm attracts tourists interested in architecture and local history. | Cloverdale-Idlewild Historic District, Montgomery Museum of Fine Arts, The Cloverdale Playhouse |
| West Montgomery | A growing area with various dining and shopping options. Appeals to travelers looking for convenience and local flavor. | The Shoppes at Eastchase, Brewton Parker College, Montgomery Cultural Arts Center |
| Historic District | Home to many of Montgomery's historical sites. A prime location for history buffs and educational tours. | Dexter Avenue Baptist Church, Southern Poverty Law Center, Alabama Shakespeare Festival |
| Midtown Montgomery | Features a mix of residential areas and local businesses, ideal for guests looking for a more local experience away from the tourist spots. | Fitzgerald Park, Montgomery Museum of Fine Arts, Local restaurants and cafes |
| Gunter AFB Area | Proximity to the air force base makes it popular for military families and personnel visiting the area. A mix of budget and mid-range accommodations available. | Gunter Annex, Air Force Museum, Community parks |
Understanding Airbnb License Requirements & STR Laws in Montgomery (2026)
While Montgomery, Vermont, United States currently shows low STR regulations, specific Airbnb license requirements might still exist or change. Always verify the latest short term rental regulations and Airbnb license requirements directly with local government authorities for Montgomery to ensure full compliance before hosting.
(Source: AirROI data, 2026, based on 3% licensed listings)
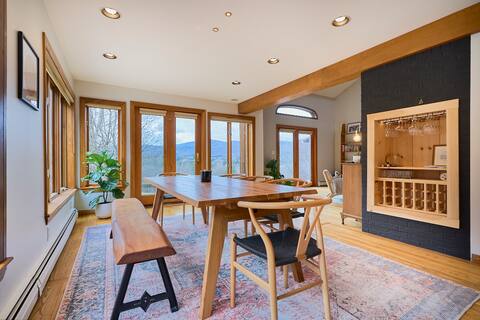
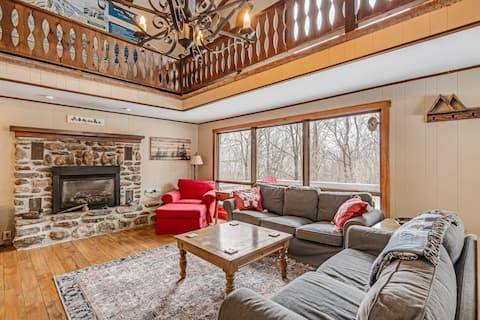
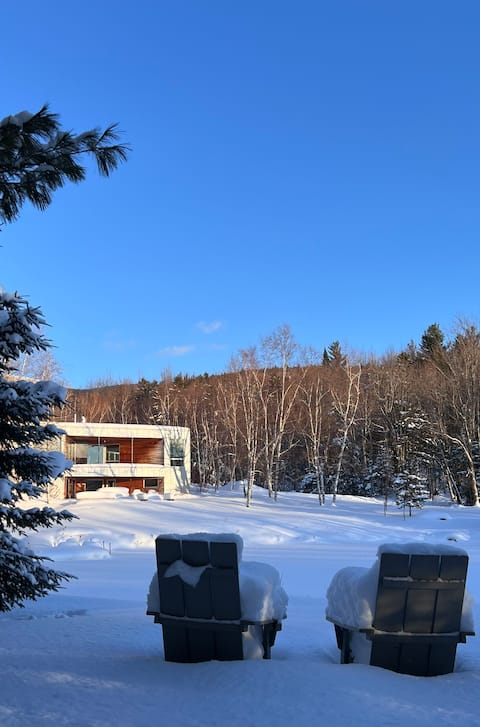
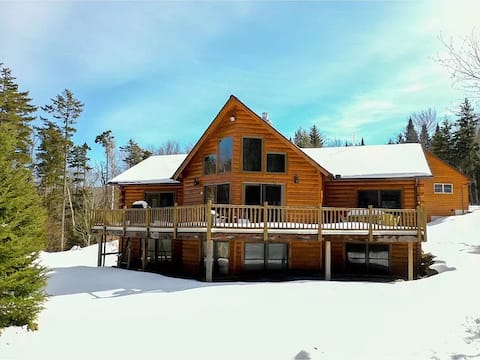
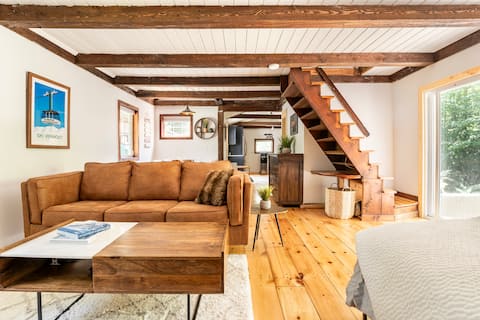
Top Performing Airbnb Properties in Montgomery (2026)
Benchmark your potential! Explore examples of top-performing Airbnb properties in Montgomerybased on Trailing Twelve Month (TTM) revenue. Analyze their characteristics, revenue, occupancy rate, and ADR to understand what drives success in this market.
Serene Mountain Cabin with Private Pond & Hot Tub
Entire Place • 4 bedrooms
The Chalet Getaway, 3 Baths, 5 Bedrooms, 12 Beds
Entire Place • 5 bedrooms
Burnt Mountain: modern getaway near Jay Peak
Entire Place • 4 bedrooms
Private Log Cabin Chalet Near Jay on 14 Acres
Entire Place • 3 bedrooms

Private Home w/ Hot Tub Near Jay Peak Slopes
Entire Place • 4 bedrooms
Jay Peak Retreat
Entire Place • 1 bedroom
Note: Performance varies based on location, size, amenities, seasonality, and management quality. Data reflects the past 12 months.
Top Performing Airbnb Hosts in Montgomery (2026)
Learn from the best! This table showcases top-performing Airbnb hosts in Montgomery based on the number of properties managed and estimated total revenue over the past year. Analyze their scale and performance metrics.
| Host Name | Properties | Grossing Revenue | Stay Reviews | Avg Rating |
|---|---|---|---|---|
| Darren & Lynne | 9 | $150,358 | 67 | 4.96/5.0 |
| Daniel & Kristin | 6 | $128,846 | 526 | 4.93/5.0 |
| Evolve | 3 | $118,796 | 54 | 4.94/5.0 |
| John & Rose | 1 | $110,477 | 145 | 4.99/5.0 |
| Delbert Dean | 1 | $92,700 | 36 | 5.00/5.0 |
| Sarita | 3 | $85,281 | 211 | 4.90/5.0 |
| Kate And Rory | 4 | $80,543 | 504 | 4.87/5.0 |
| Duncan | 1 | $77,753 | 16 | 4.94/5.0 |
| Nicholas | 2 | $68,434 | 672 | 4.99/5.0 |
| Kevin | 1 | $68,135 | 86 | 4.95/5.0 |
Analyzing the strategies of top hosts, such as their property selection, pricing, and guest communication, can offer valuable lessons for optimizing your own Airbnb operations in Montgomery.
Dive Deeper: Advanced Montgomery STR Market Data (2026)
Ready to unlock more insights? AirROI provides access to advanced metrics and comprehensive Airbnb data for Montgomery. Explore detailed analytics beyond this report to refine your investment strategy, optimize pricing, and maximize your vacation rental profits.
Explore Advanced MetricsMontgomery Short-Term Rental Market Composition (2026): Property & Room Types
Room Type Distribution
Property Type Distribution
Market Composition Insights for Montgomery
- The Montgomery Airbnb market composition is heavily skewed towards Entire Home/Apt listings, which make up 85.2% of the 61 active rentals. This indicates strong guest preference for privacy and space.
- Looking at the property type distribution in Montgomery, House properties are the most common (49.2%), reflecting the local real estate landscape.
- Houses represent a significant 49.2% portion, catering likely to families or larger groups.
- The presence of 8.2% Hotel/Boutique listings indicates integration with traditional hospitality.
Montgomery Airbnb Room Capacity Analysis (2026): Bedroom Distribution
Distribution of Listings by Number of Bedrooms
Room Capacity Insights for Montgomery
- The dominant room capacity in Montgomery is 3 bedrooms listings, making up 31.1% of the market. This suggests a strong demand for properties suitable for families or small groups.
- Together, 3 bedrooms and 1 bedroom properties represent 55.7% of the active Airbnb listings in Montgomery, indicating a high concentration in these sizes.
- A significant 44.2% of listings offer 3+ bedrooms, catering to larger groups and families seeking more space in Montgomery.
Montgomery Vacation Rental Guest Capacity Trends (2026)
Distribution of Listings by Guest Capacity
Guest Capacity Insights for Montgomery
- The most common guest capacity trend in Montgomery vacation rentals is listings accommodating 8+ guests (23%). This suggests the primary traveler segment is likely larger groups.
- Properties designed for 8+ guests and 6 guests dominate the Montgomery STR market, accounting for 46.0% of listings.
- 47.6% of properties accommodate 6+ guests, serving the market segment for larger families or group travel in Montgomery.
- On average, properties in Montgomery are equipped to host 4.8 guests.
Montgomery Airbnb Booking Patterns (2026): Available vs. Booked Days
Available Days Distribution
Booked Days Distribution
Booking Pattern Insights for Montgomery
- The most common availability pattern in Montgomery falls within the 271-366 days range, representing 47.5% of listings. This suggests many properties have significant open periods on their calendars.
- Approximately 83.6% of listings show high availability (181+ days open annually), indicating potential for increased bookings or specific owner usage patterns.
- For booked days, the 31-90 days range is most frequent in Montgomery (37.7%), reflecting common guest stay durations or potential owner blocking patterns.
- A notable 19.6% of properties secure long booking periods (181+ days booked per year), highlighting successful long-term rental strategies or significant owner usage.
Montgomery Airbnb Minimum Stay Requirements Analysis
Distribution of Listings by Minimum Night Requirement
1 Night
16 listings
26.2% of total
2 Nights
19 listings
31.1% of total
3 Nights
4 listings
6.6% of total
30+ Nights
22 listings
36.1% of total
Key Insights
- The most prevalent minimum stay requirement in Montgomery is 30+ Nights, adopted by 36.1% of listings. This highlights the market's preference for longer commitments.
- A significant segment (36.1%) caters to monthly stays (30+ nights) in Montgomery, pointing to opportunities in the extended-stay market.
Recommendations
- Align with the market by considering a 30+ Nights minimum stay, as 36.1% of Montgomery hosts use this setting.
- If feasible, allowing 1-night stays, especially midweek or during low season, could capture last-minute bookings, as only 26.2% currently do.
- Explore offering discounts for stays of 30+ nights to attract the 36.1% of the market seeking extended stays.
- Adjust minimum nights based on seasonality – potentially shorter during low season and longer during peak demand periods in Montgomery.
Montgomery Airbnb Cancellation Policy Trends Analysis (2026)
Super Strict 30 Days
11 listings
18% of total
Flexible
3 listings
4.9% of total
Moderate
10 listings
16.4% of total
Firm
26 listings
42.6% of total
Strict
11 listings
18% of total
Cancellation Policy Insights for Montgomery
- The prevailing Airbnb cancellation policy trend in Montgomery is Firm, used by 42.6% of listings.
- A majority (60.6%) of hosts in Montgomery utilize Firm or Strict policies, indicating a market where hosts prioritize booking security.
Recommendations for Hosts
- Consider adopting a Firm policy to align with the 42.6% market standard in Montgomery.
- Regularly review your cancellation policy against competitors and market demand shifts in Montgomery.
Montgomery STR Booking Lead Time Analysis (2026)
Average Booking Lead Time by Month
Booking Lead Time Insights for Montgomery
- The overall average booking lead time for vacation rentals in Montgomery is 67 days.
- Guests book furthest in advance for stays during June (average 93 days), likely coinciding with peak travel demand or local events.
- The shortest booking windows occur for stays in April (average 32 days), indicating more last-minute travel plans during this time.
- Seasonally, Summer (83 days avg.) sees the longest lead times, while Spring (57 days avg.) has the shortest, reflecting typical travel planning cycles.
Recommendations for Hosts
- Use the overall average lead time (67 days) as a baseline for your pricing and availability strategy in Montgomery.
- For June stays, consider implementing length-of-stay discounts or slightly higher rates for bookings made less than 93 days out to capitalize on advance planning.
- Target marketing efforts for the Summer season well in advance (at least 83 days) to capture early planners.
- Monitor your own booking lead times against these Montgomery averages to identify opportunities for dynamic pricing adjustments.
Popular & Essential Airbnb Amenities in Montgomery (2026)
Amenity Prevalence
Amenity Insights for Montgomery
- Essential amenities in Montgomery that guests expect include: Wifi, Carbon monoxide alarm, TV, Smoke alarm, Free parking on premises, Heating, Fire extinguisher, Hot water. Lacking these (any) could significantly impact bookings.
- Popular amenities like Coffee maker, Essentials are common but not universal. Offering these can provide a competitive edge.
Recommendations for Hosts
- Ensure your listing includes all essential amenities for Montgomery: Wifi, Carbon monoxide alarm, TV, Smoke alarm, Free parking on premises, Heating, Fire extinguisher, Hot water.
- Prioritize adding missing essentials: Carbon monoxide alarm, TV, Smoke alarm, Free parking on premises, Heating, Fire extinguisher, Hot water.
- Consider adding popular differentiators like Coffee maker or Essentials to increase appeal.
- Highlight unique or less common amenities you offer (e.g., hot tub, dedicated workspace, EV charger) in your listing description and photos.
- Regularly check competitor amenities in Montgomery to stay competitive.
Montgomery Airbnb Guest Demographics & Profile Analysis (2026)
Guest Profile Summary for Montgomery
- The typical guest profile for Airbnb in Montgomery consists of primarily domestic travelers (93%), often arriving from nearby Boston, typically belonging to the Post-2000s (Gen Z/Alpha) group (50%), primarily speaking English or French.
- Domestic travelers account for 93.3% of guests.
- Key international markets include United States (93.3%) and Canada (4.8%).
- Top languages spoken are English (71.4%) followed by French (7%).
- A significant demographic segment is the Post-2000s (Gen Z/Alpha) group, representing 50% of guests.
Recommendations for Hosts
- Target domestic marketing efforts towards travelers from Boston and New York.
- Tailor amenities and listing descriptions to appeal to the dominant Post-2000s (Gen Z/Alpha) demographic (e.g., highlight fast WiFi, smart home features, local guides).
- Highlight unique local experiences or amenities relevant to the primary guest profile.
- Consider seasonal promotions aligned with peak travel times for key origin markets.
Nearby Short-Term Rental Market Comparison
How does the Montgomery Airbnb market stack up against its neighbors? Compare key performance metrics like average monthly revenue, ADR, and occupancy rates in surrounding areas to understand the broader regional STR landscape.
| Market | Active Properties | Monthly Revenue | Daily Rate | Avg. Occupancy |
|---|---|---|---|---|
| Middletown Springs | 13 | $6,843 | $507.55 | 32% |
| Pomfret | 15 | $6,549 | $502.74 | 45% |
| Fort Ann | 35 | $6,238 | $790.41 | 37% |
| Hanover | 33 | $5,826 | $1189.51 | 41% |
| Barnstead | 36 | $5,090 | $477.12 | 42% |
| Goffstown | 13 | $5,066 | $343.72 | 53% |
| Malletts Bay | 51 | $4,842 | $444.86 | 41% |
| Town of Wilton | 103 | $4,841 | $862.83 | 38% |
| Jefferson | 28 | $4,793 | $474.72 | 40% |
| Wilmot | 11 | $4,667 | $334.67 | 51% |