Newport Town Airbnb Market Analysis 2026: Short Term Rental Data & Vacation Rental Statistics in Vermont, United States
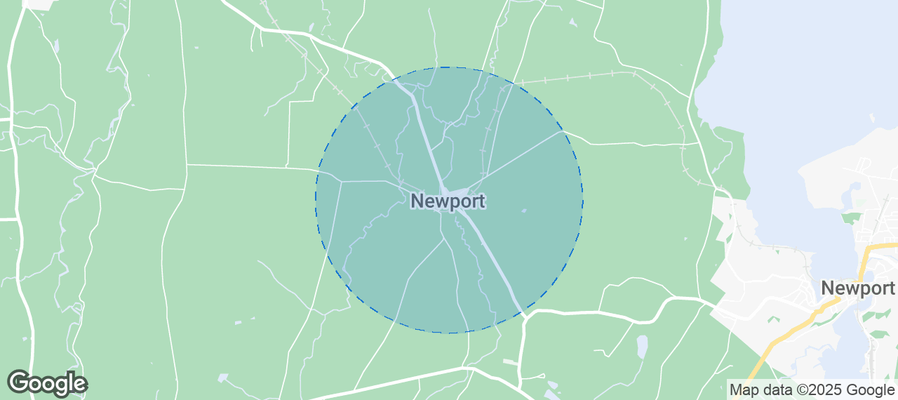
Is Airbnb profitable in Newport Town in 2026? Explore comprehensive Airbnb analytics for Newport Town, Vermont, United States to uncover income potential. This 2026 STR market report for Newport Town, based on AirROI data from January 2025 to December 2025, reveals key trends in the niche market of 19 active listings.
Whether you're considering an Airbnb investment in Newport Town, optimizing your existing vacation rental, or exploring rental arbitrage opportunities, understanding the Newport Town Airbnb data is crucial. Understanding the local regulations is key to maximizing your short term rental income potential. Let's dive into the specifics.
Key Newport Town Airbnb Performance Metrics Overview
Monthly Airbnb Revenue Variations & Income Potential in Newport Town (2026)
Understanding the monthly revenue variations for Airbnb listings in Newport Town is key to maximizing your short term rental income potential. Seasonality significantly impacts earnings. Our analysis, based on data from the past 12 months, shows that the peak revenue month for STRs in Newport Town is typically August, while November often presents the lowest earnings, highlighting opportunities for strategic pricing adjustments during shoulder and low seasons. Explore the typical Airbnb income in Newport Town across different performance tiers:
- Best-in-class properties (Top 10%) achieve $13,090+ monthly, often utilizing dynamic pricing and superior guest experiences.
- Strong performing properties (Top 25%) earn $7,286 or more, indicating effective management and desirable locations/amenities.
- Typical properties (Median) generate around $3,829 per month, representing the average market performance.
- Entry-level properties (Bottom 25%) see earnings around $2,131, often with potential for optimization.
Average Monthly Airbnb Earnings Trend in Newport Town
Newport Town Airbnb Occupancy Rate Trends (2026)
Maximize your bookings by understanding the Newport Town STR occupancy trends. Seasonal demand shifts significantly influence how often properties are booked. Typically, Augustsees the highest demand (peak season occupancy), while September experiences the lowest (low season). Effective strategies, like adjusting minimum stays or offering promotions, can boost occupancy during slower periods. Here's how different property tiers perform in Newport Town:
- Best-in-class properties (Top 10%) achieve 87%+ occupancy, indicating high desirability and potentially optimized availability.
- Strong performing properties (Top 25%) maintain 67% or higher occupancy, suggesting good market fit and guest satisfaction.
- Typical properties (Median) have an occupancy rate around 47%.
- Entry-level properties (Bottom 25%) average 28% occupancy, potentially facing higher vacancy.
Average Monthly Occupancy Rate Trend in Newport Town
Average Daily Rate (ADR) Airbnb Trends in Newport Town (2026)
Effective short term rental pricing strategy in Newport Town involves understanding monthly ADR fluctuations. The Average Daily Rate (ADR) for Airbnb in Newport Town typically peaks in August and dips lowest during April. Leveraging Airbnb dynamic pricing tools or strategies based on this seasonality can significantly boost revenue. Here's a look at the typical nightly rates achieved:
- Best-in-class properties (Top 10%) command rates of $482+ per night, often due to premium features or locations.
- Strong performing properties (Top 25%) achieve nightly rates of $323 or more.
- Typical properties (Median) charge around $238 per night.
- Entry-level properties (Bottom 25%) earn around $160 per night.
Average Daily Rate (ADR) Trend by Month in Newport Town
Get Live Newport Town Market Intelligence 👇
Explore Real-time Analytics
Airbnb Seasonality Analysis & Trends in Newport Town (2025)
Peak Season (August, July, March)
- Revenue averages $7,226 per month
- Occupancy rates average 62.7%
- Daily rates average $293
Shoulder Season
- Revenue averages $5,158 per month
- Occupancy maintains around 45.6%
- Daily rates hold near $284
Low Season (May, June, November)
- Revenue drops to average $3,826 per month
- Occupancy decreases to average 45.0%
- Daily rates adjust to average $275
Seasonality Insights for Newport Town
- The Airbnb seasonality in Newport Town shows highly seasonal trends requiring careful strategy. While the sections above show seasonal averages, it's also insightful to look at the extremes:
- During the high season, the absolute peak month showcases Newport Town's highest earning potential, with monthly revenues capable of climbing to $8,014, occupancy reaching a high of 68.5%, and ADRs peaking at $309.
- Conversely, the slowest single month of the year, typically falling within the low season, marks the market's lowest point. In this month, revenue might dip to $3,261, occupancy could drop to 29.2%, and ADRs may adjust down to $259.
- Understanding both the seasonal averages and these monthly peaks and troughs in revenue, occupancy, and ADR is crucial for maximizing your Airbnb profit potential in Newport Town.
Seasonal Strategies for Maximizing Profit
- Peak Season: Maximize revenue through premium pricing and potentially longer minimum stays. Ensure high availability.
- Low Season: Offer competitive pricing, special promotions (e.g., extended stay discounts), and flexible cancellation policies. Target off-season travelers like remote workers or budget-conscious guests.
- Shoulder Seasons: Implement dynamic pricing that balances peak and low rates. Target weekend travelers or specific events. Offer slightly more flexible terms than peak season.
- Regularly analyze your own performance against these Newport Town seasonality benchmarks and adjust your pricing and availability strategy accordingly.
Best Areas for Airbnb Investment in Newport Town (2026)
Exploring the top neighborhoods for short-term rentals in Newport Town? This section highlights key areas, outlining why they are attractive for hosts and guests, along with notable local attractions. Consider these locations based on your target guest profile and investment strategy.
| Neighborhood / Area | Why Host Here? (Target Guests & Appeal) | Key Attractions & Landmarks |
|---|---|---|
| Newport City Lakefront | A popular area for visitors looking to enjoy the scenic beauty and various water-related activities. Ideal for families and nature enthusiasts with accessible parks and lake activities. | Lake Memphremagog, Newport City Boardwalk, Prouty Beach, North Country Chamber of Commerce, Newport State Park |
| Downtown Newport | The heart of Newport with charming shops, restaurants, and cultural sites. Great for travelers looking to explore local cuisine and attractions while being close to Lake Memphremagog. | Vermont Slate Museum, Newport Historic District, Maple Grove Farms, local art galleries, restaurants and cafes |
| Jay Peak Resort | A great location for winter sports enthusiasts, offering skiing and snowboarding opportunities. This area attracts seasonal tourists looking for outdoor adventures year-round. | Jay Peak Ski Resort, Pump House Indoor Waterpark, Jay Peak Golf Course, Snowshoeing and hiking trails, Vermont's beautiful landscapes |
| East Side Newport | A quieter residential area with beautiful homes and proximity to the lake. Ideal for those seeking a peaceful retreat, with easy access to outdoor activities. | Newport County Fishing Access, local parks, beach access, biking trails, scenic views |
| Barton | A small neighboring town ideal for visitors who want a more rural Vermont experience, known for its quaint atmosphere and proximity to outdoor activities. | Lake Parker, Barton Diner, local farms, hiking trails, community events |
| Graniteville | A historic area with beautiful scenery and a rich cultural background, popular for visitors wanting to explore local history and outdoor activities. | Granite Museum of Vermont, local hiking trails, parks, scenic views, historic sites |
| Derby Line | Bordering Canada, this area provides unique opportunities for international travelers and offers a local taste of Vermont culture with close proximity to the border. | Haskell Free Library, Derby Line Village, local markets, historic architecture, border crossing |
| North Troy | A charming small town that's ideal for nature lovers and those looking to escape city life. Offers a range of outdoor activities and access to the Canadian border. | Missisquoi Valley Rail Trail, local wildlife, quiet parks, hiking opportunities, community events |
Understanding Airbnb License Requirements & STR Laws in Newport Town (2026)
With 11% of listings showing registration in 2026, understanding potential Airbnb license requirements is crucial in Newport Town. Always verify the latest short term rental regulations and Airbnb license requirements directly with local government authorities for Newport Town to ensure full compliance before hosting.
(Source: AirROI data, 2026, based on 11% licensed listings)
Top Performing Airbnb Properties in Newport Town (2026)
Benchmark your potential! Explore examples of top-performing Airbnb properties in Newport Townbased on Trailing Twelve Month (TTM) revenue. Analyze their characteristics, revenue, occupancy rate, and ADR to understand what drives success in this market.
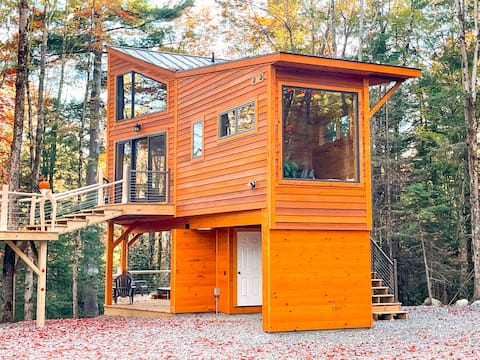
Secluded Luxury Treehouse - Hot Tub + Projector
Entire Place • 1 bedroom
Luxury 5 BR Family Home on Lake Memphremagog
Entire Place • 5 bedrooms

Lakefront Cabin | Boat Dock-Fireplace-Sunset Views
Entire Place • 3 bedrooms

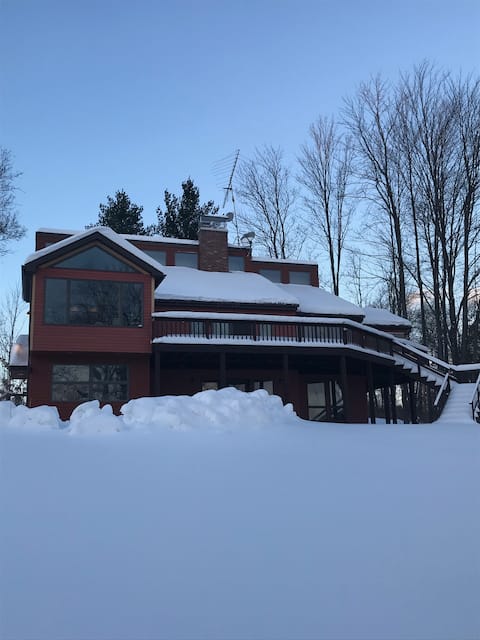
The Country Home - 166 acre estate, Ski, VAST
Entire Place • 6 bedrooms
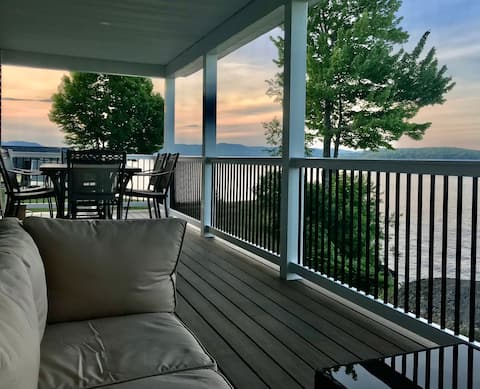
Amazing Lakeshore Home w/Dock; Sleeps 7.
Entire Place • 2 bedrooms
Lake Front/Peaceful retreat but close to town
Entire Place • 3 bedrooms
Note: Performance varies based on location, size, amenities, seasonality, and management quality. Data reflects the past 12 months.
Top Performing Airbnb Hosts in Newport Town (2026)
Learn from the best! This table showcases top-performing Airbnb hosts in Newport Town based on the number of properties managed and estimated total revenue over the past year. Analyze their scale and performance metrics.
| Host Name | Properties | Grossing Revenue | Stay Reviews | Avg Rating |
|---|---|---|---|---|
| Cedar Heights | 1 | $145,223 | 280 | 4.97/5.0 |
| Alison | 1 | $141,739 | 37 | 5.00/5.0 |
| Ally | 1 | $109,104 | 180 | 4.87/5.0 |
| The Country Home | 1 | $101,097 | 32 | 4.97/5.0 |
| Ana And Eric | 2 | $74,005 | 86 | 4.86/5.0 |
| Bradley | 1 | $51,423 | 87 | 4.97/5.0 |
| Nick | 1 | $46,598 | 246 | 4.92/5.0 |
| Sarah | 1 | $40,711 | 81 | 4.96/5.0 |
| April | 1 | $38,002 | 62 | 5.00/5.0 |
| John | 1 | $36,661 | 336 | 4.98/5.0 |
Analyzing the strategies of top hosts, such as their property selection, pricing, and guest communication, can offer valuable lessons for optimizing your own Airbnb operations in Newport Town.
Dive Deeper: Advanced Newport Town STR Market Data (2026)
Ready to unlock more insights? AirROI provides access to advanced metrics and comprehensive Airbnb data for Newport Town. Explore detailed analytics beyond this report to refine your investment strategy, optimize pricing, and maximize your vacation rental profits.
Explore Advanced MetricsNewport Town Short-Term Rental Market Composition (2026): Property & Room Types
Room Type Distribution
Property Type Distribution
Market Composition Insights for Newport Town
- The Newport Town Airbnb market composition is heavily skewed towards Entire Home/Apt listings, which make up 100% of the 19 active rentals. This indicates strong guest preference for privacy and space.
- Looking at the property type distribution in Newport Town, House properties are the most common (57.9%), reflecting the local real estate landscape.
- Houses represent a significant 57.9% portion, catering likely to families or larger groups.
Newport Town Airbnb Room Capacity Analysis (2026): Bedroom Distribution
Distribution of Listings by Number of Bedrooms
Room Capacity Insights for Newport Town
- The dominant room capacity in Newport Town is 2 bedrooms listings, making up 57.9% of the market. This suggests a strong demand for properties suitable for couples or solo travelers.
- Together, 2 bedrooms and 1 bedroom properties represent 68.4% of the active Airbnb listings in Newport Town, indicating a high concentration in these sizes.
- A significant 26.3% of listings offer 3+ bedrooms, catering to larger groups and families seeking more space in Newport Town.
Newport Town Vacation Rental Guest Capacity Trends (2026)
Distribution of Listings by Guest Capacity
Guest Capacity Insights for Newport Town
- The most common guest capacity trend in Newport Town vacation rentals is listings accommodating 4 guests (31.6%). This suggests the primary traveler segment is likely small families or groups.
- Properties designed for 4 guests and 6 guests dominate the Newport Town STR market, accounting for 52.7% of listings.
- 42.1% of properties accommodate 6+ guests, serving the market segment for larger families or group travel in Newport Town.
- On average, properties in Newport Town are equipped to host 4.9 guests.
Newport Town Airbnb Booking Patterns (2026): Available vs. Booked Days
Available Days Distribution
Booked Days Distribution
Booking Pattern Insights for Newport Town
- The most common availability pattern in Newport Town falls within the 271-366 days range, representing 36.8% of listings. This suggests many properties have significant open periods on their calendars.
- Approximately 73.6% of listings show high availability (181+ days open annually), indicating potential for increased bookings or specific owner usage patterns.
- For booked days, the 91-180 days range is most frequent in Newport Town (36.8%), reflecting common guest stay durations or potential owner blocking patterns.
- A notable 26.3% of properties secure long booking periods (181+ days booked per year), highlighting successful long-term rental strategies or significant owner usage.
Newport Town Airbnb Minimum Stay Requirements Analysis
Distribution of Listings by Minimum Night Requirement
1 Night
2 listings
10.5% of total
2 Nights
6 listings
31.6% of total
3 Nights
3 listings
15.8% of total
4-6 Nights
1 listings
5.3% of total
30+ Nights
7 listings
36.8% of total
Key Insights
- The most prevalent minimum stay requirement in Newport Town is 30+ Nights, adopted by 36.8% of listings. This highlights the market's preference for longer commitments.
- A significant segment (36.8%) caters to monthly stays (30+ nights) in Newport Town, pointing to opportunities in the extended-stay market.
Recommendations
- Align with the market by considering a 30+ Nights minimum stay, as 36.8% of Newport Town hosts use this setting.
- If feasible, allowing 1-night stays, especially midweek or during low season, could capture last-minute bookings, as only 10.5% currently do.
- A 2-night minimum appears standard (31.6%). Consider this for weekends or peak periods.
- Explore offering discounts for stays of 30+ nights to attract the 36.8% of the market seeking extended stays.
- Adjust minimum nights based on seasonality – potentially shorter during low season and longer during peak demand periods in Newport Town.
Newport Town Airbnb Cancellation Policy Trends Analysis (2026)
Flexible
4 listings
22.2% of total
Moderate
4 listings
22.2% of total
Firm
10 listings
55.6% of total
Cancellation Policy Insights for Newport Town
- The prevailing Airbnb cancellation policy trend in Newport Town is Firm, used by 55.6% of listings.
- A majority (55.6%) of hosts in Newport Town utilize Firm or Strict policies, indicating a market where hosts prioritize booking security.
Recommendations for Hosts
- Consider adopting a Firm policy to align with the 55.6% market standard in Newport Town.
- Regularly review your cancellation policy against competitors and market demand shifts in Newport Town.
Newport Town STR Booking Lead Time Analysis (2026)
Average Booking Lead Time by Month
Booking Lead Time Insights for Newport Town
- The overall average booking lead time for vacation rentals in Newport Town is 60 days.
- Guests book furthest in advance for stays during July (average 107 days), likely coinciding with peak travel demand or local events.
- The shortest booking windows occur for stays in September (average 39 days), indicating more last-minute travel plans during this time.
- Seasonally, Summer (71 days avg.) sees the longest lead times, while Fall (42 days avg.) has the shortest, reflecting typical travel planning cycles.
Recommendations for Hosts
- Use the overall average lead time (60 days) as a baseline for your pricing and availability strategy in Newport Town.
- For July stays, consider implementing length-of-stay discounts or slightly higher rates for bookings made less than 107 days out to capitalize on advance planning.
- Target marketing efforts for the Summer season well in advance (at least 71 days) to capture early planners.
- Monitor your own booking lead times against these Newport Town averages to identify opportunities for dynamic pricing adjustments.
Popular & Essential Airbnb Amenities in Newport Town (2026)
Amenity Prevalence
Amenity Insights for Newport Town
- Essential amenities in Newport Town that guests expect include: Smoke alarm, Free parking on premises. Lacking these (any) could significantly impact bookings.
- Popular amenities like Carbon monoxide alarm, Kitchen, Cooking basics are common but not universal. Offering these can provide a competitive edge.
Recommendations for Hosts
- Ensure your listing includes all essential amenities for Newport Town: Smoke alarm, Free parking on premises.
- Consider adding popular differentiators like Carbon monoxide alarm or Kitchen to increase appeal.
- Highlight unique or less common amenities you offer (e.g., hot tub, dedicated workspace, EV charger) in your listing description and photos.
- Regularly check competitor amenities in Newport Town to stay competitive.
Newport Town Airbnb Guest Demographics & Profile Analysis (2026)
Guest Profile Summary for Newport Town
- The typical guest profile for Airbnb in Newport Town consists of primarily domestic travelers (95%), often arriving from nearby Boston, typically belonging to the Post-2000s (Gen Z/Alpha) group (50%), primarily speaking English or French.
- Domestic travelers account for 95.3% of guests.
- Key international markets include United States (95.3%) and Canada (1.8%).
- Top languages spoken are English (69.2%) followed by French (9%).
- A significant demographic segment is the Post-2000s (Gen Z/Alpha) group, representing 50% of guests.
Recommendations for Hosts
- Target domestic marketing efforts towards travelers from Boston and Vermont.
- Tailor amenities and listing descriptions to appeal to the dominant Post-2000s (Gen Z/Alpha) demographic (e.g., highlight fast WiFi, smart home features, local guides).
- Highlight unique local experiences or amenities relevant to the primary guest profile.
- Consider seasonal promotions aligned with peak travel times for key origin markets.
Nearby Short-Term Rental Market Comparison
How does the Newport Town Airbnb market stack up against its neighbors? Compare key performance metrics like average monthly revenue, ADR, and occupancy rates in surrounding areas to understand the broader regional STR landscape.
| Market | Active Properties | Monthly Revenue | Daily Rate | Avg. Occupancy |
|---|---|---|---|---|
| Middletown Springs | 13 | $6,936 | $508.13 | 33% |
| Pomfret | 16 | $6,320 | $490.45 | 43% |
| Fort Ann | 35 | $6,210 | $787.58 | 36% |
| Goffstown | 12 | $5,728 | $363.08 | 54% |
| Hanover | 37 | $5,425 | $1084.32 | 39% |
| Barnstead | 37 | $4,849 | $464.28 | 41% |
| Malletts Bay | 52 | $4,831 | $446.30 | 41% |
| Jefferson | 28 | $4,815 | $475.30 | 40% |
| Stowe | 883 | $4,700 | $525.59 | 40% |
| Putnam Station | 13 | $4,648 | $497.00 | 42% |