Westminster Airbnb Market Analysis 2026: Short Term Rental Data & Vacation Rental Statistics in Vermont, United States
Is Airbnb profitable in Westminster in 2026? Explore comprehensive Airbnb analytics for Westminster, Vermont, United States to uncover income potential. This 2026 STR market report for Westminster, based on AirROI data from January 2025 to December 2025, reveals key trends in the niche market of 19 active listings.
Whether you're considering an Airbnb investment in Westminster, optimizing your existing vacation rental, or exploring rental arbitrage opportunities, understanding the Westminster Airbnb data is crucial. Understanding the local regulations is key to maximizing your short term rental income potential. Let's dive into the specifics.
Key Westminster Airbnb Performance Metrics Overview
Monthly Airbnb Revenue Variations & Income Potential in Westminster (2026)
Understanding the monthly revenue variations for Airbnb listings in Westminster is key to maximizing your short term rental income potential. Seasonality significantly impacts earnings. Our analysis, based on data from the past 12 months, shows that the peak revenue month for STRs in Westminster is typically October, while April often presents the lowest earnings, highlighting opportunities for strategic pricing adjustments during shoulder and low seasons. Explore the typical Airbnb income in Westminster across different performance tiers:
- Best-in-class properties (Top 10%) achieve $5,865+ monthly, often utilizing dynamic pricing and superior guest experiences.
- Strong performing properties (Top 25%) earn $3,995 or more, indicating effective management and desirable locations/amenities.
- Typical properties (Median) generate around $2,618 per month, representing the average market performance.
- Entry-level properties (Bottom 25%) see earnings around $1,493, often with potential for optimization.
Average Monthly Airbnb Earnings Trend in Westminster
Westminster Airbnb Occupancy Rate Trends (2026)
Maximize your bookings by understanding the Westminster STR occupancy trends. Seasonal demand shifts significantly influence how often properties are booked. Typically, Octobersees the highest demand (peak season occupancy), while November experiences the lowest (low season). Effective strategies, like adjusting minimum stays or offering promotions, can boost occupancy during slower periods. Here's how different property tiers perform in Westminster:
- Best-in-class properties (Top 10%) achieve 83%+ occupancy, indicating high desirability and potentially optimized availability.
- Strong performing properties (Top 25%) maintain 69% or higher occupancy, suggesting good market fit and guest satisfaction.
- Typical properties (Median) have an occupancy rate around 51%.
- Entry-level properties (Bottom 25%) average 27% occupancy, potentially facing higher vacancy.
Average Monthly Occupancy Rate Trend in Westminster
Average Daily Rate (ADR) Airbnb Trends in Westminster (2026)
Effective short term rental pricing strategy in Westminster involves understanding monthly ADR fluctuations. The Average Daily Rate (ADR) for Airbnb in Westminster typically peaks in June and dips lowest during August. Leveraging Airbnb dynamic pricing tools or strategies based on this seasonality can significantly boost revenue. Here's a look at the typical nightly rates achieved:
- Best-in-class properties (Top 10%) command rates of $327+ per night, often due to premium features or locations.
- Strong performing properties (Top 25%) achieve nightly rates of $229 or more.
- Typical properties (Median) charge around $158 per night.
- Entry-level properties (Bottom 25%) earn around $124 per night.
Average Daily Rate (ADR) Trend by Month in Westminster
Get Live Westminster Market Intelligence 👇

Explore Real-time Analytics
Airbnb Seasonality Analysis & Trends in Westminster (2025)
Peak Season (October, July, August)
- Revenue averages $3,895 per month
- Occupancy rates average 59.8%
- Daily rates average $190
Shoulder Season
- Revenue averages $2,896 per month
- Occupancy maintains around 48.6%
- Daily rates hold near $190
Low Season (March, April, November)
- Revenue drops to average $2,334 per month
- Occupancy decreases to average 42.4%
- Daily rates adjust to average $184
Seasonality Insights for Westminster
- The Airbnb seasonality in Westminster shows moderate seasonality with distinct peak and low periods. While the sections above show seasonal averages, it's also insightful to look at the extremes:
- During the high season, the absolute peak month showcases Westminster's highest earning potential, with monthly revenues capable of climbing to $4,134, occupancy reaching a high of 62.7%, and ADRs peaking at $202.
- Conversely, the slowest single month of the year, typically falling within the low season, marks the market's lowest point. In this month, revenue might dip to $2,066, occupancy could drop to 38.3%, and ADRs may adjust down to $180.
- Understanding both the seasonal averages and these monthly peaks and troughs in revenue, occupancy, and ADR is crucial for maximizing your Airbnb profit potential in Westminster.
Seasonal Strategies for Maximizing Profit
- Peak Season: Maximize revenue through premium pricing and potentially longer minimum stays. Ensure high availability.
- Low Season: Offer competitive pricing, special promotions (e.g., extended stay discounts), and flexible cancellation policies. Target off-season travelers like remote workers or budget-conscious guests.
- Shoulder Seasons: Implement dynamic pricing that balances peak and low rates. Target weekend travelers or specific events. Offer slightly more flexible terms than peak season.
- Regularly analyze your own performance against these Westminster seasonality benchmarks and adjust your pricing and availability strategy accordingly.
Best Areas for Airbnb Investment in Westminster (2026)
Exploring the top neighborhoods for short-term rentals in Westminster? This section highlights key areas, outlining why they are attractive for hosts and guests, along with notable local attractions. Consider these locations based on your target guest profile and investment strategy.
| Neighborhood / Area | Why Host Here? (Target Guests & Appeal) | Key Attractions & Landmarks |
|---|---|---|
| Westminster Village | Charming village atmosphere with a rich history and picturesque New England scenery. Ideal for tourists seeking a peaceful retreat in Vermont's beautiful countryside, with easy access to local shops and dining. | The Old Bell Tavern, Westminster Historical Society, local artisan shops, Scenic hiking trails, Fishing in local rivers |
| North Westminster | A quiet area surrounded by nature, perfect for outdoor enthusiasts. It provides a serene environment for guests looking to escape the hustle and bustle of city life. | Westminster Pond, Hiking trails in nearby forests, Wildlife observation, Kayaking opportunities, Close proximity to Okemo Mountain Resort |
| Westminster West | This area features a blend of rural charm and modern amenities, attracting families and couples looking for a relaxing getaway with options for local activities. | Westminster West Grange, Local farm tours, Cycling routes, Scenic picnic spots, Craft fairs and farmer's markets |
| Browns Hill | A scenic spot that offers stunning views and access to outdoor adventures. Perfect for guests who appreciate the beauty of nature and want to explore the Green Mountains. | Browns Hill Trail, Nearby ski resorts, Vermont Country Store, Local breweries, Scenic drives |
| Putney Mountain | A more secluded area that appeals to those looking for tranquility and nature. It’s ideal for hiking lovers and offers a connection to Vermont’s natural beauty. | Putney Mountain trails, Nature observatories, Annual local festivals, Art galleries showcasing local artists, Vermont's scenic byways |
| West River | Located along the river, this area offers fishing, kayaking, and beautiful sunsets. It’s attractive for guests who love water activities and nature. | West River Trail, Kayaking on the West River, Fishing spots, Scenic river views, Picnic areas along the riverbank |
| Old Westminster | Rich in history and cultural significance, this area attracts those interested in Vermont's past and local heritage. It is a great base for exploring historical sites. | Historic landmarks, Local museums, Antique shops, Cultural events and fairs, Walking tours of historic sites |
| Clear Lake | A picturesque area with a great lake, it's perfect for summer getaways, swimming, and enjoying the serene environment with family and friends. | Clear Lake, Boating and swimming, Camping sites, Nature trails, Wildlife watching opportunities |
Understanding Airbnb License Requirements & STR Laws in Westminster (2026)
With 16% of listings showing registration in 2026, understanding potential Airbnb license requirements is crucial in Westminster. Always verify the latest short term rental regulations and Airbnb license requirements directly with local government authorities for Westminster to ensure full compliance before hosting.
(Source: AirROI data, 2026, based on 16% licensed listings)
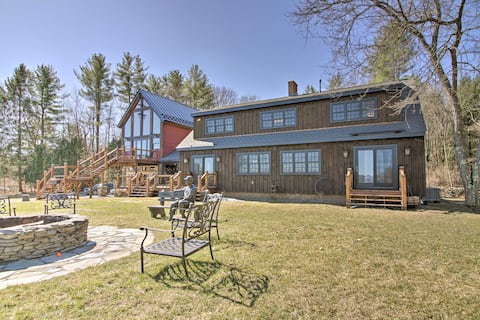
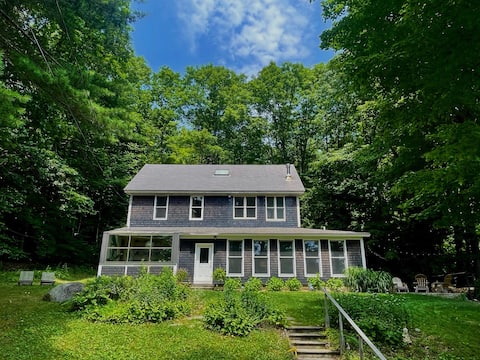
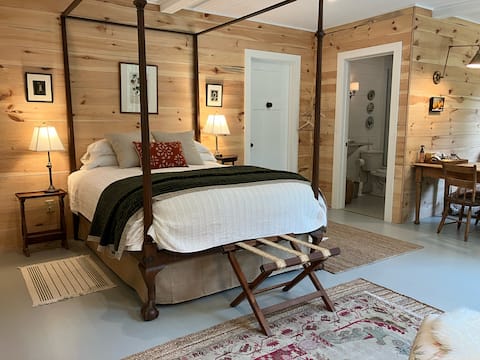
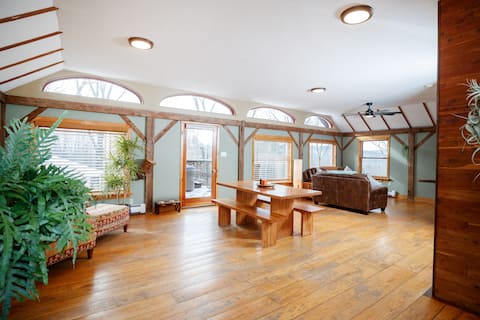
Top Performing Airbnb Properties in Westminster (2026)
Benchmark your potential! Explore examples of top-performing Airbnb properties in Westminsterbased on Trailing Twelve Month (TTM) revenue. Analyze their characteristics, revenue, occupancy rate, and ADR to understand what drives success in this market.
Timeless Red Sox Retreat w/ Scenic Mountain Views!
Entire Place • 4 bedrooms
Charming 4-bedroom house
Entire Place • 4 bedrooms
Lovely Studio in Putney
Entire Place • 1 bedroom
Spacious Loft with View
Entire Place • 1 bedroom
Cabin getaway in Southern Vermont
Entire Place • 1 bedroom
'Red Sweetheart Barn Studio' w/ Mtn & River Views!
Entire Place • N/A
Note: Performance varies based on location, size, amenities, seasonality, and management quality. Data reflects the past 12 months.
Top Performing Airbnb Hosts in Westminster (2026)
Learn from the best! This table showcases top-performing Airbnb hosts in Westminster based on the number of properties managed and estimated total revenue over the past year. Analyze their scale and performance metrics.
| Host Name | Properties | Grossing Revenue | Stay Reviews | Avg Rating |
|---|---|---|---|---|
| Evolve | 2 | $118,867 | 176 | 4.88/5.0 |
| Nicholas | 3 | $96,089 | 498 | 4.91/5.0 |
| Jeremy | 1 | $66,351 | 17 | 4.82/5.0 |
| Julia | 1 | $58,723 | 59 | 5.00/5.0 |
| Alex | 1 | $29,374 | 360 | 4.95/5.0 |
| Sol | 1 | $26,995 | 357 | 4.98/5.0 |
| Oliver | 1 | $26,952 | 424 | 4.93/5.0 |
| Sarah | 2 | $26,828 | 72 | 4.93/5.0 |
| Laura | 1 | $19,799 | 122 | 4.93/5.0 |
| Kathryn M | 1 | $17,543 | 60 | 4.97/5.0 |
Analyzing the strategies of top hosts, such as their property selection, pricing, and guest communication, can offer valuable lessons for optimizing your own Airbnb operations in Westminster.
Dive Deeper: Advanced Westminster STR Market Data (2026)
Ready to unlock more insights? AirROI provides access to advanced metrics and comprehensive Airbnb data for Westminster. Explore detailed analytics beyond this report to refine your investment strategy, optimize pricing, and maximize your vacation rental profits.
Explore Advanced MetricsWestminster Short-Term Rental Market Composition (2026): Property & Room Types
Room Type Distribution
Property Type Distribution
Market Composition Insights for Westminster
- The Westminster Airbnb market composition is heavily skewed towards Entire Home/Apt listings, which make up 100% of the 19 active rentals. This indicates strong guest preference for privacy and space.
- Looking at the property type distribution in Westminster, House properties are the most common (42.1%), reflecting the local real estate landscape.
- Houses represent a significant 42.1% portion, catering likely to families or larger groups.
- The presence of 10.5% Hotel/Boutique listings indicates integration with traditional hospitality.
Westminster Airbnb Room Capacity Analysis (2026): Bedroom Distribution
Distribution of Listings by Number of Bedrooms
Room Capacity Insights for Westminster
- The dominant room capacity in Westminster is 1 bedroom listings, making up 57.9% of the market. This suggests a strong demand for properties suitable for couples or solo travelers.
- Together, 1 bedroom and 2 bedrooms properties represent 73.7% of the active Airbnb listings in Westminster, indicating a high concentration in these sizes.
- With over half the market (57.9%) consisting of studios or 1-bedroom units, Westminster is particularly well-suited for individuals or couples.
Westminster Vacation Rental Guest Capacity Trends (2026)
Distribution of Listings by Guest Capacity
Guest Capacity Insights for Westminster
- The most common guest capacity trend in Westminster vacation rentals is listings accommodating 4 guests (36.8%). This suggests the primary traveler segment is likely small families or groups.
- Properties designed for 4 guests and 2 guests dominate the Westminster STR market, accounting for 73.6% of listings.
- 10.5% of properties accommodate 6+ guests, serving the market segment for larger families or group travel in Westminster.
- On average, properties in Westminster are equipped to host 3.5 guests.
Westminster Airbnb Booking Patterns (2026): Available vs. Booked Days
Available Days Distribution
Booked Days Distribution
Booking Pattern Insights for Westminster
- The most common availability pattern in Westminster falls within the 91-180 days range, representing 31.6% of listings. This suggests many properties have significant open periods on their calendars.
- Approximately 57.9% of listings show high availability (181+ days open annually), indicating potential for increased bookings or specific owner usage patterns.
- For booked days, the 91-180 days range is most frequent in Westminster (31.6%), reflecting common guest stay durations or potential owner blocking patterns.
- A notable 42.1% of properties secure long booking periods (181+ days booked per year), highlighting successful long-term rental strategies or significant owner usage.
Westminster Airbnb Minimum Stay Requirements Analysis
Distribution of Listings by Minimum Night Requirement
1 Night
4 listings
21.1% of total
2 Nights
8 listings
42.1% of total
3 Nights
1 listings
5.3% of total
4-6 Nights
1 listings
5.3% of total
7-29 Nights
1 listings
5.3% of total
30+ Nights
4 listings
21.1% of total
Key Insights
- The most prevalent minimum stay requirement in Westminster is 2 Nights, adopted by 42.1% of listings. This highlights the market's preference for shorter, flexible bookings.
- A strong majority (63.2%) of the Westminster Airbnb data shows acceptance of very short stays (1-2 nights), indicating a dynamic, high-turnover market.
- A significant segment (21.1%) caters to monthly stays (30+ nights) in Westminster, pointing to opportunities in the extended-stay market.
Recommendations
- Align with the market by considering a 2 Nights minimum stay, as 42.1% of Westminster hosts use this setting.
- If feasible, allowing 1-night stays, especially midweek or during low season, could capture last-minute bookings, as only 21.1% currently do.
- Explore offering discounts for stays of 30+ nights to attract the 21.1% of the market seeking extended stays.
- Adjust minimum nights based on seasonality – potentially shorter during low season and longer during peak demand periods in Westminster.
Westminster Airbnb Cancellation Policy Trends Analysis (2026)
Flexible
11 listings
57.9% of total
Moderate
3 listings
15.8% of total
Firm
2 listings
10.5% of total
Strict
3 listings
15.8% of total
Cancellation Policy Insights for Westminster
- The prevailing Airbnb cancellation policy trend in Westminster is Flexible, used by 57.9% of listings.
- The market strongly favors guest-friendly terms, with 73.7% of listings offering Flexible or Moderate policies. This suggests guests in Westminster may expect booking flexibility.
Recommendations for Hosts
- Consider adopting a Flexible policy to align with the 57.9% market standard in Westminster.
- Given the high prevalence of Flexible policies (57.9%), offering this can enhance booking appeal, especially during shoulder seasons.
- Regularly review your cancellation policy against competitors and market demand shifts in Westminster.
Westminster STR Booking Lead Time Analysis (2026)
Average Booking Lead Time by Month
Booking Lead Time Insights for Westminster
- The overall average booking lead time for vacation rentals in Westminster is 53 days.
- Guests book furthest in advance for stays during October (average 74 days), likely coinciding with peak travel demand or local events.
- The shortest booking windows occur for stays in March (average 27 days), indicating more last-minute travel plans during this time.
- Seasonally, Fall (55 days avg.) sees the longest lead times, while Spring (39 days avg.) has the shortest, reflecting typical travel planning cycles.
Recommendations for Hosts
- Use the overall average lead time (53 days) as a baseline for your pricing and availability strategy in Westminster.
- For October stays, consider implementing length-of-stay discounts or slightly higher rates for bookings made less than 74 days out to capitalize on advance planning.
- Target marketing efforts for the Fall season well in advance (at least 55 days) to capture early planners.
- Monitor your own booking lead times against these Westminster averages to identify opportunities for dynamic pricing adjustments.
Popular & Essential Airbnb Amenities in Westminster (2026)
Amenity Prevalence
Amenity Insights for Westminster
- Essential amenities in Westminster that guests expect include: Heating, Dishes and silverware, Kitchen, Free parking on premises, Wifi. Lacking these (any) could significantly impact bookings.
- Popular amenities like Coffee maker, Hot water, Fire extinguisher are common but not universal. Offering these can provide a competitive edge.
Recommendations for Hosts
- Ensure your listing includes all essential amenities for Westminster: Heating, Dishes and silverware, Kitchen, Free parking on premises, Wifi.
- Consider adding popular differentiators like Coffee maker or Hot water to increase appeal.
- Highlight unique or less common amenities you offer (e.g., hot tub, dedicated workspace, EV charger) in your listing description and photos.
- Regularly check competitor amenities in Westminster to stay competitive.
Westminster Airbnb Guest Demographics & Profile Analysis (2026)
Guest Profile Summary for Westminster
- The typical guest profile for Airbnb in Westminster consists of primarily domestic travelers (97%), often arriving from nearby New York, typically belonging to the Post-2000s (Gen Z/Alpha) group (50%), primarily speaking English or Spanish.
- Domestic travelers account for 97.3% of guests.
- Key international markets include United States (97.3%) and Canada (0.9%).
- Top languages spoken are English (66.4%) followed by Spanish (10.3%).
- A significant demographic segment is the Post-2000s (Gen Z/Alpha) group, representing 50% of guests.
Recommendations for Hosts
- Target domestic marketing efforts towards travelers from New York and Boston.
- Tailor amenities and listing descriptions to appeal to the dominant Post-2000s (Gen Z/Alpha) demographic (e.g., highlight fast WiFi, smart home features, local guides).
- Highlight unique local experiences or amenities relevant to the primary guest profile.
- Consider seasonal promotions aligned with peak travel times for key origin markets.
Nearby Short-Term Rental Market Comparison
How does the Westminster Airbnb market stack up against its neighbors? Compare key performance metrics like average monthly revenue, ADR, and occupancy rates in surrounding areas to understand the broader regional STR landscape.
| Market | Active Properties | Monthly Revenue | Daily Rate | Avg. Occupancy |
|---|---|---|---|---|
| Middletown Springs | 13 | $6,936 | $508.13 | 33% |
| Pomfret | 16 | $6,320 | $490.45 | 43% |
| Fort Ann | 35 | $6,210 | $787.58 | 36% |
| Town of Ancram | 22 | $5,803 | $518.47 | 38% |
| North Andover | 12 | $5,789 | $446.83 | 45% |
| Goffstown | 12 | $5,728 | $363.08 | 54% |
| Hanover | 37 | $5,425 | $1084.32 | 39% |
| Wellesley | 21 | $5,410 | $541.29 | 51% |
| Town of Stillwater | 56 | $5,185 | $561.38 | 41% |
| Monterey | 41 | $5,173 | $471.53 | 44% |