Sutton Airbnb Market Analysis 2026: Short Term Rental Data & Vacation Rental Statistics in West Virginia, United States
Is Airbnb profitable in Sutton in 2026? Explore comprehensive Airbnb analytics for Sutton, West Virginia, United States to uncover income potential. This 2026 STR market report for Sutton, based on AirROI data from February 2025 to January 2026, reveals key trends in the niche market of 21 active listings.
Whether you're considering an Airbnb investment in Sutton, optimizing your existing vacation rental, or exploring rental arbitrage opportunities, understanding the Sutton Airbnb data is crucial. Leveraging the low regulation environment is key to maximizing your short term rental income potential. Let's dive into the specifics.
Key Sutton Airbnb Performance Metrics Overview
Monthly Airbnb Revenue Variations & Income Potential in Sutton (2026)
Understanding the monthly revenue variations for Airbnb listings in Sutton is key to maximizing your short term rental income potential. Seasonality significantly impacts earnings. Our analysis, based on data from the past 12 months, shows that the peak revenue month for STRs in Sutton is typically May, while January often presents the lowest earnings, highlighting opportunities for strategic pricing adjustments during shoulder and low seasons. Explore the typical Airbnb income in Sutton across different performance tiers:
- Best-in-class properties (Top 10%) achieve $3,508+ monthly, often utilizing dynamic pricing and superior guest experiences.
- Strong performing properties (Top 25%) earn $1,742 or more, indicating effective management and desirable locations/amenities.
- Typical properties (Median) generate around $839 per month, representing the average market performance.
- Entry-level properties (Bottom 25%) see earnings around $409, often with potential for optimization.
Average Monthly Airbnb Earnings Trend in Sutton
Sutton Airbnb Occupancy Rate Trends (2026)
Maximize your bookings by understanding the Sutton STR occupancy trends. Seasonal demand shifts significantly influence how often properties are booked. Typically, Maysees the highest demand (peak season occupancy), while January experiences the lowest (low season). Effective strategies, like adjusting minimum stays or offering promotions, can boost occupancy during slower periods. Here's how different property tiers perform in Sutton:
- Best-in-class properties (Top 10%) achieve 64%+ occupancy, indicating high desirability and potentially optimized availability.
- Strong performing properties (Top 25%) maintain 47% or higher occupancy, suggesting good market fit and guest satisfaction.
- Typical properties (Median) have an occupancy rate around 21%.
- Entry-level properties (Bottom 25%) average 9% occupancy, potentially facing higher vacancy.
Average Monthly Occupancy Rate Trend in Sutton
Average Daily Rate (ADR) Airbnb Trends in Sutton (2026)
Effective short term rental pricing strategy in Sutton involves understanding monthly ADR fluctuations. The Average Daily Rate (ADR) for Airbnb in Sutton typically peaks in June and dips lowest during December. Leveraging Airbnb dynamic pricing tools or strategies based on this seasonality can significantly boost revenue. Here's a look at the typical nightly rates achieved:
- Best-in-class properties (Top 10%) command rates of $218+ per night, often due to premium features or locations.
- Strong performing properties (Top 25%) achieve nightly rates of $170 or more.
- Typical properties (Median) charge around $139 per night.
- Entry-level properties (Bottom 25%) earn around $126 per night.
Average Daily Rate (ADR) Trend by Month in Sutton
Get Live Sutton Market Intelligence 👇

Explore Real-time Analytics
Airbnb Seasonality Analysis & Trends in Sutton (2026)
Peak Season (May, April, October)
- Revenue averages $1,842 per month
- Occupancy rates average 33.5%
- Daily rates average $155
Shoulder Season
- Revenue averages $1,418 per month
- Occupancy maintains around 32.7%
- Daily rates hold near $154
Low Season (January, July, December)
- Revenue drops to average $801 per month
- Occupancy decreases to average 19.9%
- Daily rates adjust to average $140
Seasonality Insights for Sutton
- The Airbnb seasonality in Sutton shows highly seasonal trends requiring careful strategy. While the sections above show seasonal averages, it's also insightful to look at the extremes:
- During the high season, the absolute peak month showcases Sutton's highest earning potential, with monthly revenues capable of climbing to $2,221, occupancy reaching a high of 41.0%, and ADRs peaking at $164.
- Conversely, the slowest single month of the year, typically falling within the low season, marks the market's lowest point. In this month, revenue might dip to $568, occupancy could drop to 17.4%, and ADRs may adjust down to $129.
- Understanding both the seasonal averages and these monthly peaks and troughs in revenue, occupancy, and ADR is crucial for maximizing your Airbnb profit potential in Sutton.
Seasonal Strategies for Maximizing Profit
- Peak Season: Maximize revenue through premium pricing and potentially longer minimum stays. Ensure high availability.
- Low Season: Offer competitive pricing, special promotions (e.g., extended stay discounts), and flexible cancellation policies. Target off-season travelers like remote workers or budget-conscious guests.
- Shoulder Seasons: Implement dynamic pricing that balances peak and low rates. Target weekend travelers or specific events. Offer slightly more flexible terms than peak season.
- Regularly analyze your own performance against these Sutton seasonality benchmarks and adjust your pricing and availability strategy accordingly.
Best Areas for Airbnb Investment in Sutton (2026)
Exploring the top neighborhoods for short-term rentals in Sutton? This section highlights key areas, outlining why they are attractive for hosts and guests, along with notable local attractions. Consider these locations based on your target guest profile and investment strategy.
| Neighborhood / Area | Why Host Here? (Target Guests & Appeal) | Key Attractions & Landmarks |
|---|---|---|
| Sutton Lake | A beautiful and serene lakeside area attracting vacationers for fishing, boating, and enjoying nature. Ideal for families and couples looking for a peaceful getaway. | Sutton Lake, Sutton Lake Marina, Bulltown Historic Area, Holly River State Park, Sutton Historic District |
| Flatwoods | Home to the Flatwoods Factory Outlet Mall, this area draws shoppers and travelers alike. It's a perfect spot for those looking to combine shopping and stay in a cozy environment. | Flatwoods Factory Outlet Mall, Sutton Lake, Holly River State Park, Little Kanawha River, Flatwoods Community Park |
| Birch River | A quaint community known for its outdoor recreational activities, it’s great for those who enjoy hiking, fishing, and disconnecting from city life. | Birch River Park, Hiking Trails, Fishing Areas, Local Eateries, Rural Attractions |
| Braxton County | The entire county offers a variety of outdoor experiences, making it an attractive destination for adventure seekers and nature lovers throughout the year. | Sutton Lake, Sutton State Park, Concord University, Holly River State Park, Historic Sites |
| Sutton Historic District | Rich in history, this area boasts charming architecture and historical landmarks, making it appealing for history buffs and tourists alike. | Historic Buildings, Local Museums, Community Events, Theatres, Art Galleries |
| Little Birch | Peaceful rural area that's perfect for retreats and those looking to escape city life. Great for nature lovers and families. | Nature Trails, Riverside Parks, Scenic Views, Local Farms, Wildlife Watching |
| Gauley Bridge | Known for white-water rafting and outdoor sports, it's a hotspot for adventure tourism. Perfect for outdoor enthusiasts and thrill-seekers. | New River Gorge, White Water Rafting, Hiking Trails, Gauley River, Tourist Outfitters |
| Elk River | A stunning river location that’s perfect for weekend getaways, offering activities such as fishing, kayaking, and scenic views throughout the year. | Elk River Falls, Kayaking Spots, Fishing Areas, Picnic Locations, Campgrounds |
Understanding Airbnb License Requirements & STR Laws in Sutton (2026)
While Sutton, West Virginia, United States currently shows low STR regulations, specific Airbnb license requirements might still exist or change. Always verify the latest short term rental regulations and Airbnb license requirements directly with local government authorities for Sutton to ensure full compliance before hosting.
(Source: AirROI data, 2026, finding no licensed listings among those analyzed)
Top Performing Airbnb Properties in Sutton (2026)
Benchmark your potential! Explore examples of top-performing Airbnb properties in Suttonbased on Trailing Twelve Month (TTM) revenue. Analyze their characteristics, revenue, occupancy rate, and ADR to understand what drives success in this market.
Elk Lodge
Entire Place • 5 bedrooms

Glamping Dome - Chestnut w/ 2 queen beds
Private Room • 1 bedroom

The Murphy
Entire Place • 4 bedrooms

Newly build cabin, 2 bedrooms
Entire Place • 2 bedrooms
entire cabin 1 bedroom
Entire Place • 1 bedroom

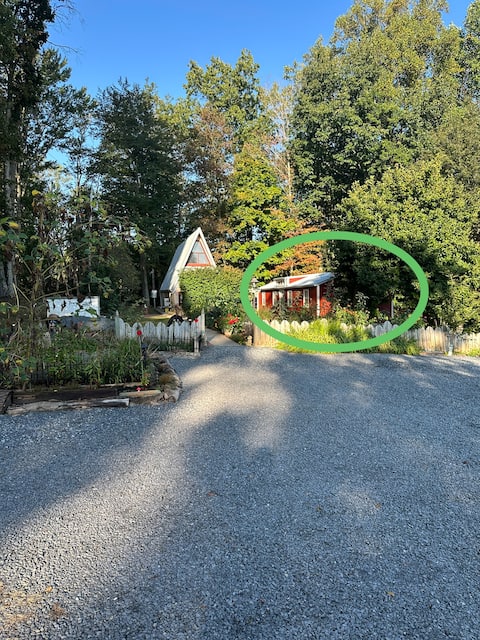
Old A-Frame Cabin, 1 bedroom
Entire Place • 1 bedroom
Note: Performance varies based on location, size, amenities, seasonality, and management quality. Data reflects the past 12 months.
Top Performing Airbnb Hosts in Sutton (2026)
Learn from the best! This table showcases top-performing Airbnb hosts in Sutton based on the number of properties managed and estimated total revenue over the past year. Analyze their scale and performance metrics.
| Host Name | Properties | Grossing Revenue | Stay Reviews | Avg Rating |
|---|---|---|---|---|
| Elkriver | 13 | $93,391 | 80 | 4.60/5.0 |
| Trang | 6 | $75,979 | 189 | 4.87/5.0 |
| Brian | 1 | $25,339 | 8 | 5.00/5.0 |
| Andrew | 1 | $5,973 | 9 | 5.00/5.0 |
Analyzing the strategies of top hosts, such as their property selection, pricing, and guest communication, can offer valuable lessons for optimizing your own Airbnb operations in Sutton.
Dive Deeper: Advanced Sutton STR Market Data (2026)
Ready to unlock more insights? AirROI provides access to advanced metrics and comprehensive Airbnb data for Sutton. Explore detailed analytics beyond this report to refine your investment strategy, optimize pricing, and maximize your vacation rental profits.
Explore Advanced MetricsSutton Short-Term Rental Market Composition (2026): Property & Room Types
Room Type Distribution
Property Type Distribution
Market Composition Insights for Sutton
- The Sutton Airbnb market composition is heavily skewed towards Private Room listings, which make up 57.1% of the 21 active rentals. This indicates strong guest preference for privacy and space.
- Looking at the property type distribution in Sutton, Hotel/Boutique properties are the most common (52.4%), reflecting the local real estate landscape.
- Houses represent a significant 19% portion, catering likely to families or larger groups.
- The presence of 52.4% Hotel/Boutique listings indicates integration with traditional hospitality.
- Smaller segments like apartment/condo (combined 4.8%) offer potential for unique stay experiences.
Sutton Airbnb Room Capacity Analysis (2026): Bedroom Distribution
Distribution of Listings by Number of Bedrooms
Room Capacity Insights for Sutton
- The dominant room capacity in Sutton is 1 bedroom listings, making up 61.9% of the market. This suggests a strong demand for properties suitable for couples or solo travelers.
- Together, 1 bedroom and 2 bedrooms properties represent 76.2% of the active Airbnb listings in Sutton, indicating a high concentration in these sizes.
- With over half the market (61.9%) consisting of studios or 1-bedroom units, Sutton is particularly well-suited for individuals or couples.
Sutton Vacation Rental Guest Capacity Trends (2026)
Distribution of Listings by Guest Capacity
Guest Capacity Insights for Sutton
- The most common guest capacity trend in Sutton vacation rentals is listings accommodating 2 guests (38.1%). This suggests the primary traveler segment is likely couples or solo travelers.
- Properties designed for 2 guests and 8+ guests dominate the Sutton STR market, accounting for 57.1% of listings.
- 28.5% of properties accommodate 6+ guests, serving the market segment for larger families or group travel in Sutton.
- On average, properties in Sutton are equipped to host 3.8 guests.
Sutton Airbnb Booking Patterns (2026): Available vs. Booked Days
Available Days Distribution
Booked Days Distribution
Booking Pattern Insights for Sutton
- The most common availability pattern in Sutton falls within the 271-366 days range, representing 66.7% of listings. This suggests many properties have significant open periods on their calendars.
- Approximately 90.5% of listings show high availability (181+ days open annually), indicating potential for increased bookings or specific owner usage patterns.
- For booked days, the 1-30 days range is most frequent in Sutton (42.9%), reflecting common guest stay durations or potential owner blocking patterns.
- A notable 9.5% of properties secure long booking periods (181+ days booked per year), highlighting successful long-term rental strategies or significant owner usage.
Sutton Airbnb Minimum Stay Requirements Analysis
Distribution of Listings by Minimum Night Requirement
1 Night
19 listings
90.5% of total
2 Nights
1 listings
4.8% of total
30+ Nights
1 listings
4.8% of total
Key Insights
- The most prevalent minimum stay requirement in Sutton is 1 Night, adopted by 90.5% of listings. This highlights the market's preference for shorter, flexible bookings.
- A strong majority (95.3%) of the Sutton Airbnb data shows acceptance of very short stays (1-2 nights), indicating a dynamic, high-turnover market.
Recommendations
- Align with the market by considering a 1 Night minimum stay, as 90.5% of Sutton hosts use this setting.
- Adjust minimum nights based on seasonality – potentially shorter during low season and longer during peak demand periods in Sutton.
Sutton Airbnb Cancellation Policy Trends Analysis (2026)
Flexible
21 listings
100% of total
Cancellation Policy Insights for Sutton
- The prevailing Airbnb cancellation policy trend in Sutton is Flexible, used by 100% of listings.
- The market strongly favors guest-friendly terms, with 100.0% of listings offering Flexible or Moderate policies. This suggests guests in Sutton may expect booking flexibility.
Recommendations for Hosts
- Consider adopting a Flexible policy to align with the 100% market standard in Sutton.
- Given the high prevalence of Flexible policies (100%), offering this can enhance booking appeal, especially during shoulder seasons.
- Regularly review your cancellation policy against competitors and market demand shifts in Sutton.
Sutton STR Booking Lead Time Analysis (2026)
Average Booking Lead Time by Month
Booking Lead Time Insights for Sutton
- The overall average booking lead time for vacation rentals in Sutton is 32 days.
- Guests book furthest in advance for stays during May (average 84 days), likely coinciding with peak travel demand or local events.
- The shortest booking windows occur for stays in April (average 9 days), indicating more last-minute travel plans during this time.
- Seasonally, Fall (57 days avg.) sees the longest lead times, while Winter (18 days avg.) has the shortest, reflecting typical travel planning cycles.
Recommendations for Hosts
- Use the overall average lead time (32 days) as a baseline for your pricing and availability strategy in Sutton.
- For May stays, consider implementing length-of-stay discounts or slightly higher rates for bookings made less than 84 days out to capitalize on advance planning.
- During April, focus on last-minute booking availability and promotions, as guests book with very short notice (9 days avg.).
- Target marketing efforts for the Fall season well in advance (at least 57 days) to capture early planners.
- Monitor your own booking lead times against these Sutton averages to identify opportunities for dynamic pricing adjustments.
Popular & Essential Airbnb Amenities in Sutton (2026)
Amenity Prevalence
Amenity Insights for Sutton
- Essential amenities in Sutton that guests expect include: Heating, Wifi, Essentials, Air conditioning. Lacking these (any) could significantly impact bookings.
- Popular amenities like TV, Shampoo, Body soap are common but not universal. Offering these can provide a competitive edge.
Recommendations for Hosts
- Ensure your listing includes all essential amenities for Sutton: Heating, Wifi, Essentials, Air conditioning.
- Prioritize adding missing essentials: Essentials, Air conditioning.
- Consider adding popular differentiators like TV or Shampoo to increase appeal.
- Highlight unique or less common amenities you offer (e.g., hot tub, dedicated workspace, EV charger) in your listing description and photos.
- Regularly check competitor amenities in Sutton to stay competitive.
Sutton Airbnb Guest Demographics & Profile Analysis (2026)
Guest Profile Summary for Sutton
- The typical guest profile for Airbnb in Sutton consists of primarily domestic travelers (90%), often arriving from nearby Charleston, typically belonging to the Post-2000s (Gen Z/Alpha) group (50%), primarily speaking English or Spanish.
- Domestic travelers account for 90.4% of guests.
- Key international markets include United States (90.4%) and Canada (4.8%).
- Top languages spoken are English (73.3%) followed by Spanish (13.3%).
- A significant demographic segment is the Post-2000s (Gen Z/Alpha) group, representing 50% of guests.
Recommendations for Hosts
- Target domestic marketing efforts towards travelers from Charleston and Avon.
- Tailor amenities and listing descriptions to appeal to the dominant Post-2000s (Gen Z/Alpha) demographic (e.g., highlight fast WiFi, smart home features, local guides).
- Highlight unique local experiences or amenities relevant to the primary guest profile.
- Consider seasonal promotions aligned with peak travel times for key origin markets.
Nearby Short-Term Rental Market Comparison
How does the Sutton Airbnb market stack up against its neighbors? Compare key performance metrics like average monthly revenue, ADR, and occupancy rates in surrounding areas to understand the broader regional STR landscape.
| Market | Active Properties | Monthly Revenue | Daily Rate | Avg. Occupancy |
|---|---|---|---|---|
| Penhook | 18 | $5,675 | $678.75 | 37% |
| Rockbridge Baths | 12 | $4,144 | $298.35 | 45% |
| Blacksburg | 297 | $4,116 | $509.14 | 40% |
| Goodview | 31 | $3,953 | $401.90 | 44% |
| McHenry | 605 | $3,928 | $598.59 | 28% |
| Swanton | 250 | $3,870 | $639.77 | 30% |
| Victor | 21 | $3,854 | $450.02 | 33% |
| Garrett County | 11 | $3,848 | $705.84 | 24% |
| Hot Springs | 27 | $3,785 | $336.52 | 41% |
| Slaty Fork | 48 | $3,687 | $424.67 | 32% |