Dubois Airbnb Market Analysis 2026: Short Term Rental Data & Vacation Rental Statistics in Wyoming, United States
Is Airbnb profitable in Dubois in 2026? Explore comprehensive Airbnb analytics for Dubois, Wyoming, United States to uncover income potential. This 2026 STR market report for Dubois, based on AirROI data from February 2025 to January 2026, reveals key trends in the niche market of 91 active listings.
Whether you're considering an Airbnb investment in Dubois, optimizing your existing vacation rental, or exploring rental arbitrage opportunities, understanding the Dubois Airbnb data is crucial. Leveraging the low regulation environment is key to maximizing your short term rental income potential. Let's dive into the specifics.
Key Dubois Airbnb Performance Metrics Overview
Monthly Airbnb Revenue Variations & Income Potential in Dubois (2026)
Understanding the monthly revenue variations for Airbnb listings in Dubois is key to maximizing your short term rental income potential. Seasonality significantly impacts earnings. Our analysis, based on data from the past 12 months, shows that the peak revenue month for STRs in Dubois is typically July, while April often presents the lowest earnings, highlighting opportunities for strategic pricing adjustments during shoulder and low seasons. Explore the typical Airbnb income in Dubois across different performance tiers:
- Best-in-class properties (Top 10%) achieve $7,550+ monthly, often utilizing dynamic pricing and superior guest experiences.
- Strong performing properties (Top 25%) earn $5,243 or more, indicating effective management and desirable locations/amenities.
- Typical properties (Median) generate around $3,086 per month, representing the average market performance.
- Entry-level properties (Bottom 25%) see earnings around $1,808, often with potential for optimization.
Average Monthly Airbnb Earnings Trend in Dubois
Dubois Airbnb Occupancy Rate Trends (2026)
Maximize your bookings by understanding the Dubois STR occupancy trends. Seasonal demand shifts significantly influence how often properties are booked. Typically, Julysees the highest demand (peak season occupancy), while January experiences the lowest (low season). Effective strategies, like adjusting minimum stays or offering promotions, can boost occupancy during slower periods. Here's how different property tiers perform in Dubois:
- Best-in-class properties (Top 10%) achieve 77%+ occupancy, indicating high desirability and potentially optimized availability.
- Strong performing properties (Top 25%) maintain 60% or higher occupancy, suggesting good market fit and guest satisfaction.
- Typical properties (Median) have an occupancy rate around 39%.
- Entry-level properties (Bottom 25%) average 22% occupancy, potentially facing higher vacancy.
Average Monthly Occupancy Rate Trend in Dubois
Average Daily Rate (ADR) Airbnb Trends in Dubois (2026)
Effective short term rental pricing strategy in Dubois involves understanding monthly ADR fluctuations. The Average Daily Rate (ADR) for Airbnb in Dubois typically peaks in June and dips lowest during April. Leveraging Airbnb dynamic pricing tools or strategies based on this seasonality can significantly boost revenue. Here's a look at the typical nightly rates achieved:
- Best-in-class properties (Top 10%) command rates of $457+ per night, often due to premium features or locations.
- Strong performing properties (Top 25%) achieve nightly rates of $340 or more.
- Typical properties (Median) charge around $241 per night.
- Entry-level properties (Bottom 25%) earn around $194 per night.
Average Daily Rate (ADR) Trend by Month in Dubois
Get Live Dubois Market Intelligence 👇

Explore Real-time Analytics
Airbnb Seasonality Analysis & Trends in Dubois (2026)
Peak Season (July, August, June)
- Revenue averages $5,927 per month
- Occupancy rates average 60.1%
- Daily rates average $312
Shoulder Season
- Revenue averages $3,401 per month
- Occupancy maintains around 38.7%
- Daily rates hold near $293
Low Season (March, April, December)
- Revenue drops to average $2,610 per month
- Occupancy decreases to average 31.2%
- Daily rates adjust to average $277
Seasonality Insights for Dubois
- The Airbnb seasonality in Dubois shows highly seasonal trends requiring careful strategy. While the sections above show seasonal averages, it's also insightful to look at the extremes:
- During the high season, the absolute peak month showcases Dubois's highest earning potential, with monthly revenues capable of climbing to $6,649, occupancy reaching a high of 65.1%, and ADRs peaking at $315.
- Conversely, the slowest single month of the year, typically falling within the low season, marks the market's lowest point. In this month, revenue might dip to $2,555, occupancy could drop to 28.1%, and ADRs may adjust down to $268.
- Understanding both the seasonal averages and these monthly peaks and troughs in revenue, occupancy, and ADR is crucial for maximizing your Airbnb profit potential in Dubois.
Seasonal Strategies for Maximizing Profit
- Peak Season: Maximize revenue through premium pricing and potentially longer minimum stays. Ensure high availability.
- Low Season: Offer competitive pricing, special promotions (e.g., extended stay discounts), and flexible cancellation policies. Target off-season travelers like remote workers or budget-conscious guests.
- Shoulder Seasons: Implement dynamic pricing that balances peak and low rates. Target weekend travelers or specific events. Offer slightly more flexible terms than peak season.
- Regularly analyze your own performance against these Dubois seasonality benchmarks and adjust your pricing and availability strategy accordingly.
Best Areas for Airbnb Investment in Dubois (2026)
Exploring the top neighborhoods for short-term rentals in Dubois? This section highlights key areas, outlining why they are attractive for hosts and guests, along with notable local attractions. Consider these locations based on your target guest profile and investment strategy.
| Neighborhood / Area | Why Host Here? (Target Guests & Appeal) | Key Attractions & Landmarks |
|---|---|---|
| Grand Teton National Park | A breathtaking national park known for its stunning mountain range, beautiful lakes, and abundant wildlife. Perfect for tourists seeking outdoor adventures like hiking, camping, and photography. | Jenny Lake, Jenny Lake Trail, Signal Mountain, Schwabacher's Landing, Grand Teton Climbers' Ranch, Oxbow Bend |
| Jackson Hole | An iconic destination that combines luxury, outdoor activities, and a vibrant arts scene. Jackson Hole is favored by tourists looking for skiing in winter and outdoor activities in summer. | Jackson Hole Mountain Resort, Teton Village, National Museum of Wildlife Art, Town Square, JH Historical Society and Museum, Snow King Mountain |
| Pinedale | A charming small town that serves as a gateway to the Wind River Range and offers access to fishing, hunting, and hiking. Attracts nature enthusiasts and those seeking a quiet retreat. | Sublette County Library, Pinedale Aquatic Center, Wind River Heritage Center, Fremont Lake, Green River |
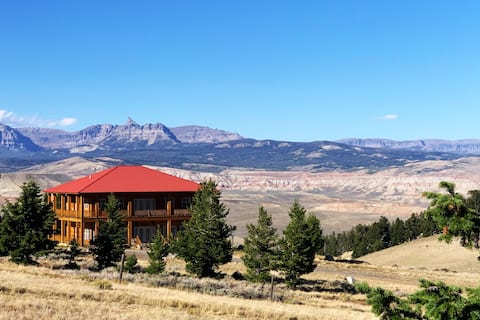
| Dubois | A quaint mountain town that provides access to spectacular hiking, fishing, and winter sports. Popular with tourists wanting a true Wyoming experience away from the busy tourist spots. | National Bighorn Sheep Center, Dubois Museum, Brooks Lake, Teton Wilderness, Wind River |
| Sinks Canyon State Park | A beautiful state park known for its unique geological features and amazing outdoor recreational opportunities. Ideal for hikers, climbers, and those wanting to explore nature. | Sinks Canyon, Popo Agie Falls, Nature Trail, Climbing Areas, Wildlife Viewing |
| Thermopolis | Home to the world's largest hot springs, Thermopolis attracts visitors looking to relax and enjoy natural mineral waters. Family-friendly and offers a range of leisure activities. | Hot Springs State Park, Wyoming Dinosaur Center, TePee Pools, Wind River Canyon |
| Shoshoni | A small town with a rich history and access to outdoor activities. Offers an authentic Wyoming small-town experience with access to nearby attractions. | Shoshoni Museum, Historic Downtown, Wind River |
| Landers | A picturesque town located near the Wind River Range, known for rock climbing and outdoor recreation. It attracts adventure seekers and nature lovers. | Sinks Canyon State Park, Lander Art Center, Sweetwater River, Wind River Range |
Understanding Airbnb License Requirements & STR Laws in Dubois (2026)
While Dubois, Wyoming, United States currently shows low STR regulations, specific Airbnb license requirements might still exist or change. Always verify the latest short term rental regulations and Airbnb license requirements directly with local government authorities for Dubois to ensure full compliance before hosting.
(Source: AirROI data, 2026, finding no licensed listings among those analyzed)
Top Performing Airbnb Properties in Dubois (2026)
Benchmark your potential! Explore examples of top-performing Airbnb properties in Duboisbased on Trailing Twelve Month (TTM) revenue. Analyze their characteristics, revenue, occupancy rate, and ADR to understand what drives success in this market.

Big Diamond Ranch, Main House
Entire Place • 4 bedrooms
Lodge @ Arcady Ridge Ranch, Swim Spa, Sauna, Play!
Entire Place • 4 bedrooms

Mountain Cabin on Union Pass near Yellowstone
Entire Place • 4 bedrooms

Bunkhouse - 12 guests, 6 Beds, Newly Renovated
Entire Place • 4 bedrooms
Warm Springs Lodge on Union Pass Near Yellowstone
Entire Place • 4 bedrooms

Dubois Riverfront Lodge w/ On-Site Fishing & Views
Entire Place • 3 bedrooms
Note: Performance varies based on location, size, amenities, seasonality, and management quality. Data reflects the past 12 months.
Top Performing Airbnb Hosts in Dubois (2026)
Learn from the best! This table showcases top-performing Airbnb hosts in Dubois based on the number of properties managed and estimated total revenue over the past year. Analyze their scale and performance metrics.
| Host Name | Properties | Grossing Revenue | Stay Reviews | Avg Rating |
|---|---|---|---|---|
| Joel | 6 | $422,000 | 488 | 4.96/5.0 |
| Kim | 11 | $214,646 | 78 | 4.54/5.0 |
| Evolve | 3 | $168,476 | 60 | 4.85/5.0 |
| The Bunkhouse, Hosts Bob & Da | 3 | $136,657 | 472 | 4.96/5.0 |
| Aileen | 3 | $120,417 | 67 | 4.93/5.0 |
| Lori | 5 | $116,858 | 41 | 4.98/5.0 |
| The Longhorn Ranch Resort | 8 | $114,629 | 129 | 4.85/5.0 |
| Kathrin | 1 | $111,927 | 50 | 5.00/5.0 |
| Traci Autumn | 1 | $99,786 | 16 | 4.88/5.0 |
| John | 2 | $98,985 | 67 | 4.99/5.0 |
Analyzing the strategies of top hosts, such as their property selection, pricing, and guest communication, can offer valuable lessons for optimizing your own Airbnb operations in Dubois.
Dive Deeper: Advanced Dubois STR Market Data (2026)
Ready to unlock more insights? AirROI provides access to advanced metrics and comprehensive Airbnb data for Dubois. Explore detailed analytics beyond this report to refine your investment strategy, optimize pricing, and maximize your vacation rental profits.
Explore Advanced MetricsDubois Short-Term Rental Market Composition (2026): Property & Room Types
Room Type Distribution
Property Type Distribution
Market Composition Insights for Dubois
- The Dubois Airbnb market composition is heavily skewed towards Entire Home/Apt listings, which make up 83.5% of the 91 active rentals. This indicates strong guest preference for privacy and space.
- Looking at the property type distribution in Dubois, Outdoor/Unique properties are the most common (56%), reflecting the local real estate landscape.
- Houses represent a significant 23.1% portion, catering likely to families or larger groups.
- The presence of 13.2% Hotel/Boutique listings indicates integration with traditional hospitality.
- Smaller segments like unique stays, others (combined 2.2%) offer potential for unique stay experiences.
Dubois Airbnb Room Capacity Analysis (2026): Bedroom Distribution
Distribution of Listings by Number of Bedrooms
Room Capacity Insights for Dubois
- The dominant room capacity in Dubois is 2 bedrooms listings, making up 36.3% of the market. This suggests a strong demand for properties suitable for couples or solo travelers.
- Together, 2 bedrooms and 1 bedroom properties represent 61.6% of the active Airbnb listings in Dubois, indicating a high concentration in these sizes.
- A significant 35.2% of listings offer 3+ bedrooms, catering to larger groups and families seeking more space in Dubois.
Dubois Vacation Rental Guest Capacity Trends (2026)
Distribution of Listings by Guest Capacity
Guest Capacity Insights for Dubois
- The most common guest capacity trend in Dubois vacation rentals is listings accommodating 8+ guests (35.2%). This suggests the primary traveler segment is likely larger groups.
- Properties designed for 8+ guests and 6 guests dominate the Dubois STR market, accounting for 60.5% of listings.
- 66.0% of properties accommodate 6+ guests, serving the market segment for larger families or group travel in Dubois.
- On average, properties in Dubois are equipped to host 5.8 guests.
Dubois Airbnb Booking Patterns (2026): Available vs. Booked Days
Available Days Distribution
Booked Days Distribution
Booking Pattern Insights for Dubois
- The most common availability pattern in Dubois falls within the 181-270 days range, representing 45.1% of listings. This suggests many properties have significant open periods on their calendars.
- Approximately 81.4% of listings show high availability (181+ days open annually), indicating potential for increased bookings or specific owner usage patterns.
- For booked days, the 91-180 days range is most frequent in Dubois (41.8%), reflecting common guest stay durations or potential owner blocking patterns.
- A notable 22.0% of properties secure long booking periods (181+ days booked per year), highlighting successful long-term rental strategies or significant owner usage.
Dubois Airbnb Minimum Stay Requirements Analysis
Distribution of Listings by Minimum Night Requirement
1 Night
25 listings
27.5% of total
2 Nights
23 listings
25.3% of total
3 Nights
11 listings
12.1% of total
4-6 Nights
7 listings
7.7% of total
7-29 Nights
1 listings
1.1% of total
30+ Nights
24 listings
26.4% of total
Key Insights
- The most prevalent minimum stay requirement in Dubois is 1 Night, adopted by 27.5% of listings. This highlights the market's preference for shorter, flexible bookings.
- A significant segment (26.4%) caters to monthly stays (30+ nights) in Dubois, pointing to opportunities in the extended-stay market.
Recommendations
- Align with the market by considering a 1 Night minimum stay, as 27.5% of Dubois hosts use this setting.
- If feasible, allowing 1-night stays, especially midweek or during low season, could capture last-minute bookings, as only 27.5% currently do.
- Explore offering discounts for stays of 30+ nights to attract the 26.4% of the market seeking extended stays.
- Adjust minimum nights based on seasonality – potentially shorter during low season and longer during peak demand periods in Dubois.
Dubois Airbnb Cancellation Policy Trends Analysis (2026)
Limited
1 listings
1.1% of total
Super Strict 30 Days
1 listings
1.1% of total
Flexible
9 listings
9.9% of total
Moderate
20 listings
22% of total
Firm
52 listings
57.1% of total
Strict
8 listings
8.8% of total
Cancellation Policy Insights for Dubois
- The prevailing Airbnb cancellation policy trend in Dubois is Firm, used by 57.1% of listings.
- A majority (65.9%) of hosts in Dubois utilize Firm or Strict policies, indicating a market where hosts prioritize booking security.
- Strict cancellation policies are quite rare (8.8%), potentially making listings with this policy less competitive unless justified by high demand or property type.
Recommendations for Hosts
- Consider adopting a Firm policy to align with the 57.1% market standard in Dubois.
- Using a Strict policy might deter some guests, as only 8.8% of listings use it. Evaluate if potential revenue protection outweighs possible lower booking rates.
- Regularly review your cancellation policy against competitors and market demand shifts in Dubois.
Dubois STR Booking Lead Time Analysis (2026)
Average Booking Lead Time by Month
Booking Lead Time Insights for Dubois
- The overall average booking lead time for vacation rentals in Dubois is 73 days.
- Guests book furthest in advance for stays during June (average 108 days), likely coinciding with peak travel demand or local events.
- The shortest booking windows occur for stays in December (average 35 days), indicating more last-minute travel plans during this time.
- Seasonally, Summer (105 days avg.) sees the longest lead times, while Winter (48 days avg.) has the shortest, reflecting typical travel planning cycles.
Recommendations for Hosts
- Use the overall average lead time (73 days) as a baseline for your pricing and availability strategy in Dubois.
- For June stays, consider implementing length-of-stay discounts or slightly higher rates for bookings made less than 108 days out to capitalize on advance planning.
- Target marketing efforts for the Summer season well in advance (at least 105 days) to capture early planners.
- Monitor your own booking lead times against these Dubois averages to identify opportunities for dynamic pricing adjustments.
Popular & Essential Airbnb Amenities in Dubois (2026)
Amenity Prevalence
Amenity Insights for Dubois
- Essential amenities in Dubois that guests expect include: Free parking on premises, Wifi. Lacking these (any) could significantly impact bookings.
- Popular amenities like Smoke alarm, Fire extinguisher, TV are common but not universal. Offering these can provide a competitive edge.
Recommendations for Hosts
- Ensure your listing includes all essential amenities for Dubois: Free parking on premises, Wifi.
- Prioritize adding missing essentials: Free parking on premises, Wifi.
- Consider adding popular differentiators like Smoke alarm or Fire extinguisher to increase appeal.
- Highlight unique or less common amenities you offer (e.g., hot tub, dedicated workspace, EV charger) in your listing description and photos.
- Regularly check competitor amenities in Dubois to stay competitive.
Dubois Airbnb Guest Demographics & Profile Analysis (2026)
Guest Profile Summary for Dubois
- The typical guest profile for Airbnb in Dubois consists of primarily domestic travelers (96%), often arriving from nearby Casper, typically belonging to the Post-2000s (Gen Z/Alpha) group (50%), primarily speaking English or Spanish.
- Domestic travelers account for 95.8% of guests.
- Key international markets include United States (95.8%) and Germany (1.1%).
- Top languages spoken are English (75.9%) followed by Spanish (6.5%).
- A significant demographic segment is the Post-2000s (Gen Z/Alpha) group, representing 50% of guests.
Recommendations for Hosts
- Target domestic marketing efforts towards travelers from Casper and Denver.
- Tailor amenities and listing descriptions to appeal to the dominant Post-2000s (Gen Z/Alpha) demographic (e.g., highlight fast WiFi, smart home features, local guides).
- Highlight unique local experiences or amenities relevant to the primary guest profile.
- Consider seasonal promotions aligned with peak travel times for key origin markets.
Nearby Short-Term Rental Market Comparison
How does the Dubois Airbnb market stack up against its neighbors? Compare key performance metrics like average monthly revenue, ADR, and occupancy rates in surrounding areas to understand the broader regional STR landscape.
| Market | Active Properties | Monthly Revenue | Daily Rate | Avg. Occupancy |
|---|---|---|---|---|
| Teton Village | 283 | $8,166 | $913.82 | 43% |
| Jackson | 349 | $6,568 | $588.79 | 47% |
| Wilson | 259 | $4,662 | $481.18 | 48% |
| Bondurant | 12 | $3,064 | $314.18 | 56% |
| Star Valley Ranch | 47 | $2,635 | $311.46 | 44% |
| Cody | 354 | $2,225 | $241.16 | 47% |
| Lander | 64 | $2,220 | $190.85 | 47% |
| Pinedale | 68 | $2,044 | $195.12 | 47% |
| Thermopolis | 54 | $1,953 | $175.72 | 42% |
| Thayne | 28 | $1,857 | $258.06 | 41% |