Evanston Airbnb Market Analysis 2025: Short Term Rental Data & Vacation Rental Statistics in Wyoming, United States
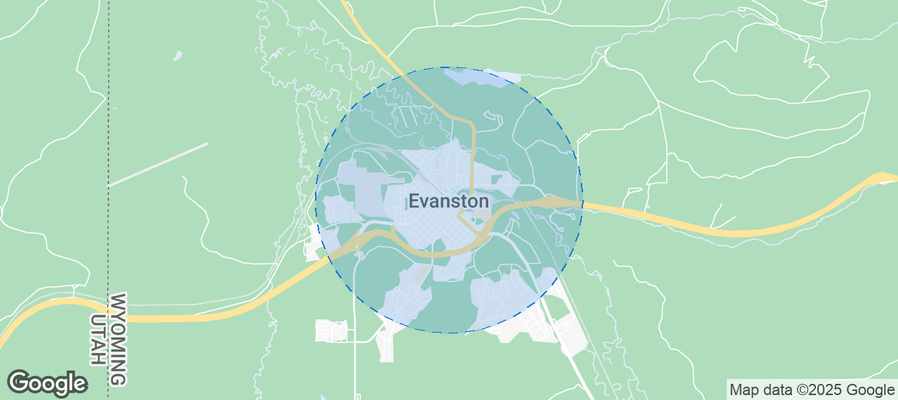
Is Airbnb profitable in Evanston in 2025? Explore comprehensive Airbnb analytics for Evanston, Wyoming, United States to uncover income potential. This 2025 STR market report for Evanston, based on AirROI data from December 2024 to November 2025, reveals key trends in the niche market of 20 active listings.
Whether you're considering an Airbnb investment in Evanston, optimizing your existing vacation rental, or exploring rental arbitrage opportunities, understanding the Evanston Airbnb data is crucial. Leveraging the low regulation environment is key to maximizing your short term rental income potential. Let's dive into the specifics.
Key Evanston Airbnb Performance Metrics Overview
Monthly Airbnb Revenue Variations & Income Potential in Evanston (2025)
Understanding the monthly revenue variations for Airbnb listings in Evanston is key to maximizing your short term rental income potential. Seasonality significantly impacts earnings. Our analysis, based on data from the past 12 months, shows that the peak revenue month for STRs in Evanston is typically October, while April often presents the lowest earnings, highlighting opportunities for strategic pricing adjustments during shoulder and low seasons. Explore the typical Airbnb income in Evanston across different performance tiers:
- Best-in-class properties (Top 10%) achieve $3,683+ monthly, often utilizing dynamic pricing and superior guest experiences.
- Strong performing properties (Top 25%) earn $2,545 or more, indicating effective management and desirable locations/amenities.
- Typical properties (Median) generate around $1,227 per month, representing the average market performance.
- Entry-level properties (Bottom 25%) see earnings around $516, often with potential for optimization.
Average Monthly Airbnb Earnings Trend in Evanston
Evanston Airbnb Occupancy Rate Trends (2025)
Maximize your bookings by understanding the Evanston STR occupancy trends. Seasonal demand shifts significantly influence how often properties are booked. Typically, Octobersees the highest demand (peak season occupancy), while December experiences the lowest (low season). Effective strategies, like adjusting minimum stays or offering promotions, can boost occupancy during slower periods. Here's how different property tiers perform in Evanston:
- Best-in-class properties (Top 10%) achieve 72%+ occupancy, indicating high desirability and potentially optimized availability.
- Strong performing properties (Top 25%) maintain 55% or higher occupancy, suggesting good market fit and guest satisfaction.
- Typical properties (Median) have an occupancy rate around 32%.
- Entry-level properties (Bottom 25%) average 20% occupancy, potentially facing higher vacancy.
Average Monthly Occupancy Rate Trend in Evanston
Average Daily Rate (ADR) Airbnb Trends in Evanston (2025)
Effective short term rental pricing strategy in Evanston involves understanding monthly ADR fluctuations. The Average Daily Rate (ADR) for Airbnb in Evanston typically peaks in November and dips lowest during April. Leveraging Airbnb dynamic pricing tools or strategies based on this seasonality can significantly boost revenue. Here's a look at the typical nightly rates achieved:
- Best-in-class properties (Top 10%) command rates of $396+ per night, often due to premium features or locations.
- Strong performing properties (Top 25%) achieve nightly rates of $156 or more.
- Typical properties (Median) charge around $119 per night.
- Entry-level properties (Bottom 25%) earn around $84 per night.
Average Daily Rate (ADR) Trend by Month in Evanston
Get Live Evanston Market Intelligence 👇
Explore Real-time Analytics
Airbnb Seasonality Analysis & Trends in Evanston (2025)
Peak Season (October, July, August)
- Revenue averages $2,462 per month
- Occupancy rates average 44.0%
- Daily rates average $177
Shoulder Season
- Revenue averages $1,718 per month
- Occupancy maintains around 37.5%
- Daily rates hold near $153
Low Season (February, April, December)
- Revenue drops to average $1,103 per month
- Occupancy decreases to average 34.9%
- Daily rates adjust to average $135
Seasonality Insights for Evanston
- The Airbnb seasonality in Evanston shows highly seasonal trends requiring careful strategy. While the sections above show seasonal averages, it's also insightful to look at the extremes:
- During the high season, the absolute peak month showcases Evanston's highest earning potential, with monthly revenues capable of climbing to $2,616, occupancy reaching a high of 48.4%, and ADRs peaking at $184.
- Conversely, the slowest single month of the year, typically falling within the low season, marks the market's lowest point. In this month, revenue might dip to $1,012, occupancy could drop to 27.5%, and ADRs may adjust down to $132.
- Understanding both the seasonal averages and these monthly peaks and troughs in revenue, occupancy, and ADR is crucial for maximizing your Airbnb profit potential in Evanston.
Seasonal Strategies for Maximizing Profit
- Peak Season: Maximize revenue through premium pricing and potentially longer minimum stays. Ensure high availability.
- Low Season: Offer competitive pricing, special promotions (e.g., extended stay discounts), and flexible cancellation policies. Target off-season travelers like remote workers or budget-conscious guests.
- Shoulder Seasons: Implement dynamic pricing that balances peak and low rates. Target weekend travelers or specific events. Offer slightly more flexible terms than peak season.
- Regularly analyze your own performance against these Evanston seasonality benchmarks and adjust your pricing and availability strategy accordingly.
Best Areas for Airbnb Investment in Evanston (2025)
Exploring the top neighborhoods for short-term rentals in Evanston? This section highlights key areas, outlining why they are attractive for hosts and guests, along with notable local attractions. Consider these locations based on your target guest profile and investment strategy.
| Neighborhood / Area | Why Host Here? (Target Guests & Appeal) | Key Attractions & Landmarks |
|---|---|---|
| Downtown Evanston | The heart of Evanston with a vibrant atmosphere, featuring shops, restaurants, and entertainment options. Ideal for guests looking for convenience and access to urban amenities. | Evanston Art Center, Northwestern University, The Block Museum of Art, Evanston History Center, Chicagoland Speedboat Tours, Shopping on Davis Street |
| Evanston Lakefront | A picturesque area along Lake Michigan, perfect for outdoor enthusiasts and families. Offers scenic views, parks, and beach access, making it great for summer visitors. | Evanston's Beaches, Lighthouse Landing, Clark Street Beach, Benton Historical Museum, Lee Street Beach and Park |
| Northwestern University | A prime spot near the university campus, attracting students, faculty, and visiting families. Ideal for short-term rentals aimed at academic visitors. | Northwestern University Campus, Searle Center, Ryan Field, Welsh-Ryan Arena, Bienen School of Music |
| Robert Crown Community Center | A community hub that offers recreational facilities and hosts sporting events. Appeals to families and athletes coming to Evanston. | Robert Crown Community Center, Athletic Facilities, Local sports events, Community programs, Parks and playgrounds |
| South Evanston | A residential area that provides a local feel with access to amenities and parks. Suitable for visitors wishing to experience the local lifestyle. | James Park, Evanston Golf Club, Churches and local eateries, Local markets, Family-friendly neighborhoods |
| Skokie Boulevard | An area known for shopping and restaurants, offering a suburban vibe with easy access to major highways and attractions in nearby Chicago. | Skokie Valley Trail, Shopping Centers, Restaurants and cafes, Movie Theaters, Nearby parks |
| Main Street District | A trendy area with boutique shops, casual dining, and coffee shops. Popular with young professionals and those looking for a vibrant neighborhood. | Main Street Shopping District, Local eateries, Art galleries, Live music venues, Specialty stores |
| Evanston Parks | Surrounded by multiple parks, this area is ideal for nature lovers and families. Provides easy outdoor access and recreational opportunities. | Lindsey Park, Wooded Park, Ridgeville Park District, Outdoor sports facilities, Picnic areas |
Understanding Airbnb License Requirements & STR Laws in Evanston (2025)
While Evanston, Wyoming, United States currently shows low STR regulations, specific Airbnb license requirements might still exist or change. Always verify the latest short term rental regulations and Airbnb license requirements directly with local government authorities for Evanston to ensure full compliance before hosting.
(Source: AirROI data, 2025, finding no licensed listings among those analyzed)
Top Performing Airbnb Properties in Evanston (2025)
Benchmark your potential! Explore examples of top-performing Airbnb properties in Evanstonbased on Trailing Twelve Month (TTM) revenue. Analyze their characteristics, revenue, occupancy rate, and ADR to understand what drives success in this market.
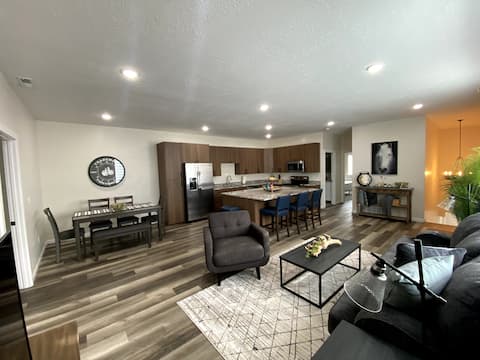
Newly Built 3 Bed 2 Bath House
Entire Place • 3 bedrooms
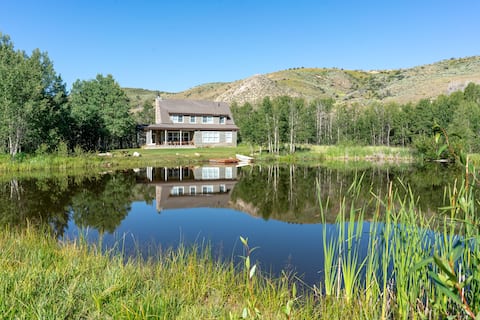
Tranquil Wyoming Cabin Near Uintas - 105 Acres!
Entire Place • 4 bedrooms
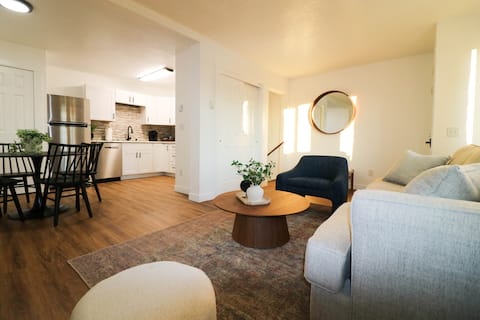
Central 2/1 in Heart of Evanston
Entire Place • 2 bedrooms
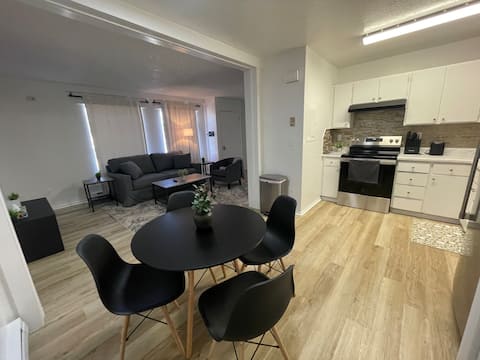
Cozy Fully Furnished 2/1 APT in Evanston
Entire Place • 2 bedrooms
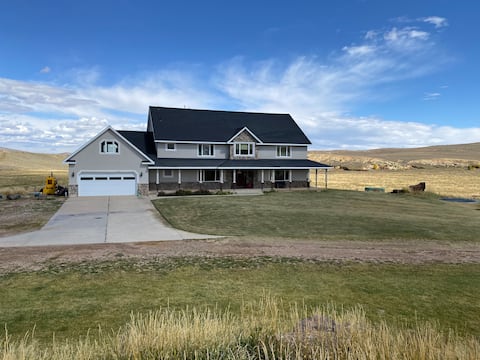
25 min to Bear River Lodge
Entire Place • 6 bedrooms
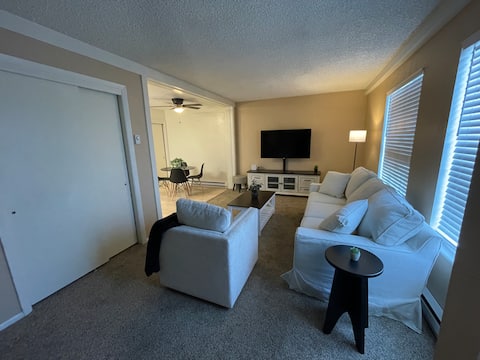
Updated 2/1 APT in Evanston
Entire Place • 2 bedrooms
Note: Performance varies based on location, size, amenities, seasonality, and management quality. Data reflects the past 12 months.
Top Performing Airbnb Hosts in Evanston (2025)
Learn from the best! This table showcases top-performing Airbnb hosts in Evanston based on the number of properties managed and estimated total revenue over the past year. Analyze their scale and performance metrics.
| Host Name | Properties | Grossing Revenue | Stay Reviews | Avg Rating |
|---|---|---|---|---|
| Elizabeth | 6 | $119,668 | 139 | 4.88/5.0 |
| Brandon | 2 | $56,336 | 52 | 4.93/5.0 |
| Evolve | 2 | $48,276 | 40 | 4.66/5.0 |
| Marianne | 1 | $22,753 | 7 | 5.00/5.0 |
| Hannah | 4 | $17,716 | 152 | 4.93/5.0 |
| Jonathan | 2 | $10,563 | 13 | 3.71/5.0 |
| Zachary | 1 | $5,339 | 4 | 5.00/5.0 |
| Tiago | 1 | $1,343 | 2 | Not Rated |
| Host #203364458 | 1 | $300 | 1 | Not Rated |
Analyzing the strategies of top hosts, such as their property selection, pricing, and guest communication, can offer valuable lessons for optimizing your own Airbnb operations in Evanston.
Dive Deeper: Advanced Evanston STR Market Data (2025)
Ready to unlock more insights? AirROI provides access to advanced metrics and comprehensive Airbnb data for Evanston. Explore detailed analytics beyond this report to refine your investment strategy, optimize pricing, and maximize your vacation rental profits.
Explore Advanced MetricsEvanston Short-Term Rental Market Composition (2025): Property & Room Types
Room Type Distribution
Property Type Distribution
Market Composition Insights for Evanston
- The Evanston Airbnb market composition is heavily skewed towards Entire Home/Apt listings, which make up 90% of the 20 active rentals. This indicates strong guest preference for privacy and space.
- Looking at the property type distribution in Evanston, Apartment/Condo properties are the most common (45%), reflecting the local real estate landscape.
- Houses represent a significant 35% portion, catering likely to families or larger groups.
Evanston Airbnb Room Capacity Analysis (2025): Bedroom Distribution
Distribution of Listings by Number of Bedrooms
Room Capacity Insights for Evanston
- The dominant room capacity in Evanston is 2 bedrooms listings, making up 40% of the market. This suggests a strong demand for properties suitable for couples or solo travelers.
- Together, 2 bedrooms and 3 bedrooms properties represent 55.0% of the active Airbnb listings in Evanston, indicating a high concentration in these sizes.
- A significant 35.0% of listings offer 3+ bedrooms, catering to larger groups and families seeking more space in Evanston.
Evanston Vacation Rental Guest Capacity Trends (2025)
Distribution of Listings by Guest Capacity
Guest Capacity Insights for Evanston
- The most common guest capacity trend in Evanston vacation rentals is listings accommodating 4 guests (35%). This suggests the primary traveler segment is likely small families or groups.
- Properties designed for 4 guests and 8+ guests dominate the Evanston STR market, accounting for 65.0% of listings.
- 45.0% of properties accommodate 6+ guests, serving the market segment for larger families or group travel in Evanston.
- On average, properties in Evanston are equipped to host 5.1 guests.
Evanston Airbnb Booking Patterns (2025): Available vs. Booked Days
Available Days Distribution
Booked Days Distribution
Booking Pattern Insights for Evanston
- The most common availability pattern in Evanston falls within the 271-366 days range, representing 60% of listings. This suggests many properties have significant open periods on their calendars.
- Approximately 95.0% of listings show high availability (181+ days open annually), indicating potential for increased bookings or specific owner usage patterns.
- For booked days, the 31-90 days range is most frequent in Evanston (45%), reflecting common guest stay durations or potential owner blocking patterns.
- A notable 10.0% of properties secure long booking periods (181+ days booked per year), highlighting successful long-term rental strategies or significant owner usage.
Evanston Airbnb Minimum Stay Requirements Analysis
Distribution of Listings by Minimum Night Requirement
1 Night
12 listings
60% of total
2 Nights
4 listings
20% of total
3 Nights
1 listings
5% of total
4-6 Nights
1 listings
5% of total
7-29 Nights
1 listings
5% of total
30+ Nights
1 listings
5% of total
Key Insights
- The most prevalent minimum stay requirement in Evanston is 1 Night, adopted by 60% of listings. This highlights the market's preference for shorter, flexible bookings.
- A strong majority (80.0%) of the Evanston Airbnb data shows acceptance of very short stays (1-2 nights), indicating a dynamic, high-turnover market.
Recommendations
- Align with the market by considering a 1 Night minimum stay, as 60% of Evanston hosts use this setting.
- Adjust minimum nights based on seasonality – potentially shorter during low season and longer during peak demand periods in Evanston.
Evanston Airbnb Cancellation Policy Trends Analysis (2025)
Flexible
4 listings
21.1% of total
Moderate
3 listings
15.8% of total
Firm
3 listings
15.8% of total
Strict
9 listings
47.4% of total
Cancellation Policy Insights for Evanston
- The prevailing Airbnb cancellation policy trend in Evanston is Strict, used by 47.4% of listings.
- A majority (63.2%) of hosts in Evanston utilize Firm or Strict policies, indicating a market where hosts prioritize booking security.
Recommendations for Hosts
- Consider adopting a Strict policy to align with the 47.4% market standard in Evanston.
- With 47.4% using Strict terms, this is a viable option in Evanston, particularly for high-value properties or during peak demand periods.
- Regularly review your cancellation policy against competitors and market demand shifts in Evanston.
Evanston STR Booking Lead Time Analysis (2025)
Average Booking Lead Time by Month
Booking Lead Time Insights for Evanston
- The overall average booking lead time for vacation rentals in Evanston is 40 days.
- Guests book furthest in advance for stays during July (average 70 days), likely coinciding with peak travel demand or local events.
- The shortest booking windows occur for stays in March (average 12 days), indicating more last-minute travel plans during this time.
- Seasonally, Summer (41 days avg.) sees the longest lead times, while Spring (20 days avg.) has the shortest, reflecting typical travel planning cycles.
Recommendations for Hosts
- Use the overall average lead time (40 days) as a baseline for your pricing and availability strategy in Evanston.
- For July stays, consider implementing length-of-stay discounts or slightly higher rates for bookings made less than 70 days out to capitalize on advance planning.
- During March, focus on last-minute booking availability and promotions, as guests book with very short notice (12 days avg.).
- Target marketing efforts for the Summer season well in advance (at least 41 days) to capture early planners.
- Monitor your own booking lead times against these Evanston averages to identify opportunities for dynamic pricing adjustments.
Popular & Essential Airbnb Amenities in Evanston (2025)
Amenity Prevalence
Amenity Insights for Evanston
- Essential amenities in Evanston that guests expect include: Wifi, TV, Kitchen, Smoke alarm. Lacking these (any) could significantly impact bookings.
- Popular amenities like Heating, Free parking on premises, Hot water are common but not universal. Offering these can provide a competitive edge.
Recommendations for Hosts
- Ensure your listing includes all essential amenities for Evanston: Wifi, TV, Kitchen, Smoke alarm.
- Prioritize adding missing essentials: Kitchen, Smoke alarm.
- Consider adding popular differentiators like Heating or Free parking on premises to increase appeal.
- Highlight unique or less common amenities you offer (e.g., hot tub, dedicated workspace, EV charger) in your listing description and photos.
- Regularly check competitor amenities in Evanston to stay competitive.
Evanston Airbnb Guest Demographics & Profile Analysis (2025)
Guest Profile Summary for Evanston
- The typical guest profile for Airbnb in Evanston consists of primarily domestic travelers (97%), often arriving from nearby Salt Lake City, typically belonging to the Post-2000s (Gen Z/Alpha) group (50%), primarily speaking English or Spanish.
- Domestic travelers account for 96.6% of guests.
- Key international markets include United States (96.6%) and United Kingdom (0.9%).
- Top languages spoken are English (70.2%) followed by Spanish (17%).
- A significant demographic segment is the Post-2000s (Gen Z/Alpha) group, representing 50% of guests.
Recommendations for Hosts
- Target domestic marketing efforts towards travelers from Salt Lake City and Los Angeles.
- Tailor amenities and listing descriptions to appeal to the dominant Post-2000s (Gen Z/Alpha) demographic (e.g., highlight fast WiFi, smart home features, local guides).
- Highlight unique local experiences or amenities relevant to the primary guest profile.
- Consider seasonal promotions aligned with peak travel times for key origin markets.
Nearby Short-Term Rental Market Comparison
How does the Evanston Airbnb market stack up against its neighbors? Compare key performance metrics like average monthly revenue, ADR, and occupancy rates in surrounding areas to understand the broader regional STR landscape.
| Market | Active Properties | Monthly Revenue | Daily Rate | Avg. Occupancy |
|---|---|---|---|---|
| Alta | 38 | $7,744 | $1060.14 | 39% |
| Sundance | 62 | $6,880 | $878.91 | 33% |
| Fish Haven | 58 | $6,514 | $901.93 | 32% |
| Daniel | 22 | $5,381 | $646.70 | 38% |
| Brighton | 148 | $5,128 | $553.36 | 40% |
| Park City | 3,894 | $4,746 | $627.20 | 37% |
| Coalville | 35 | $4,058 | $468.02 | 34% |
| Mapleton | 11 | $3,965 | $371.41 | 43% |
| Hideout | 103 | $3,902 | $451.84 | 37% |
| Heber City | 215 | $3,712 | $499.73 | 36% |