Kemmerer Airbnb Market Analysis 2026: Short Term Rental Data & Vacation Rental Statistics in Wyoming, United States
Is Airbnb profitable in Kemmerer in 2026? Explore comprehensive Airbnb analytics for Kemmerer, Wyoming, United States to uncover income potential. This 2026 STR market report for Kemmerer, based on AirROI data from February 2025 to January 2026, reveals key trends in the niche market of 19 active listings.
Whether you're considering an Airbnb investment in Kemmerer, optimizing your existing vacation rental, or exploring rental arbitrage opportunities, understanding the Kemmerer Airbnb data is crucial. Leveraging the low regulation environment is key to maximizing your short term rental income potential. Let's dive into the specifics.
Key Kemmerer Airbnb Performance Metrics Overview
Monthly Airbnb Revenue Variations & Income Potential in Kemmerer (2026)
Understanding the monthly revenue variations for Airbnb listings in Kemmerer is key to maximizing your short term rental income potential. Seasonality significantly impacts earnings. Our analysis, based on data from the past 12 months, shows that the peak revenue month for STRs in Kemmerer is typically October, while December often presents the lowest earnings, highlighting opportunities for strategic pricing adjustments during shoulder and low seasons. Explore the typical Airbnb income in Kemmerer across different performance tiers:
- Best-in-class properties (Top 10%) achieve $4,049+ monthly, often utilizing dynamic pricing and superior guest experiences.
- Strong performing properties (Top 25%) earn $3,041 or more, indicating effective management and desirable locations/amenities.
- Typical properties (Median) generate around $1,762 per month, representing the average market performance.
- Entry-level properties (Bottom 25%) see earnings around $771, often with potential for optimization.
Average Monthly Airbnb Earnings Trend in Kemmerer
Kemmerer Airbnb Occupancy Rate Trends (2026)
Maximize your bookings by understanding the Kemmerer STR occupancy trends. Seasonal demand shifts significantly influence how often properties are booked. Typically, Maysees the highest demand (peak season occupancy), while December experiences the lowest (low season). Effective strategies, like adjusting minimum stays or offering promotions, can boost occupancy during slower periods. Here's how different property tiers perform in Kemmerer:
- Best-in-class properties (Top 10%) achieve 67%+ occupancy, indicating high desirability and potentially optimized availability.
- Strong performing properties (Top 25%) maintain 53% or higher occupancy, suggesting good market fit and guest satisfaction.
- Typical properties (Median) have an occupancy rate around 33%.
- Entry-level properties (Bottom 25%) average 18% occupancy, potentially facing higher vacancy.
Average Monthly Occupancy Rate Trend in Kemmerer
Average Daily Rate (ADR) Airbnb Trends in Kemmerer (2026)
Effective short term rental pricing strategy in Kemmerer involves understanding monthly ADR fluctuations. The Average Daily Rate (ADR) for Airbnb in Kemmerer typically peaks in October and dips lowest during December. Leveraging Airbnb dynamic pricing tools or strategies based on this seasonality can significantly boost revenue. Here's a look at the typical nightly rates achieved:
- Best-in-class properties (Top 10%) command rates of $219+ per night, often due to premium features or locations.
- Strong performing properties (Top 25%) achieve nightly rates of $179 or more.
- Typical properties (Median) charge around $139 per night.
- Entry-level properties (Bottom 25%) earn around $133 per night.
Average Daily Rate (ADR) Trend by Month in Kemmerer
Get Live Kemmerer Market Intelligence 👇

Explore Real-time Analytics
Airbnb Seasonality Analysis & Trends in Kemmerer (2026)
Peak Season (October, May, November)
- Revenue averages $2,875 per month
- Occupancy rates average 48.0%
- Daily rates average $150
Shoulder Season
- Revenue averages $1,989 per month
- Occupancy maintains around 38.0%
- Daily rates hold near $149
Low Season (January, April, December)
- Revenue drops to average $1,170 per month
- Occupancy decreases to average 24.1%
- Daily rates adjust to average $144
Seasonality Insights for Kemmerer
- The Airbnb seasonality in Kemmerer shows highly seasonal trends requiring careful strategy. While the sections above show seasonal averages, it's also insightful to look at the extremes:
- During the high season, the absolute peak month showcases Kemmerer's highest earning potential, with monthly revenues capable of climbing to $3,100, occupancy reaching a high of 55.1%, and ADRs peaking at $155.
- Conversely, the slowest single month of the year, typically falling within the low season, marks the market's lowest point. In this month, revenue might dip to $921, occupancy could drop to 16.1%, and ADRs may adjust down to $142.
- Understanding both the seasonal averages and these monthly peaks and troughs in revenue, occupancy, and ADR is crucial for maximizing your Airbnb profit potential in Kemmerer.
Seasonal Strategies for Maximizing Profit
- Peak Season: Maximize revenue through premium pricing and potentially longer minimum stays. Ensure high availability.
- Low Season: Offer competitive pricing, special promotions (e.g., extended stay discounts), and flexible cancellation policies. Target off-season travelers like remote workers or budget-conscious guests.
- Shoulder Seasons: Implement dynamic pricing that balances peak and low rates. Target weekend travelers or specific events. Offer slightly more flexible terms than peak season.
- Regularly analyze your own performance against these Kemmerer seasonality benchmarks and adjust your pricing and availability strategy accordingly.
Best Areas for Airbnb Investment in Kemmerer (2026)
Exploring the top neighborhoods for short-term rentals in Kemmerer? This section highlights key areas, outlining why they are attractive for hosts and guests, along with notable local attractions. Consider these locations based on your target guest profile and investment strategy.
| Neighborhood / Area | Why Host Here? (Target Guests & Appeal) | Key Attractions & Landmarks |
|---|---|---|
| Downtown Kemmerer | The heart of Kemmerer with access to shops, dining, and local events. An ideal spot for visitors looking to explore the town's attractions and history. | J. C. Penney Historic District, Kemmerer City Park, Star Valley, Kemmerer Aquatic Center, local restaurants, historic theaters |
| Star Valley | A picturesque valley known for its outdoor recreational opportunities including hiking, fishing, and skiing. Perfect for nature lovers and families seeking adventure. | Star Valley Ranch, Salt River, Bridger Teton National Forest, hiking trails, snowboarding and skiing |
| Sink Canyon | A natural wonder nearby that attracts visitors interested in hiking and photography. Great for those looking to escape into nature while still close to Kemmerer. | Sink Canyon Trail, scenic viewpoints, wildlife watching |
| Kemmerer Ice Arena | A fun destination during the winter months for ice skating and hockey games. Attracts families and sports enthusiasts. | ice skating, hockey games, local sports events |
| Diamondville | A small, nearby town that offers a unique glimpse into local culture and community. Quiet and close to nature, ideal for a peaceful Airbnb experience. | local parks, small businesses, community events |
| Fossil Butte National Monument | A unique geological site attracting fossil enthusiasts and families. Offers educational opportunities and outdoor activities. | fossil exhibits, hiking trails, educational visitor center |
| Lake Vivian | A serene spot for fishing and picnicking, attracting families and outdoor enthusiasts during warmer months. | fishing, picnic areas, hiking trails, nature walks |
| Bear Lake | A beautiful lake popular in summer for vacationers. Known for its stunning views and recreational activities, including boating and swimming. | Bear Lake State Park, boating, swimming, scenic views |
Understanding Airbnb License Requirements & STR Laws in Kemmerer (2026)
While Kemmerer, Wyoming, United States currently shows low STR regulations, specific Airbnb license requirements might still exist or change. Always verify the latest short term rental regulations and Airbnb license requirements directly with local government authorities for Kemmerer to ensure full compliance before hosting.
(Source: AirROI data, 2026, finding no licensed listings among those analyzed)
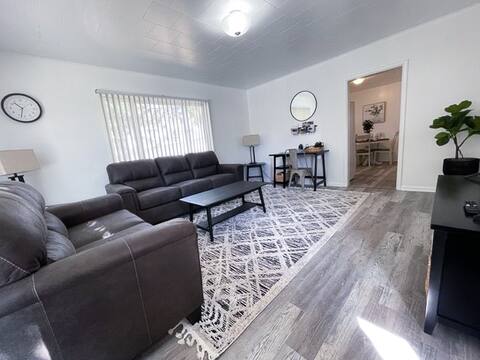
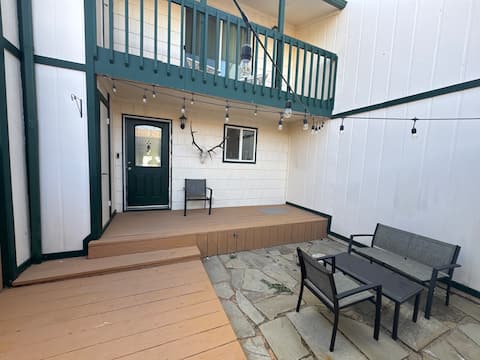
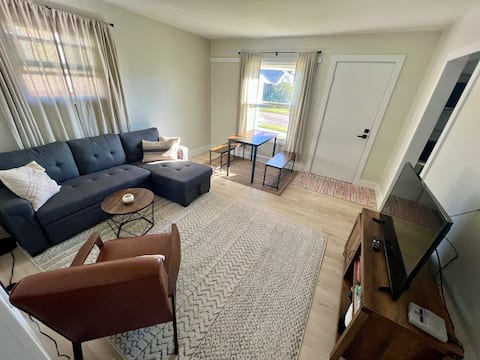
Top Performing Airbnb Properties in Kemmerer (2026)
Benchmark your potential! Explore examples of top-performing Airbnb properties in Kemmererbased on Trailing Twelve Month (TTM) revenue. Analyze their characteristics, revenue, occupancy rate, and ADR to understand what drives success in this market.

Opera House Suites Apt 3
Entire Place • 2 bedrooms
The Gem!
Entire Place • 3 bedrooms
Townhouse by the Hills
Entire Place • 3 bedrooms
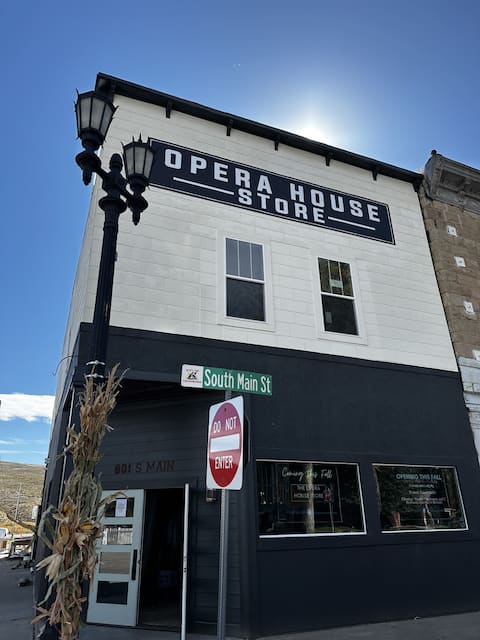
Opera House Suite 1
Entire Place • 1 bedroom
Tranquil Oasis with Views
Entire Place • 2 bedrooms

Opera House Suites Apt 2
Entire Place • 1 bedroom
Note: Performance varies based on location, size, amenities, seasonality, and management quality. Data reflects the past 12 months.
Top Performing Airbnb Hosts in Kemmerer (2026)
Learn from the best! This table showcases top-performing Airbnb hosts in Kemmerer based on the number of properties managed and estimated total revenue over the past year. Analyze their scale and performance metrics.
| Host Name | Properties | Grossing Revenue | Stay Reviews | Avg Rating |
|---|---|---|---|---|
| B B | 10 | $140,743 | 177 | 4.86/5.0 |
| Jesica | 3 | $86,401 | 78 | 4.92/5.0 |
| Kristin | 1 | $23,558 | 8 | 4.88/5.0 |
| Amy | 1 | $22,626 | 28 | 4.89/5.0 |
| Jaycee | 1 | $18,643 | 19 | 4.95/5.0 |
| Cole | 1 | $4,198 | 43 | 4.60/5.0 |
| Johnny | 1 | $1,929 | 2 | Not Rated |
| Todd | 1 | $1,617 | 62 | 4.97/5.0 |
Analyzing the strategies of top hosts, such as their property selection, pricing, and guest communication, can offer valuable lessons for optimizing your own Airbnb operations in Kemmerer.
Dive Deeper: Advanced Kemmerer STR Market Data (2026)
Ready to unlock more insights? AirROI provides access to advanced metrics and comprehensive Airbnb data for Kemmerer. Explore detailed analytics beyond this report to refine your investment strategy, optimize pricing, and maximize your vacation rental profits.
Explore Advanced MetricsKemmerer Short-Term Rental Market Composition (2026): Property & Room Types
Room Type Distribution
Property Type Distribution
Market Composition Insights for Kemmerer
- The Kemmerer Airbnb market composition is heavily skewed towards Entire Home/Apt listings, which make up 100% of the 19 active rentals. This indicates strong guest preference for privacy and space.
- Looking at the property type distribution in Kemmerer, Outdoor/Unique properties are the most common (47.4%), reflecting the local real estate landscape.
- Houses represent a significant 21.1% portion, catering likely to families or larger groups.
Kemmerer Airbnb Room Capacity Analysis (2026): Bedroom Distribution
Distribution of Listings by Number of Bedrooms
Room Capacity Insights for Kemmerer
- The dominant room capacity in Kemmerer is 1 bedroom listings, making up 73.7% of the market. This suggests a strong demand for properties suitable for couples or solo travelers.
- Together, 1 bedroom and 2 bedrooms properties represent 89.5% of the active Airbnb listings in Kemmerer, indicating a high concentration in these sizes.
- With over half the market (73.7%) consisting of studios or 1-bedroom units, Kemmerer is particularly well-suited for individuals or couples.
Kemmerer Vacation Rental Guest Capacity Trends (2026)
Distribution of Listings by Guest Capacity
Guest Capacity Insights for Kemmerer
- The most common guest capacity trend in Kemmerer vacation rentals is listings accommodating 2 guests (63.2%). This suggests the primary traveler segment is likely couples or solo travelers.
- Properties designed for 2 guests and 6 guests dominate the Kemmerer STR market, accounting for 84.3% of listings.
- A significant 63.2% of listings cater specifically to 1-2 guests, highlighting strong demand from couples and solo travelers in Kemmerer.
- 21.1% of properties accommodate 6+ guests, serving the market segment for larger families or group travel in Kemmerer.
- On average, properties in Kemmerer are equipped to host 3.2 guests.
Kemmerer Airbnb Booking Patterns (2026): Available vs. Booked Days
Available Days Distribution
Booked Days Distribution
Booking Pattern Insights for Kemmerer
- The most common availability pattern in Kemmerer falls within the 181-270 days range, representing 57.9% of listings. This suggests many properties have significant open periods on their calendars.
- Approximately 100.0% of listings show high availability (181+ days open annually), indicating potential for increased bookings or specific owner usage patterns.
- For booked days, the 91-180 days range is most frequent in Kemmerer (57.9%), reflecting common guest stay durations or potential owner blocking patterns.
Kemmerer Airbnb Minimum Stay Requirements Analysis
Distribution of Listings by Minimum Night Requirement
1 Night
4 listings
21.1% of total
2 Nights
7 listings
36.8% of total
4-6 Nights
1 listings
5.3% of total
7-29 Nights
1 listings
5.3% of total
30+ Nights
6 listings
31.6% of total
Key Insights
- The most prevalent minimum stay requirement in Kemmerer is 2 Nights, adopted by 36.8% of listings. This highlights the market's preference for shorter, flexible bookings.
- A significant segment (31.6%) caters to monthly stays (30+ nights) in Kemmerer, pointing to opportunities in the extended-stay market.
Recommendations
- Align with the market by considering a 2 Nights minimum stay, as 36.8% of Kemmerer hosts use this setting.
- If feasible, allowing 1-night stays, especially midweek or during low season, could capture last-minute bookings, as only 21.1% currently do.
- Explore offering discounts for stays of 30+ nights to attract the 31.6% of the market seeking extended stays.
- Adjust minimum nights based on seasonality – potentially shorter during low season and longer during peak demand periods in Kemmerer.
Kemmerer Airbnb Cancellation Policy Trends Analysis (2026)
Flexible
3 listings
15.8% of total
Moderate
11 listings
57.9% of total
Firm
5 listings
26.3% of total
Cancellation Policy Insights for Kemmerer
- The prevailing Airbnb cancellation policy trend in Kemmerer is Moderate, used by 57.9% of listings.
- The market strongly favors guest-friendly terms, with 73.7% of listings offering Flexible or Moderate policies. This suggests guests in Kemmerer may expect booking flexibility.
Recommendations for Hosts
- Consider adopting a Moderate policy to align with the 57.9% market standard in Kemmerer.
- Regularly review your cancellation policy against competitors and market demand shifts in Kemmerer.
Kemmerer STR Booking Lead Time Analysis (2026)
Average Booking Lead Time by Month
Booking Lead Time Insights for Kemmerer
- The overall average booking lead time for vacation rentals in Kemmerer is 30 days.
- Guests book furthest in advance for stays during August (average 60 days), likely coinciding with peak travel demand or local events.
- The shortest booking windows occur for stays in March (average 4 days), indicating more last-minute travel plans during this time.
- Seasonally, Summer (51 days avg.) sees the longest lead times, while Spring (17 days avg.) has the shortest, reflecting typical travel planning cycles.
Recommendations for Hosts
- Use the overall average lead time (30 days) as a baseline for your pricing and availability strategy in Kemmerer.
- For August stays, consider implementing length-of-stay discounts or slightly higher rates for bookings made less than 60 days out to capitalize on advance planning.
- During March, focus on last-minute booking availability and promotions, as guests book with very short notice (4 days avg.).
- Target marketing efforts for the Summer season well in advance (at least 51 days) to capture early planners.
- Monitor your own booking lead times against these Kemmerer averages to identify opportunities for dynamic pricing adjustments.
Popular & Essential Airbnb Amenities in Kemmerer (2026)
Amenity Prevalence
Amenity Insights for Kemmerer
- Essential amenities in Kemmerer that guests expect include: Free parking on premises, Kitchen, Smoke alarm. Lacking these (any) could significantly impact bookings.
- Popular amenities like TV, Wifi, Hot water are common but not universal. Offering these can provide a competitive edge.
- Warning: Wifi is not universally provided but is considered essential globally. Ensure reliable Wifi is offered.
Recommendations for Hosts
- Ensure your listing includes all essential amenities for Kemmerer: Free parking on premises, Kitchen, Smoke alarm.
- Consider adding popular differentiators like TV or Wifi to increase appeal.
- Highlight unique or less common amenities you offer (e.g., hot tub, dedicated workspace, EV charger) in your listing description and photos.
- Regularly check competitor amenities in Kemmerer to stay competitive.
Kemmerer Airbnb Guest Demographics & Profile Analysis (2026)
Guest Profile Summary for Kemmerer
- The typical guest profile for Airbnb in Kemmerer consists of primarily domestic travelers (100%), often arriving from nearby Skull Valley, typically belonging to the Post-2000s (Gen Z/Alpha) group (50%), primarily speaking English or Spanish.
- Domestic travelers account for 100.0% of guests.
- Top languages spoken are English (73.3%) followed by Spanish (20%).
- A significant demographic segment is the Post-2000s (Gen Z/Alpha) group, representing 50% of guests.
Recommendations for Hosts
- Target domestic marketing efforts towards travelers from Skull Valley and Jackson.
- Tailor amenities and listing descriptions to appeal to the dominant Post-2000s (Gen Z/Alpha) demographic (e.g., highlight fast WiFi, smart home features, local guides).
- Highlight unique local experiences or amenities relevant to the primary guest profile.
- Consider seasonal promotions aligned with peak travel times for key origin markets.
Nearby Short-Term Rental Market Comparison
How does the Kemmerer Airbnb market stack up against its neighbors? Compare key performance metrics like average monthly revenue, ADR, and occupancy rates in surrounding areas to understand the broader regional STR landscape.
| Market | Active Properties | Monthly Revenue | Daily Rate | Avg. Occupancy |
|---|---|---|---|---|
| Sundance | 61 | $6,552 | $867.92 | 33% |
| Fish Haven | 61 | $6,044 | $855.41 | 33% |
| Alta | 44 | $5,993 | $971.20 | 39% |
| Daniel | 25 | $5,231 | $693.40 | 34% |
| Brighton | 151 | $4,367 | $557.15 | 37% |
| Oakley | 12 | $4,163 | $875.37 | 32% |
| Park City | 4,036 | $4,087 | $626.69 | 34% |
| Coalville | 36 | $3,711 | $440.00 | 33% |
| Mapleton | 11 | $3,385 | $365.91 | 41% |
| Heber City | 220 | $3,287 | $497.35 | 34% |