Punta del Este Airbnb Market Analysis 2026: Short Term Rental Data & Vacation Rental Statistics in Departamento de Maldonado, Uruguay
Is Airbnb profitable in Punta del Este in 2026? Explore comprehensive Airbnb analytics for Punta del Este, Departamento de Maldonado, Uruguay to uncover income potential. This 2026 STR market report for Punta del Este, based on AirROI data from January 2025 to December 2025, reveals key trends in the niche market of 119 active listings.
Whether you're considering an Airbnb investment in Punta del Este, optimizing your existing vacation rental, or exploring rental arbitrage opportunities, understanding the Punta del Este Airbnb data is crucial. Leveraging the low regulation environment is key to maximizing your short term rental income potential. Let's dive into the specifics.
Key Punta del Este Airbnb Performance Metrics Overview
Monthly Airbnb Revenue Variations & Income Potential in Punta del Este (2026)
Understanding the monthly revenue variations for Airbnb listings in Punta del Este is key to maximizing your short term rental income potential. Seasonality significantly impacts earnings. Our analysis, based on data from the past 12 months, shows that the peak revenue month for STRs in Punta del Este is typically January, while May often presents the lowest earnings, highlighting opportunities for strategic pricing adjustments during shoulder and low seasons. Explore the typical Airbnb income in Punta del Este across different performance tiers:
- Best-in-class properties (Top 10%) achieve $4,462+ monthly, often utilizing dynamic pricing and superior guest experiences.
- Strong performing properties (Top 25%) earn $3,571 or more, indicating effective management and desirable locations/amenities.
- Typical properties (Median) generate around $1,886 per month, representing the average market performance.
- Entry-level properties (Bottom 25%) see earnings around $715, often with potential for optimization.
Average Monthly Airbnb Earnings Trend in Punta del Este
Punta del Este Airbnb Occupancy Rate Trends (2026)
Maximize your bookings by understanding the Punta del Este STR occupancy trends. Seasonal demand shifts significantly influence how often properties are booked. Typically, Marchsees the highest demand (peak season occupancy), while May experiences the lowest (low season). Effective strategies, like adjusting minimum stays or offering promotions, can boost occupancy during slower periods. Here's how different property tiers perform in Punta del Este:
- Best-in-class properties (Top 10%) achieve 63%+ occupancy, indicating high desirability and potentially optimized availability.
- Strong performing properties (Top 25%) maintain 44% or higher occupancy, suggesting good market fit and guest satisfaction.
- Typical properties (Median) have an occupancy rate around 32%.
- Entry-level properties (Bottom 25%) average 16% occupancy, potentially facing higher vacancy.
Average Monthly Occupancy Rate Trend in Punta del Este
Average Daily Rate (ADR) Airbnb Trends in Punta del Este (2026)
Effective short term rental pricing strategy in Punta del Este involves understanding monthly ADR fluctuations. The Average Daily Rate (ADR) for Airbnb in Punta del Este typically peaks in December and dips lowest during August. Leveraging Airbnb dynamic pricing tools or strategies based on this seasonality can significantly boost revenue. Here's a look at the typical nightly rates achieved:
- Best-in-class properties (Top 10%) command rates of $365+ per night, often due to premium features or locations.
- Strong performing properties (Top 25%) achieve nightly rates of $199 or more.
- Typical properties (Median) charge around $121 per night.
- Entry-level properties (Bottom 25%) earn around $87 per night.
Average Daily Rate (ADR) Trend by Month in Punta del Este
Get Live Punta del Este Market Intelligence 👇

Explore Real-time Analytics
Airbnb Seasonality Analysis & Trends in Punta del Este (2025)
Peak Season (January, March, April)
- Revenue averages $5,341 per month
- Occupancy rates average 50.5%
- Daily rates average $167
Shoulder Season
- Revenue averages $1,800 per month
- Occupancy maintains around 31.7%
- Daily rates hold near $186
Low Season (May, July, September)
- Revenue drops to average $719 per month
- Occupancy decreases to average 20.2%
- Daily rates adjust to average $170
Seasonality Insights for Punta del Este
- The Airbnb seasonality in Punta del Este shows highly seasonal trends requiring careful strategy. While the sections above show seasonal averages, it's also insightful to look at the extremes:
- During the high season, the absolute peak month showcases Punta del Este's highest earning potential, with monthly revenues capable of climbing to $6,926, occupancy reaching a high of 65.8%, and ADRs peaking at $232.
- Conversely, the slowest single month of the year, typically falling within the low season, marks the market's lowest point. In this month, revenue might dip to $644, occupancy could drop to 12.5%, and ADRs may adjust down to $153.
- Understanding both the seasonal averages and these monthly peaks and troughs in revenue, occupancy, and ADR is crucial for maximizing your Airbnb profit potential in Punta del Este.
Seasonal Strategies for Maximizing Profit
- Peak Season: Maximize revenue through premium pricing and potentially longer minimum stays. Ensure high availability.
- Low Season: Offer competitive pricing, special promotions (e.g., extended stay discounts), and flexible cancellation policies. Target off-season travelers like remote workers or budget-conscious guests.
- Shoulder Seasons: Implement dynamic pricing that balances peak and low rates. Target weekend travelers or specific events. Offer slightly more flexible terms than peak season.
- Regularly analyze your own performance against these Punta del Este seasonality benchmarks and adjust your pricing and availability strategy accordingly.
Best Areas for Airbnb Investment in Punta del Este (2026)
Exploring the top neighborhoods for short-term rentals in Punta del Este? This section highlights key areas, outlining why they are attractive for hosts and guests, along with notable local attractions. Consider these locations based on your target guest profile and investment strategy.
| Neighborhood / Area | Why Host Here? (Target Guests & Appeal) | Key Attractions & Landmarks |
|---|---|---|
| La Brava | A popular beach area known for its waves, attracting surfers and beachgoers. It's ideal for vacation rentals given its vibrant beach culture and proximity to amenities. | Playa Brava, The Finger of Punta del Este, Casapueblo, La Barra, Ralli Museum |
| La Mansa | A quieter beach area known for its calm waters, perfect for families and those seeking a relaxing getaway. It is close to various restaurants and shops, making it attractive for short-term rentals. | Playa Mansa, Punta Ballena, Conrad Punta del Este Resort & Casino, Shopping Maldonado, Mansa Beach waterfront |
| Punta Shopping | The main shopping center in Punta del Este, offering a range of shops, dining, and entertainment options. It's a hub for both locals and tourists, making rental properties here attractive for short stays. | Punta Shopping Mall, Cinemas, Restaurants, Supermarkets, Fashion stores |
| La Barra | Known for its bohemian vibe, this area is popular with younger travelers seeking nightlife and trendy eateries. Its unique architecture and laid-back atmosphere are perfect for Airbnb investments. | Brava Beach, Local artisan shops, Nightclubs, Restaurants, Street art |
| Punta del Este Downtown | The heart of Punta del Este, filled with shops, dining, and cultural attractions. A prime location for hosting Airbnb guests looking to be in the midst of the action. | Artisan Market, The Gorlero Avenue, Casino Nogaró, Punta del Este Lighthouse, Cultural Center |
| José Ignacio | A chic, upscale area that attracts high-end travelers and celebrities. Known for its stunning beaches and luxury accommodations, making it an excellent choice for premium Airbnb listings. | José Ignacio Beach, The Lighthouse of José Ignacio, Gastronomic experiences, Laguna José Ignacio, Art galleries |
| El Tesoro | A picturesque residential area with beautiful views, attracting visitors looking for a quieter, scenic stay. It offers luxury homes and a peaceful environment, appealing to families. | Beaches, Natural parks, Sunset views, Nearby golf courses, Scenic walks |
| Aguas Dulces | A tranquil beach town further from the main tourist spots, ideal for travelers seeking a quieter environment. It has a select number of cozy accommodations that appeal to those looking for relaxation. | Aguas Dulces Beach, National Park, Wildlife watching, Fishing sites, Local cuisine eateries |
Understanding Airbnb License Requirements & STR Laws in Punta del Este (2026)
While Punta del Este, Departamento de Maldonado, Uruguay currently shows low STR regulations, specific Airbnb license requirements might still exist or change. Always verify the latest short term rental regulations and Airbnb license requirements directly with local government authorities for Punta del Este to ensure full compliance before hosting.
(Source: AirROI data, 2026, finding no licensed listings among those analyzed)
Top Performing Airbnb Properties in Punta del Este (2026)
Benchmark your potential! Explore examples of top-performing Airbnb properties in Punta del Estebased on Trailing Twelve Month (TTM) revenue. Analyze their characteristics, revenue, occupancy rate, and ADR to understand what drives success in this market.
Spectacular house in El Quijote, for 2 families
Entire Place • 6 bedrooms
Chacra el silencio-paradise 10 minutes from the sea
Entire Place • 4 bedrooms

Chacra Punta del Este, 9 km from the beach
Entire Place • 3 bedrooms
Ocean view 5 bedrooms 5 bathrooms 4 garages
Entire Place • 5 bedrooms
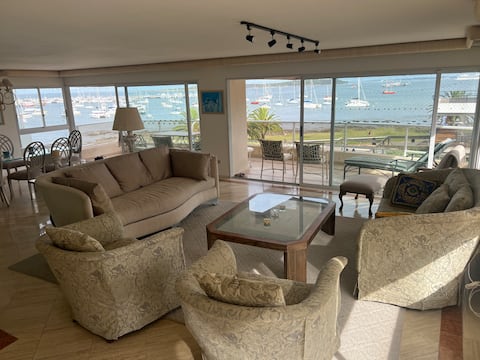
Luxury oceanfront apartment
Entire Place • 3 bedrooms
Dos Aguas house-5min from beach
Entire Place • 5 bedrooms
Note: Performance varies based on location, size, amenities, seasonality, and management quality. Data reflects the past 12 months.
Top Performing Airbnb Hosts in Punta del Este (2026)
Learn from the best! This table showcases top-performing Airbnb hosts in Punta del Este based on the number of properties managed and estimated total revenue over the past year. Analyze their scale and performance metrics.
| Host Name | Properties | Grossing Revenue | Stay Reviews | Avg Rating |
|---|---|---|---|---|
| Andrea Madelehy | 6 | $65,133 | 35 | 4.86/5.0 |
| Sofia | 1 | $63,806 | 13 | 5.00/5.0 |
| Vicky | 1 | $43,496 | 30 | 4.97/5.0 |
| Josefina | 1 | $37,291 | 3 | 5.00/5.0 |
| Delia | 1 | $37,239 | 6 | 5.00/5.0 |
| Antonio Jose | 1 | $31,750 | 4 | 5.00/5.0 |
| Leandro Pablo | 2 | $29,775 | 31 | 4.97/5.0 |
| Angela | 1 | $26,262 | 1 | Not Rated |
| Leonor | 1 | $21,885 | 19 | 4.89/5.0 |
| Pablo | 1 | $20,526 | 4 | 4.75/5.0 |
Analyzing the strategies of top hosts, such as their property selection, pricing, and guest communication, can offer valuable lessons for optimizing your own Airbnb operations in Punta del Este.
Dive Deeper: Advanced Punta del Este STR Market Data (2026)
Ready to unlock more insights? AirROI provides access to advanced metrics and comprehensive Airbnb data for Punta del Este. Explore detailed analytics beyond this report to refine your investment strategy, optimize pricing, and maximize your vacation rental profits.
Explore Advanced MetricsPunta del Este Short-Term Rental Market Composition (2026): Property & Room Types
Room Type Distribution
Property Type Distribution
Market Composition Insights for Punta del Este
- The Punta del Este Airbnb market composition is heavily skewed towards Entire Home/Apt listings, which make up 93.3% of the 119 active rentals. This indicates strong guest preference for privacy and space.
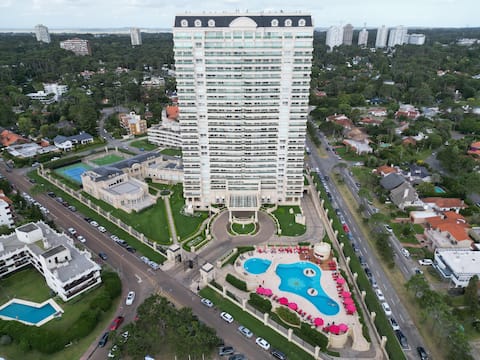
- Looking at the property type distribution in Punta del Este, Apartment/Condo properties are the most common (78.2%), reflecting the local real estate landscape.
- The presence of 7.6% Hotel/Boutique listings indicates integration with traditional hospitality.
- Smaller segments like outdoor/unique (combined 1.7%) offer potential for unique stay experiences.
Punta del Este Airbnb Room Capacity Analysis (2026): Bedroom Distribution
Distribution of Listings by Number of Bedrooms
Room Capacity Insights for Punta del Este
- The dominant room capacity in Punta del Este is 1 bedroom listings, making up 43.7% of the market. This suggests a strong demand for properties suitable for couples or solo travelers.
- Together, 1 bedroom and 2 bedrooms properties represent 69.8% of the active Airbnb listings in Punta del Este, indicating a high concentration in these sizes.
- A significant 26.1% of listings offer 3+ bedrooms, catering to larger groups and families seeking more space in Punta del Este.
Punta del Este Vacation Rental Guest Capacity Trends (2026)
Distribution of Listings by Guest Capacity
Guest Capacity Insights for Punta del Este
- The most common guest capacity trend in Punta del Este vacation rentals is listings accommodating 2 guests (27.7%). This suggests the primary traveler segment is likely couples or solo travelers.
- Properties designed for 2 guests and 4 guests dominate the Punta del Este STR market, accounting for 52.1% of listings.
- 24.3% of properties accommodate 6+ guests, serving the market segment for larger families or group travel in Punta del Este.
- On average, properties in Punta del Este are equipped to host 4.2 guests.
Punta del Este Airbnb Booking Patterns (2026): Available vs. Booked Days
Available Days Distribution
Booked Days Distribution
Booking Pattern Insights for Punta del Este
- The most common availability pattern in Punta del Este falls within the 271-366 days range, representing 92.4% of listings. This suggests many properties have significant open periods on their calendars.
- Approximately 100.0% of listings show high availability (181+ days open annually), indicating potential for increased bookings or specific owner usage patterns.
- For booked days, the 1-30 days range is most frequent in Punta del Este (50.4%), reflecting common guest stay durations or potential owner blocking patterns.
Punta del Este Airbnb Minimum Stay Requirements Analysis
Distribution of Listings by Minimum Night Requirement
1 Night
16 listings
13.4% of total
2 Nights
19 listings
16% of total
3 Nights
8 listings
6.7% of total
4-6 Nights
14 listings
11.8% of total
7-29 Nights
10 listings
8.4% of total
30+ Nights
52 listings
43.7% of total
Key Insights
- The most prevalent minimum stay requirement in Punta del Este is 30+ Nights, adopted by 43.7% of listings. This highlights the market's preference for longer commitments.
- A significant segment (43.7%) caters to monthly stays (30+ nights) in Punta del Este, pointing to opportunities in the extended-stay market.
Recommendations
- Align with the market by considering a 30+ Nights minimum stay, as 43.7% of Punta del Este hosts use this setting.
- If feasible, allowing 1-night stays, especially midweek or during low season, could capture last-minute bookings, as only 13.4% currently do.
- Explore offering discounts for stays of 30+ nights to attract the 43.7% of the market seeking extended stays.
- Adjust minimum nights based on seasonality – potentially shorter during low season and longer during peak demand periods in Punta del Este.
Punta del Este Airbnb Cancellation Policy Trends Analysis (2026)
Limited
5 listings
4.2% of total
Super Strict 30 Days
2 listings
1.7% of total
Flexible
26 listings
21.8% of total
Moderate
26 listings
21.8% of total
Firm
48 listings
40.3% of total
Strict
12 listings
10.1% of total
Cancellation Policy Insights for Punta del Este
- The prevailing Airbnb cancellation policy trend in Punta del Este is Firm, used by 40.3% of listings.
- A majority (50.4%) of hosts in Punta del Este utilize Firm or Strict policies, indicating a market where hosts prioritize booking security.
Recommendations for Hosts
- Consider adopting a Firm policy to align with the 40.3% market standard in Punta del Este.
- Using a Strict policy might deter some guests, as only 10.1% of listings use it. Evaluate if potential revenue protection outweighs possible lower booking rates.
- Regularly review your cancellation policy against competitors and market demand shifts in Punta del Este.
Punta del Este STR Booking Lead Time Analysis (2026)
Average Booking Lead Time by Month
Booking Lead Time Insights for Punta del Este
- The overall average booking lead time for vacation rentals in Punta del Este is 38 days.
- Guests book furthest in advance for stays during December (average 35 days), likely coinciding with peak travel demand or local events.
- The shortest booking windows occur for stays in May (average 2 days), indicating more last-minute travel plans during this time.
- Seasonally, Winter (32 days avg.) sees the longest lead times, while Summer (11 days avg.) has the shortest, reflecting typical travel planning cycles.
Recommendations for Hosts
- Use the overall average lead time (38 days) as a baseline for your pricing and availability strategy in Punta del Este.
- During May, focus on last-minute booking availability and promotions, as guests book with very short notice (2 days avg.).
- Target marketing efforts for the Winter season well in advance (at least 32 days) to capture early planners.
- Monitor your own booking lead times against these Punta del Este averages to identify opportunities for dynamic pricing adjustments.
Popular & Essential Airbnb Amenities in Punta del Este (2026)
Amenity Prevalence
Amenity Insights for Punta del Este
- Essential amenities in Punta del Este that guests expect include: Wifi, TV. Lacking these (any) could significantly impact bookings.
- Popular amenities like Kitchen, Air conditioning, Free parking on premises are common but not universal. Offering these can provide a competitive edge.
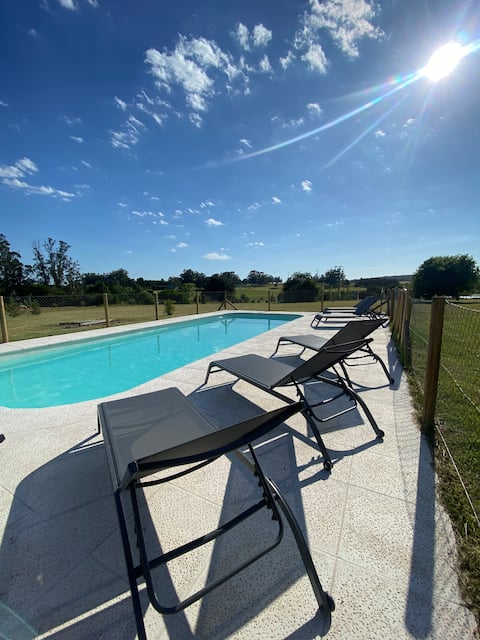
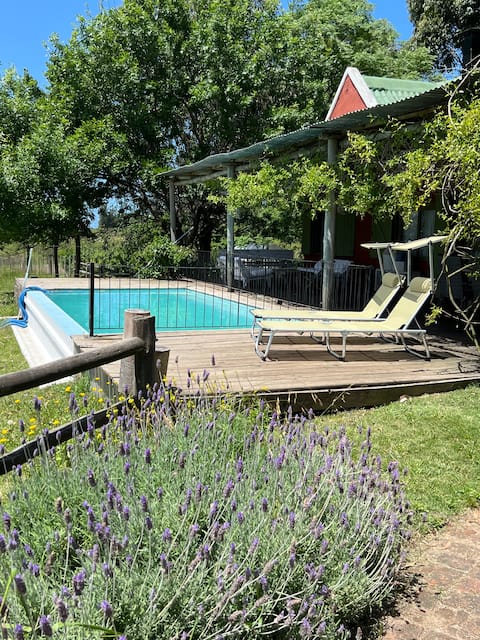
- A pool is a highly desired but not standard amenity, making it a key feature for attracting guests seeking leisure in Punta del Este.
Recommendations for Hosts
- Ensure your listing includes all essential amenities for Punta del Este: Wifi, TV.
- Prioritize adding missing essentials: Wifi, TV.
- Consider adding popular differentiators like Kitchen or Air conditioning to increase appeal.
- Highlight unique or less common amenities you offer (e.g., hot tub, dedicated workspace, EV charger) in your listing description and photos.
- Regularly check competitor amenities in Punta del Este to stay competitive.
Punta del Este Airbnb Guest Demographics & Profile Analysis (2026)
Guest Profile Summary for Punta del Este
- The typical guest profile for Airbnb in Punta del Este consists of a mix of domestic (56%) and international guests, often arriving from nearby Montevideo, typically belonging to the Post-2000s (Gen Z/Alpha) group (50%), primarily speaking Spanish or English.
- Domestic travelers account for 55.7% of guests.
- Key international markets include Uruguay (55.7%) and Argentina (17.3%).
- Top languages spoken are Spanish (40.8%) followed by English (34.9%).
- A significant demographic segment is the Post-2000s (Gen Z/Alpha) group, representing 50% of guests.
Recommendations for Hosts
- Balance marketing efforts between domestic and international channels based on the guest mix.
- Tailor amenities and listing descriptions to appeal to the dominant Post-2000s (Gen Z/Alpha) demographic (e.g., highlight fast WiFi, smart home features, local guides).
- Highlight unique local experiences or amenities relevant to the primary guest profile.
- Consider seasonal promotions aligned with peak travel times for key origin markets.
Nearby Short-Term Rental Market Comparison
How does the Punta del Este Airbnb market stack up against its neighbors? Compare key performance metrics like average monthly revenue, ADR, and occupancy rates in surrounding areas to understand the broader regional STR landscape.
| Market | Active Properties | Monthly Revenue | Daily Rate | Avg. Occupancy |
|---|---|---|---|---|
| Departamento de Lavalleja | 10 | $1,739 | $112.41 | 46% |
| San Rafael - El Placer | 142 | $1,626 | $389.91 | 30% |
| José Ignacio | 265 | $1,593 | $385.03 | 31% |
| La Barra | 231 | $1,586 | $403.94 | 32% |
| Arenas de José Ignacio | 28 | $1,554 | $496.14 | 26% |
| Departamento de Maldonado | 22 | $1,417 | $201.99 | 27% |
| Manantiales | 114 | $1,408 | $324.08 | 31% |
| San Carlos | 23 | $1,387 | $182.91 | 30% |
| Pan de Azúcar | 23 | $1,331 | $240.15 | 24% |
| Punta Ballena | 597 | $1,285 | $200.46 | 33% |