Samarkand City Airbnb Market Analysis 2026: Short Term Rental Data & Vacation Rental Statistics in Samarqand Region, Uzbekistan
Is Airbnb profitable in Samarkand City in 2026? Explore comprehensive Airbnb analytics for Samarkand City, Samarqand Region, Uzbekistan to uncover income potential. This 2026 STR market report for Samarkand City, based on AirROI data from February 2025 to January 2026, reveals key trends in the niche market of 109 active listings.
Whether you're considering an Airbnb investment in Samarkand City, optimizing your existing vacation rental, or exploring rental arbitrage opportunities, understanding the Samarkand City Airbnb data is crucial. Leveraging the low regulation environment is key to maximizing your short term rental income potential. Let's dive into the specifics.
Key Samarkand City Airbnb Performance Metrics Overview
Monthly Airbnb Revenue Variations & Income Potential in Samarkand City (2026)
Understanding the monthly revenue variations for Airbnb listings in Samarkand City is key to maximizing your short term rental income potential. Seasonality significantly impacts earnings. Our analysis, based on data from the past 12 months, shows that the peak revenue month for STRs in Samarkand City is typically October, while July often presents the lowest earnings, highlighting opportunities for strategic pricing adjustments during shoulder and low seasons. Explore the typical Airbnb income in Samarkand City across different performance tiers:
- Best-in-class properties (Top 10%) achieve $912+ monthly, often utilizing dynamic pricing and superior guest experiences.
- Strong performing properties (Top 25%) earn $577 or more, indicating effective management and desirable locations/amenities.
- Typical properties (Median) generate around $299 per month, representing the average market performance.
- Entry-level properties (Bottom 25%) see earnings around $153, often with potential for optimization.
Average Monthly Airbnb Earnings Trend in Samarkand City
Samarkand City Airbnb Occupancy Rate Trends (2026)
Maximize your bookings by understanding the Samarkand City STR occupancy trends. Seasonal demand shifts significantly influence how often properties are booked. Typically, Septembersees the highest demand (peak season occupancy), while February experiences the lowest (low season). Effective strategies, like adjusting minimum stays or offering promotions, can boost occupancy during slower periods. Here's how different property tiers perform in Samarkand City:
- Best-in-class properties (Top 10%) achieve 65%+ occupancy, indicating high desirability and potentially optimized availability.
- Strong performing properties (Top 25%) maintain 47% or higher occupancy, suggesting good market fit and guest satisfaction.
- Typical properties (Median) have an occupancy rate around 26%.
- Entry-level properties (Bottom 25%) average 13% occupancy, potentially facing higher vacancy.
Average Monthly Occupancy Rate Trend in Samarkand City
Average Daily Rate (ADR) Airbnb Trends in Samarkand City (2026)
Effective short term rental pricing strategy in Samarkand City involves understanding monthly ADR fluctuations. The Average Daily Rate (ADR) for Airbnb in Samarkand City typically peaks in September and dips lowest during February. Leveraging Airbnb dynamic pricing tools or strategies based on this seasonality can significantly boost revenue. Here's a look at the typical nightly rates achieved:
- Best-in-class properties (Top 10%) command rates of $76+ per night, often due to premium features or locations.
- Strong performing properties (Top 25%) achieve nightly rates of $55 or more.
- Typical properties (Median) charge around $42 per night.
- Entry-level properties (Bottom 25%) earn around $33 per night.
Average Daily Rate (ADR) Trend by Month in Samarkand City
Get Live Samarkand City Market Intelligence 👇

Explore Real-time Analytics
Airbnb Seasonality Analysis & Trends in Samarkand City (2026)
Peak Season (October, May, September)
- Revenue averages $528 per month
- Occupancy rates average 39.7%
- Daily rates average $58
Shoulder Season
- Revenue averages $411 per month
- Occupancy maintains around 30.4%
- Daily rates hold near $57
Low Season (January, July, December)
- Revenue drops to average $325 per month
- Occupancy decreases to average 25.1%
- Daily rates adjust to average $57
Seasonality Insights for Samarkand City
- The Airbnb seasonality in Samarkand City shows moderate seasonality with distinct peak and low periods. While the sections above show seasonal averages, it's also insightful to look at the extremes:
- During the high season, the absolute peak month showcases Samarkand City's highest earning potential, with monthly revenues capable of climbing to $543, occupancy reaching a high of 40.6%, and ADRs peaking at $59.
- Conversely, the slowest single month of the year, typically falling within the low season, marks the market's lowest point. In this month, revenue might dip to $303, occupancy could drop to 22.9%, and ADRs may adjust down to $56.
- Understanding both the seasonal averages and these monthly peaks and troughs in revenue, occupancy, and ADR is crucial for maximizing your Airbnb profit potential in Samarkand City.
Seasonal Strategies for Maximizing Profit
- Peak Season: Maximize revenue through premium pricing and potentially longer minimum stays. Ensure high availability.
- Low Season: Offer competitive pricing, special promotions (e.g., extended stay discounts), and flexible cancellation policies. Target off-season travelers like remote workers or budget-conscious guests.
- Shoulder Seasons: Implement dynamic pricing that balances peak and low rates. Target weekend travelers or specific events. Offer slightly more flexible terms than peak season.
- Regularly analyze your own performance against these Samarkand City seasonality benchmarks and adjust your pricing and availability strategy accordingly.
Best Areas for Airbnb Investment in Samarkand City (2026)
Exploring the top neighborhoods for short-term rentals in Samarkand City? This section highlights key areas, outlining why they are attractive for hosts and guests, along with notable local attractions. Consider these locations based on your target guest profile and investment strategy.
| Neighborhood / Area | Why Host Here? (Target Guests & Appeal) | Key Attractions & Landmarks |
|---|---|---|
| Registan Square | The heart of Samarkand, known for its stunning architectural ensembles and historical significance. A must-visit for tourists interested in culture and history, making it a prime location for short-term rentals. | Registan Square, Ulugh Beg Madrasah, Sher-Dor Madrasah, Tilya Kori Madrasah, Bibi Khanym Mosque, Shah-i-Zinda |
| Shah-i-Zinda | A beautiful necropolis and a UNESCO World Heritage site, loved for its intricate tilework and historical importance. Attracts many history enthusiasts and travelers seeking cultural experiences. | Shah-i-Zinda Complex, Tomb of Qusam Ibn Abbas, Tomb of Tamerlane, Ancient ruins nearby, Local artisan shops |
| Bibi Khanym Mosque | An iconic mosque with stunning architecture that reflects the grandeur of ancient Samarkand. A popular spot for tourists, offering potential for hosting visitors interested in historical sites. | Bibi Khanym Mosque, Local market near the mosque, Beautiful gardens, Views of the city |
| Siyob Bazaar | The main market in Samarkand, offering a vibrant atmosphere filled with local food, crafts, and culture. A great spot for tourists to immerse themselves in local life. | Local food stalls, Craft shops, Cultural performances, Vibrant marketplace atmosphere |
| Gur-e Amir | The mausoleum of Timur (Tamerlane), a stunning example of Islamic architecture that draws many history buffs and tourists alike. Perfect for those wanting to stay near significant landmarks. | Gur-e Amir mausoleum, Historical tours, Guided visits, Nearby gardens |
| Samarkand Silk Road Museum | A museum dedicated to the history of the Silk Road and its cultural heritage. Attracts visitors interested in history and the arts, offering a unique Airbnb experience for tourists. | Silk Road exhibits, Cultural events, Workshops, Historical artifacts |
| Local Cafes and Restaurants Area | Vibrant local dining scene with traditional Uzbek cuisine that attracts food lovers and tourists looking for authentic experiences. Great for Airbnb to host food enthusiasts. | Local cuisine, Street food, Cultural performances, Scenic views of the city |
| Historical Park Areas | Parks and gardens that showcase the natural beauty of Samarkand, perfect for relaxation and leisure. Ideal for visitors looking to enjoy tranquility amidst history. | Parks, Gardens, Picnic areas, Cultural events |
Understanding Airbnb License Requirements & STR Laws in Samarkand City (2026)
While Samarkand City, Samarqand Region, Uzbekistan currently shows low STR regulations, specific Airbnb license requirements might still exist or change. Always verify the latest short term rental regulations and Airbnb license requirements directly with local government authorities for Samarkand City to ensure full compliance before hosting.
(Source: AirROI data, 2026, finding no licensed listings among those analyzed)
Top Performing Airbnb Properties in Samarkand City (2026)
Benchmark your potential! Explore examples of top-performing Airbnb properties in Samarkand Citybased on Trailing Twelve Month (TTM) revenue. Analyze their characteristics, revenue, occupancy rate, and ADR to understand what drives success in this market.
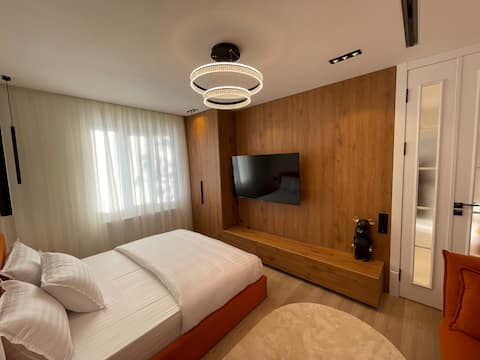
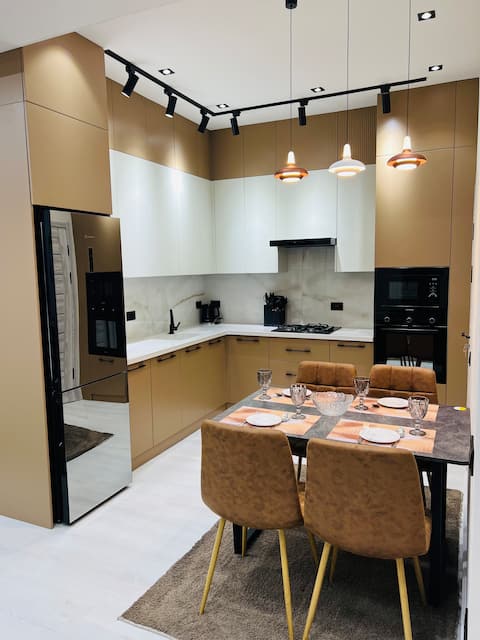
Home is a modern apartment and home comfort
Entire Place • 2 bedrooms
3-room apartment near Registan
Entire Place • 2 bedrooms

Stylish 2 Bedrooms Apt Opposite Registan Square
Entire Place • 2 bedrooms

Wonderful place to stay in Samarkand, Registan Sq
Entire Place • 1 bedroom

Overlooking Registan Square 2 Bed Modern Apartment
Entire Place • 2 bedrooms

New Deluxe 2-Bed Apt / Ground Floor - PrimeStay
Entire Place • 2 bedrooms
Note: Performance varies based on location, size, amenities, seasonality, and management quality. Data reflects the past 12 months.
Top Performing Airbnb Hosts in Samarkand City (2026)
Learn from the best! This table showcases top-performing Airbnb hosts in Samarkand City based on the number of properties managed and estimated total revenue over the past year. Analyze their scale and performance metrics.
| Host Name | Properties | Grossing Revenue | Stay Reviews | Avg Rating |
|---|---|---|---|---|
| Vohid | 10 | $41,515 | 917 | 4.77/5.0 |
| Farhod | 7 | $39,807 | 192 | 4.94/5.0 |
| Sardor | 13 | $22,890 | 93 | 4.59/5.0 |
| Sherzod | 3 | $20,934 | 90 | 4.93/5.0 |
| Ozod Apartments | 5 | $18,049 | 44 | 4.49/5.0 |
| Давлат | 2 | $17,105 | 167 | 4.96/5.0 |
| Sardor | 3 | $13,426 | 22 | 4.72/5.0 |
| Jafar | 1 | $12,755 | 55 | 4.91/5.0 |
| Farrux | 4 | $12,342 | 20 | 5.00/5.0 |
| Aziza | 1 | $10,382 | 116 | 4.97/5.0 |
Analyzing the strategies of top hosts, such as their property selection, pricing, and guest communication, can offer valuable lessons for optimizing your own Airbnb operations in Samarkand City.
Dive Deeper: Advanced Samarkand City STR Market Data (2026)
Ready to unlock more insights? AirROI provides access to advanced metrics and comprehensive Airbnb data for Samarkand City. Explore detailed analytics beyond this report to refine your investment strategy, optimize pricing, and maximize your vacation rental profits.
Explore Advanced MetricsSamarkand City Short-Term Rental Market Composition (2026): Property & Room Types
Room Type Distribution
Property Type Distribution
Market Composition Insights for Samarkand City
- The Samarkand City Airbnb market composition is heavily skewed towards Entire Home/Apt listings, which make up 67% of the 109 active rentals. This indicates strong guest preference for privacy and space.
- However, a notable 29.4% share for Private Rooms suggests opportunities for budget-conscious travelers or hosts renting out spare rooms.
- Looking at the property type distribution in Samarkand City, Apartment/Condo properties are the most common (60.6%), reflecting the local real estate landscape.
- The presence of 29.4% Hotel/Boutique listings indicates integration with traditional hospitality.
- Smaller segments like others (combined 0.9%) offer potential for unique stay experiences.
Samarkand City Airbnb Room Capacity Analysis (2026): Bedroom Distribution
Distribution of Listings by Number of Bedrooms
Room Capacity Insights for Samarkand City
- The dominant room capacity in Samarkand City is 1 bedroom listings, making up 46.8% of the market. This suggests a strong demand for properties suitable for couples or solo travelers.
- Together, 1 bedroom and 2 bedrooms properties represent 80.7% of the active Airbnb listings in Samarkand City, indicating a high concentration in these sizes.
Samarkand City Vacation Rental Guest Capacity Trends (2026)
Distribution of Listings by Guest Capacity
Guest Capacity Insights for Samarkand City
- The most common guest capacity trend in Samarkand City vacation rentals is listings accommodating 4 guests (25.7%). This suggests the primary traveler segment is likely small families or groups.
- Properties designed for 4 guests and 3 guests dominate the Samarkand City STR market, accounting for 49.6% of listings.
- 13.7% of properties accommodate 6+ guests, serving the market segment for larger families or group travel in Samarkand City.
- On average, properties in Samarkand City are equipped to host 3.4 guests.
Samarkand City Airbnb Booking Patterns (2026): Available vs. Booked Days
Available Days Distribution
Booked Days Distribution
Booking Pattern Insights for Samarkand City
- The most common availability pattern in Samarkand City falls within the 271-366 days range, representing 66.1% of listings. This suggests many properties have significant open periods on their calendars.
- Approximately 92.7% of listings show high availability (181+ days open annually), indicating potential for increased bookings or specific owner usage patterns.
- For booked days, the 1-30 days range is most frequent in Samarkand City (36.7%), reflecting common guest stay durations or potential owner blocking patterns.
- A notable 7.3% of properties secure long booking periods (181+ days booked per year), highlighting successful long-term rental strategies or significant owner usage.
Samarkand City Airbnb Minimum Stay Requirements Analysis
Distribution of Listings by Minimum Night Requirement
1 Night
85 listings
78% of total
2 Nights
13 listings
11.9% of total
4-6 Nights
4 listings
3.7% of total
30+ Nights
7 listings
6.4% of total
Key Insights
- The most prevalent minimum stay requirement in Samarkand City is 1 Night, adopted by 78% of listings. This highlights the market's preference for shorter, flexible bookings.
- A strong majority (89.9%) of the Samarkand City Airbnb data shows acceptance of very short stays (1-2 nights), indicating a dynamic, high-turnover market.
Recommendations
- Align with the market by considering a 1 Night minimum stay, as 78% of Samarkand City hosts use this setting.
- Explore offering discounts for stays of 30+ nights to attract the 6.4% of the market seeking extended stays.
- Adjust minimum nights based on seasonality – potentially shorter during low season and longer during peak demand periods in Samarkand City.
Samarkand City Airbnb Cancellation Policy Trends Analysis (2026)
Flexible
83 listings
76.1% of total
Moderate
16 listings
14.7% of total
Firm
10 listings
9.2% of total
Cancellation Policy Insights for Samarkand City
- The prevailing Airbnb cancellation policy trend in Samarkand City is Flexible, used by 76.1% of listings.
- The market strongly favors guest-friendly terms, with 90.8% of listings offering Flexible or Moderate policies. This suggests guests in Samarkand City may expect booking flexibility.
Recommendations for Hosts
- Consider adopting a Flexible policy to align with the 76.1% market standard in Samarkand City.
- Given the high prevalence of Flexible policies (76.1%), offering this can enhance booking appeal, especially during shoulder seasons.
- Regularly review your cancellation policy against competitors and market demand shifts in Samarkand City.
Samarkand City STR Booking Lead Time Analysis (2026)
Average Booking Lead Time by Month
Booking Lead Time Insights for Samarkand City
- The overall average booking lead time for vacation rentals in Samarkand City is 28 days.
- Guests book furthest in advance for stays during October (average 47 days), likely coinciding with peak travel demand or local events.
- The shortest booking windows occur for stays in December (average 15 days), indicating more last-minute travel plans during this time.
- Seasonally, Fall (37 days avg.) sees the longest lead times, while Winter (24 days avg.) has the shortest, reflecting typical travel planning cycles.
Recommendations for Hosts
- Use the overall average lead time (28 days) as a baseline for your pricing and availability strategy in Samarkand City.
- For October stays, consider implementing length-of-stay discounts or slightly higher rates for bookings made less than 47 days out to capitalize on advance planning.
- Target marketing efforts for the Fall season well in advance (at least 37 days) to capture early planners.
- Monitor your own booking lead times against these Samarkand City averages to identify opportunities for dynamic pricing adjustments.
Popular & Essential Airbnb Amenities in Samarkand City (2026)
Amenity Prevalence
Amenity Insights for Samarkand City
- Essential amenities in Samarkand City that guests expect include: Wifi, Air conditioning. Lacking these (any) could significantly impact bookings.
- Popular amenities like Kitchen, TV, Washer are common but not universal. Offering these can provide a competitive edge.
Recommendations for Hosts
- Ensure your listing includes all essential amenities for Samarkand City: Wifi, Air conditioning.
- Prioritize adding missing essentials: Wifi, Air conditioning.
- Consider adding popular differentiators like Kitchen or TV to increase appeal.
- Highlight unique or less common amenities you offer (e.g., hot tub, dedicated workspace, EV charger) in your listing description and photos.
- Regularly check competitor amenities in Samarkand City to stay competitive.
Samarkand City Airbnb Guest Demographics & Profile Analysis (2026)
Guest Profile Summary for Samarkand City
- The typical guest profile for Airbnb in Samarkand City consists of predominantly international visitors (99%), with top international origins including United Kingdom, typically belonging to the Post-2000s (Gen Z/Alpha) group (50%), primarily speaking English or French.
- Domestic travelers account for 1.5% of guests.
- Key international markets include United States (11.2%) and United Kingdom (9.2%).
- Top languages spoken are English (40.2%) followed by French (9.5%).
- A significant demographic segment is the Post-2000s (Gen Z/Alpha) group, representing 50% of guests.
Recommendations for Hosts
- Focus marketing internationally, particularly towards travelers from United Kingdom.
- Tailor amenities and listing descriptions to appeal to the dominant Post-2000s (Gen Z/Alpha) demographic (e.g., highlight fast WiFi, smart home features, local guides).
- Highlight unique local experiences or amenities relevant to the primary guest profile.
- Consider seasonal promotions aligned with peak travel times for key origin markets.