Boca de Aroa Airbnb Market Analysis 2026: Short Term Rental Data & Vacation Rental Statistics in Falcon State, Venezuela
Is Airbnb profitable in Boca de Aroa in 2026? Explore comprehensive Airbnb analytics for Boca de Aroa, Falcon State, Venezuela to uncover income potential. This 2026 STR market report for Boca de Aroa, based on AirROI data from January 2025 to December 2025, reveals key trends in the niche market of 19 active listings.
Whether you're considering an Airbnb investment in Boca de Aroa, optimizing your existing vacation rental, or exploring rental arbitrage opportunities, understanding the Boca de Aroa Airbnb data is crucial. Leveraging the low regulation environment is key to maximizing your short term rental income potential. Let's dive into the specifics.
Key Boca de Aroa Airbnb Performance Metrics Overview
Monthly Airbnb Revenue Variations & Income Potential in Boca de Aroa (2026)
Understanding the monthly revenue variations for Airbnb listings in Boca de Aroa is key to maximizing your short term rental income potential. Seasonality significantly impacts earnings. Our analysis, based on data from the past 12 months, shows that the peak revenue month for STRs in Boca de Aroa is typically August, while November often presents the lowest earnings, highlighting opportunities for strategic pricing adjustments during shoulder and low seasons. Explore the typical Airbnb income in Boca de Aroa across different performance tiers:
- Best-in-class properties (Top 10%) achieve $1,144+ monthly, often utilizing dynamic pricing and superior guest experiences.
- Strong performing properties (Top 25%) earn $701 or more, indicating effective management and desirable locations/amenities.
- Typical properties (Median) generate around $439 per month, representing the average market performance.
- Entry-level properties (Bottom 25%) see earnings around $273, often with potential for optimization.
Average Monthly Airbnb Earnings Trend in Boca de Aroa
Boca de Aroa Airbnb Occupancy Rate Trends (2026)
Maximize your bookings by understanding the Boca de Aroa STR occupancy trends. Seasonal demand shifts significantly influence how often properties are booked. Typically, Augustsees the highest demand (peak season occupancy), while June experiences the lowest (low season). Effective strategies, like adjusting minimum stays or offering promotions, can boost occupancy during slower periods. Here's how different property tiers perform in Boca de Aroa:
- Best-in-class properties (Top 10%) achieve 40%+ occupancy, indicating high desirability and potentially optimized availability.
- Strong performing properties (Top 25%) maintain 30% or higher occupancy, suggesting good market fit and guest satisfaction.
- Typical properties (Median) have an occupancy rate around 18%.
- Entry-level properties (Bottom 25%) average 12% occupancy, potentially facing higher vacancy.
Average Monthly Occupancy Rate Trend in Boca de Aroa
Average Daily Rate (ADR) Airbnb Trends in Boca de Aroa (2026)
Effective short term rental pricing strategy in Boca de Aroa involves understanding monthly ADR fluctuations. The Average Daily Rate (ADR) for Airbnb in Boca de Aroa typically peaks in January and dips lowest during November. Leveraging Airbnb dynamic pricing tools or strategies based on this seasonality can significantly boost revenue. Here's a look at the typical nightly rates achieved:
- Best-in-class properties (Top 10%) command rates of $142+ per night, often due to premium features or locations.
- Strong performing properties (Top 25%) achieve nightly rates of $99 or more.
- Typical properties (Median) charge around $78 per night.
- Entry-level properties (Bottom 25%) earn around $60 per night.
Average Daily Rate (ADR) Trend by Month in Boca de Aroa
Get Live Boca de Aroa Market Intelligence 👇
Explore Real-time Analytics
Airbnb Seasonality Analysis & Trends in Boca de Aroa (2025)
Peak Season (August, January, March)
- Revenue averages $837 per month
- Occupancy rates average 30.2%
- Daily rates average $88
Shoulder Season
- Revenue averages $542 per month
- Occupancy maintains around 21.4%
- Daily rates hold near $85
Low Season (May, June, November)
- Revenue drops to average $339 per month
- Occupancy decreases to average 14.2%
- Daily rates adjust to average $85
Seasonality Insights for Boca de Aroa
- The Airbnb seasonality in Boca de Aroa shows highly seasonal trends requiring careful strategy. While the sections above show seasonal averages, it's also insightful to look at the extremes:
- During the high season, the absolute peak month showcases Boca de Aroa's highest earning potential, with monthly revenues capable of climbing to $905, occupancy reaching a high of 39.2%, and ADRs peaking at $93.
- Conversely, the slowest single month of the year, typically falling within the low season, marks the market's lowest point. In this month, revenue might dip to $326, occupancy could drop to 13.7%, and ADRs may adjust down to $81.
- Understanding both the seasonal averages and these monthly peaks and troughs in revenue, occupancy, and ADR is crucial for maximizing your Airbnb profit potential in Boca de Aroa.
Seasonal Strategies for Maximizing Profit
- Peak Season: Maximize revenue through premium pricing and potentially longer minimum stays. Ensure high availability.
- Low Season: Offer competitive pricing, special promotions (e.g., extended stay discounts), and flexible cancellation policies. Target off-season travelers like remote workers or budget-conscious guests.
- Shoulder Seasons: Implement dynamic pricing that balances peak and low rates. Target weekend travelers or specific events. Offer slightly more flexible terms than peak season.
- Regularly analyze your own performance against these Boca de Aroa seasonality benchmarks and adjust your pricing and availability strategy accordingly.
Best Areas for Airbnb Investment in Boca de Aroa (2026)
Exploring the top neighborhoods for short-term rentals in Boca de Aroa? This section highlights key areas, outlining why they are attractive for hosts and guests, along with notable local attractions. Consider these locations based on your target guest profile and investment strategy.
| Neighborhood / Area | Why Host Here? (Target Guests & Appeal) | Key Attractions & Landmarks |
|---|---|---|
| Playa Medina | A beautiful beach known for its tranquil waters and stunning natural surroundings. Ideal for tourists seeking relaxation and beach activities. | Beachfront relaxation, Water sports, Nature hikes, Scenic views |
| Copey | A serene and picturesque village near the coast, perfect for those looking to escape the hustle and bustle. Offers a sense of peace and connection with nature. | Local markets, Nature trails, Cultural experiences |
| Cayo de Agua | A remote paradise known for its unspoiled beaches and crystal clear waters. Attracts adventure seekers and eco-tourists. | Crystal clear beaches, Snorkeling, Wildlife watching |
| Las Cumaraguas | A locality that offers a mix of cultural experiences and natural beauty, making it a versatile choice for visitors. | Local cuisine, Cultural festivals, Natural landmarks |
| Mochima National Park | An ecological wonder known for its diverse marine life and scenic landscapes. Great for eco-tourism and nature lovers. | Diving and snorkeling, Hiking trails, Wildlife tours |
| Parque Nacional Morrocoy | Famous for its mangroves and beautiful islets, attracting families and groups seeking nature-based recreation. | Boat tours, Isla de Los Tesoros, Bird watching |
| Pueblo de Aroa | A quaint and charming town appealing to cultural tourists looking to explore local life and traditions. | Historical sites, Local artisans, Community events |
| Falcon State Beaches | Offering a variety of beach experiences from lively to peaceful spots, catering to different tourist preferences. | Beach parties, Quiet beach days, Water sports |
Understanding Airbnb License Requirements & STR Laws in Boca de Aroa (2026)
While Boca de Aroa, Falcon State, Venezuela currently shows low STR regulations, specific Airbnb license requirements might still exist or change. Always verify the latest short term rental regulations and Airbnb license requirements directly with local government authorities for Boca de Aroa to ensure full compliance before hosting.
(Source: AirROI data, 2026, based on 5% licensed listings)
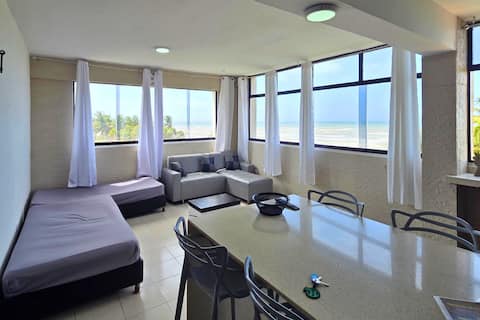
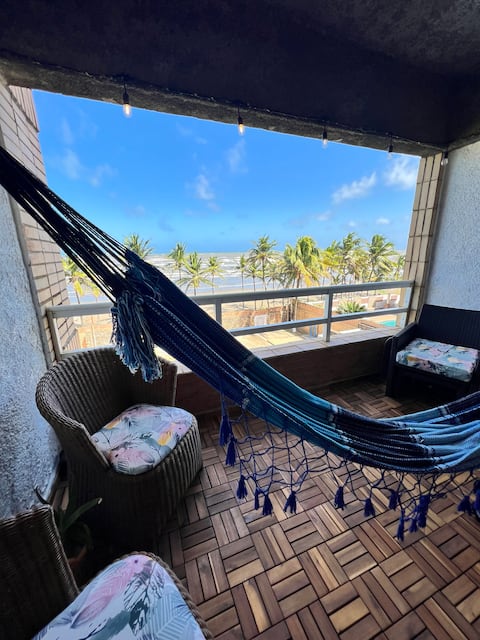
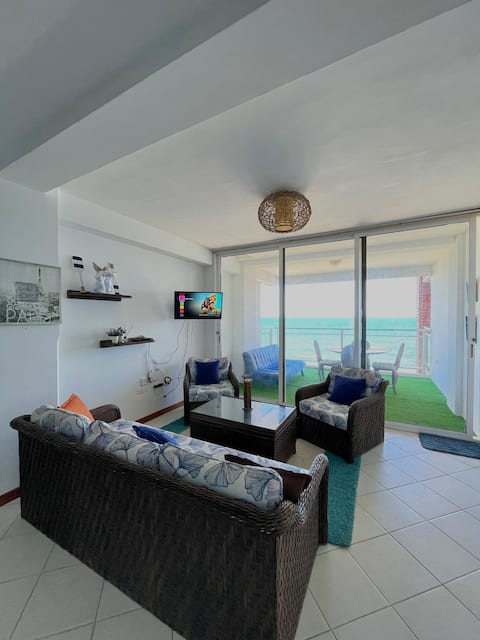
Top Performing Airbnb Properties in Boca de Aroa (2026)
Benchmark your potential! Explore examples of top-performing Airbnb properties in Boca de Aroabased on Trailing Twelve Month (TTM) revenue. Analyze their characteristics, revenue, occupancy rate, and ADR to understand what drives success in this market.
Tucacas Oceanfront 180-Degree View with Pool
Entire Place • 2 bedrooms
Paradise in Tucacas: Direct beach access
Entire Place • 3 bedrooms
2-story apartment, 20 minutes from Tucacas.
Entire Place • 2 bedrooms
Modern apartment in Tucacas with Electricity
Entire Place • 2 bedrooms
Tucacas Oceanfront with Pool and Private Beach
Entire Place • 1 bedroom
Tucacas Oceanfront with Pool and Private Beach
Entire Place • 1 bedroom
Note: Performance varies based on location, size, amenities, seasonality, and management quality. Data reflects the past 12 months.
Top Performing Airbnb Hosts in Boca de Aroa (2026)
Learn from the best! This table showcases top-performing Airbnb hosts in Boca de Aroa based on the number of properties managed and estimated total revenue over the past year. Analyze their scale and performance metrics.
| Host Name | Properties | Grossing Revenue | Stay Reviews | Avg Rating |
|---|---|---|---|---|
| Luis | 3 | $25,383 | 11 | 4.70/5.0 |
| Daryuly | 2 | $10,166 | 21 | 4.65/5.0 |
| Fedra | 2 | $10,031 | 2 | Not Rated |
| Karina | 1 | $8,646 | 26 | 5.00/5.0 |
| Daniela | 1 | $3,675 | 2 | Not Rated |
| Jorge | 1 | $2,598 | 30 | 4.93/5.0 |
| Host #430186671 | 1 | $2,204 | 1 | Not Rated |
| Your.Rentals | 1 | $2,190 | 2 | Not Rated |
| Eylin Mislay | 1 | $2,033 | 10 | 4.90/5.0 |
| Giancarlo | 1 | $975 | 1 | Not Rated |
Analyzing the strategies of top hosts, such as their property selection, pricing, and guest communication, can offer valuable lessons for optimizing your own Airbnb operations in Boca de Aroa.
Dive Deeper: Advanced Boca de Aroa STR Market Data (2026)
Ready to unlock more insights? AirROI provides access to advanced metrics and comprehensive Airbnb data for Boca de Aroa. Explore detailed analytics beyond this report to refine your investment strategy, optimize pricing, and maximize your vacation rental profits.
Explore Advanced MetricsBoca de Aroa Short-Term Rental Market Composition (2026): Property & Room Types
Room Type Distribution
Property Type Distribution
Market Composition Insights for Boca de Aroa
- The Boca de Aroa Airbnb market composition is heavily skewed towards Entire Home/Apt listings, which make up 100% of the 19 active rentals. This indicates strong guest preference for privacy and space.
- Looking at the property type distribution in Boca de Aroa, Apartment/Condo properties are the most common (100%), reflecting the local real estate landscape.
Boca de Aroa Airbnb Room Capacity Analysis (2026): Bedroom Distribution
Distribution of Listings by Number of Bedrooms
Room Capacity Insights for Boca de Aroa
- The dominant room capacity in Boca de Aroa is 2 bedrooms listings, making up 52.6% of the market. This suggests a strong demand for properties suitable for couples or solo travelers.
- Together, 2 bedrooms and 1 bedroom properties represent 89.4% of the active Airbnb listings in Boca de Aroa, indicating a high concentration in these sizes.
Boca de Aroa Vacation Rental Guest Capacity Trends (2026)
Distribution of Listings by Guest Capacity
Guest Capacity Insights for Boca de Aroa
- The most common guest capacity trend in Boca de Aroa vacation rentals is listings accommodating 6 guests (36.8%). This suggests the primary traveler segment is likely larger groups.
- Properties designed for 6 guests and 8+ guests dominate the Boca de Aroa STR market, accounting for 63.1% of listings.
- 73.6% of properties accommodate 6+ guests, serving the market segment for larger families or group travel in Boca de Aroa.
- On average, properties in Boca de Aroa are equipped to host 6.2 guests.
Boca de Aroa Airbnb Booking Patterns (2026): Available vs. Booked Days
Available Days Distribution
Booked Days Distribution
Booking Pattern Insights for Boca de Aroa
- The most common availability pattern in Boca de Aroa falls within the 271-366 days range, representing 89.5% of listings. This suggests many properties have significant open periods on their calendars.
- Approximately 100.0% of listings show high availability (181+ days open annually), indicating potential for increased bookings or specific owner usage patterns.
- For booked days, the 1-30 days range is most frequent in Boca de Aroa (47.4%), reflecting common guest stay durations or potential owner blocking patterns.
Boca de Aroa Airbnb Minimum Stay Requirements Analysis
Distribution of Listings by Minimum Night Requirement
1 Night
10 listings
55.6% of total
2 Nights
5 listings
27.8% of total
30+ Nights
3 listings
16.7% of total
Key Insights
- The most prevalent minimum stay requirement in Boca de Aroa is 1 Night, adopted by 55.6% of listings. This highlights the market's preference for shorter, flexible bookings.
- A strong majority (83.4%) of the Boca de Aroa Airbnb data shows acceptance of very short stays (1-2 nights), indicating a dynamic, high-turnover market.
- A significant segment (16.7%) caters to monthly stays (30+ nights) in Boca de Aroa, pointing to opportunities in the extended-stay market.
Recommendations
- Align with the market by considering a 1 Night minimum stay, as 55.6% of Boca de Aroa hosts use this setting.
- Explore offering discounts for stays of 30+ nights to attract the 16.7% of the market seeking extended stays.
- Adjust minimum nights based on seasonality – potentially shorter during low season and longer during peak demand periods in Boca de Aroa.
Boca de Aroa Airbnb Cancellation Policy Trends Analysis (2026)
Super Strict 30 Days
1 listings
5.3% of total
Flexible
8 listings
42.1% of total
Moderate
4 listings
21.1% of total
Firm
6 listings
31.6% of total
Cancellation Policy Insights for Boca de Aroa
- The prevailing Airbnb cancellation policy trend in Boca de Aroa is Flexible, used by 42.1% of listings.
- There's a relatively balanced mix between guest-friendly (63.2%) and stricter (31.6%) policies, offering choices for different guest needs.
Recommendations for Hosts
- Consider adopting a Flexible policy to align with the 42.1% market standard in Boca de Aroa.
- Regularly review your cancellation policy against competitors and market demand shifts in Boca de Aroa.
Boca de Aroa STR Booking Lead Time Analysis (2026)
Average Booking Lead Time by Month
Booking Lead Time Insights for Boca de Aroa
- The overall average booking lead time for vacation rentals in Boca de Aroa is 19 days.
- Guests book furthest in advance for stays during December (average 43 days), likely coinciding with peak travel demand or local events.
- The shortest booking windows occur for stays in February (average 11 days), indicating more last-minute travel plans during this time.
- Seasonally, Winter (23 days avg.) sees the longest lead times, while Spring (16 days avg.) has the shortest, reflecting typical travel planning cycles.
Recommendations for Hosts
- Use the overall average lead time (19 days) as a baseline for your pricing and availability strategy in Boca de Aroa.
- For December stays, consider implementing length-of-stay discounts or slightly higher rates for bookings made less than 43 days out to capitalize on advance planning.
- During February, focus on last-minute booking availability and promotions, as guests book with very short notice (11 days avg.).
- Target marketing efforts for the Winter season well in advance (at least 23 days) to capture early planners.
- Monitor your own booking lead times against these Boca de Aroa averages to identify opportunities for dynamic pricing adjustments.
Popular & Essential Airbnb Amenities in Boca de Aroa (2026)
Amenity Prevalence
Amenity Insights for Boca de Aroa
- Essential amenities in Boca de Aroa that guests expect include: Air conditioning, Pool, Free parking on premises. Lacking these (any) could significantly impact bookings.
- Popular amenities like Outdoor dining area, Kitchen, Wifi are common but not universal. Offering these can provide a competitive edge.
- Warning: Wifi is not universally provided but is considered essential globally. Ensure reliable Wifi is offered.
Recommendations for Hosts
- Ensure your listing includes all essential amenities for Boca de Aroa: Air conditioning, Pool, Free parking on premises.
- Consider adding popular differentiators like Outdoor dining area or Kitchen to increase appeal.
- Highlight unique or less common amenities you offer (e.g., hot tub, dedicated workspace, EV charger) in your listing description and photos.
- Regularly check competitor amenities in Boca de Aroa to stay competitive.
Boca de Aroa Airbnb Guest Demographics & Profile Analysis (2026)
Guest Profile Summary for Boca de Aroa
- The typical guest profile for Airbnb in Boca de Aroa consists of a mix of domestic (53%) and international guests, often arriving from nearby Caracas, typically belonging to the Post-2000s (Gen Z/Alpha) group (50%), primarily speaking Spanish or English.
- Domestic travelers account for 52.6% of guests.
- Key international markets include Venezuela (52.6%) and Spain (15.8%).
- Top languages spoken are Spanish (61.9%) followed by English (28.6%).
- A significant demographic segment is the Post-2000s (Gen Z/Alpha) group, representing 50% of guests.
Recommendations for Hosts
- Balance marketing efforts between domestic and international channels based on the guest mix.
- Tailor amenities and listing descriptions to appeal to the dominant Post-2000s (Gen Z/Alpha) demographic (e.g., highlight fast WiFi, smart home features, local guides).
- Highlight unique local experiences or amenities relevant to the primary guest profile.
- Consider seasonal promotions aligned with peak travel times for key origin markets.
Nearby Short-Term Rental Market Comparison
How does the Boca de Aroa Airbnb market stack up against its neighbors? Compare key performance metrics like average monthly revenue, ADR, and occupancy rates in surrounding areas to understand the broader regional STR landscape.
| Market | Active Properties | Monthly Revenue | Daily Rate | Avg. Occupancy |
|---|---|---|---|---|
| Tucacas | 197 | $474 | $136.11 | 19% |
| Chichiriviche | 53 | $418 | $104.28 | 20% |
| Colonia Tovar | 22 | $388 | $168.05 | 18% |
| Parroquia María de San José | 29 | $371 | $47.37 | 33% |
| Parroquia Santa Rosa | 16 | $362 | $47.82 | 32% |
| Urbanización Cata | 11 | $356 | $95.17 | 16% |
| El Manzano | 20 | $338 | $47.51 | 32% |
| Barquisimeto | 18 | $334 | $54.71 | 34% |
| Parroquia San José | 110 | $326 | $41.87 | 33% |
| Naguanagua | 51 | $303 | $46.06 | 31% |