Airbnb vs. Long-Term Rental: Which Rental Strategy Maximizes Your ROI?
There's no single right answer. The optimal strategy hinges on your financial goals, risk appetite, the property itself, and crucially, the specific dynamics of your local market. Both Airbnb and long-term rentals can be profitable, but understanding their unique profiles is key. This article provides a comprehensive, data-informed comparison to help you analyze the Airbnb vs long term rental profitability equation and make the decision that best suits your investment objectives.
Understanding Your Market: The Foundation for Comparison
Before comparing income figures, grasp the context of your local housing market. Are average home values rising? Is there a surge in new Airbnb listings, indicating growing popularity but also potential competition? How do current average long-term rental rates stack up? Understanding these trends is crucial. You can visually explore and analyze these dynamics for your specific region using tools like the AirROI Market Atlas, which provides geographic insights into STR performance metrics and market density. This initial research provides the necessary backdrop for a meaningful comparison.
Income Potential: High Peaks vs. Stable Streams
The most significant difference often lies in revenue generation.
Airbnb Income Potential
- Variable & Potentially Higher: Gross income is driven by Average Daily Rate (ADR) multiplied by Occupancy Rate. This can fluctuate significantly based on property characteristics, location, seasonality, and management effectiveness.
- Data Insights: Accurately estimating potential Airbnb revenue requires localized data. Platforms offering detailed Regional Reports provide invaluable benchmarks for ADR and occupancy rates specific to property types and areas. Remember, achieving the higher potential often seen with larger properties depends heavily on securing consistent bookings.
Long-Term Rental Income Potential
- Stable & Predictable: Based on a signed lease agreement stipulating a fixed monthly rent.
- Market-Driven: Determined by local supply and demand for comparable long-term rentals. Rental market reports or listing site data can provide benchmarks.
- Lower Gross Ceiling (Often): While consistent, the total annual gross income is often lower than the potential maximum achievable through successful short-term renting, especially for larger or well-located properties.
Key Takeaway: Airbnb offers a higher potential income ceiling but comes with revenue volatility. Long-term rentals offer predictability and stability, albeit often at a lower gross amount. Which is better for your property requires calculation.
Expenses & Effort: Weighing the Costs and Commitment
Profit isn't just about revenue; it's what's left after expenses. The cost structures and management demands differ dramatically.
Costs Associated with Airbnb
- Higher Operating Costs: Frequent turnover drives up expenses like cleaning, utilities (usually covered by host), and restocking supplies (toiletries, coffee).
- Furnishing: Requires significant upfront investment and ongoing refresh costs.
- Maintenance: Potentially more frequent minor repairs due to higher usage.
- Fees: Platform fees (e.g., Airbnb host fee) and potentially higher specialized STR insurance premiums.
- Management (Optional): STR property managers typically charge higher fees (15-35%+) than LTR managers due to the increased workload.
Costs Associated with Long-Term Rentals
- More Predictable Costs: Expenses like property taxes and landlord insurance are relatively stable.
- Maintenance: Regular upkeep plus budgeting for larger, less frequent repairs.
- Vacancy Costs: Potential lost rent between tenants is a key expense to factor in.
- Management (Optional): Lower typical fees (6-12% of rent) plus potential leasing fees.
Effort & Management
- Airbnb = Active Management: Requires significant time for managing bookings, guest communication, cleaning coordination, reviews, and problem-solving. It's running a small hospitality business.
- Long-Term Rental = Passive (Relatively): Less day-to-day involvement once a tenant is placed, focusing on rent collection and handling periodic requests.
Key Takeaway: Airbnb generally incurs higher operating expenses and demands significantly more hands-on management time and effort compared to long-term rentals.
Vacancy vs. Occupancy: Filling the Nights
Consistent revenue depends on keeping the property occupied.
- Airbnb Occupancy: Highly variable and influenced by many factors. Researching average occupancy rates for your specific market using AirROI Regional Reports is essential for realistic forecasting.
- Long-Term Rental Vacancy: Generally lower due to longer lease terms, but vacancy periods between tenants still impact annual revenue. Factor in a realistic vacancy rate (e.g., 5-10%) for projections.
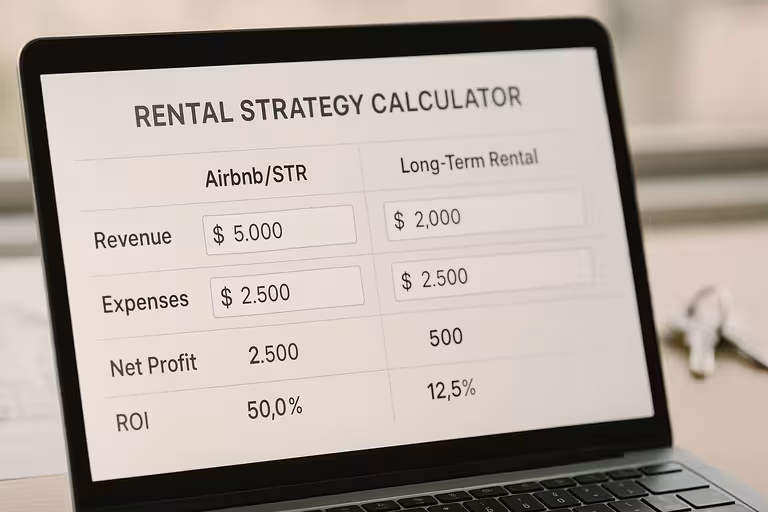
ROI and Cash Flow Analysis: The Bottom Line
Which strategy delivers better returns? Calculating Return on Investment (ROI) and analyzing cash flow helps answer this.
Calculating ROI
- Formulas: Use standard ROI calculations (Net Annual Income / Cost or Cash Invested).
- Net Annual Income: Gross Revenue - Total Annual Operating Expenses.
- The Importance of Accurate Inputs: Garbage in, garbage out. Your ROI calculation is only as good as the data you use. For a more accurate, data-backed projection tailored to your property, utilize a specialized tool like the AirROI Revenue Calculator. Input your property details, expected LTR rent, and leverage its market data integration to estimate potential STR income and expenses for a direct comparison. (See our guide on using Airbnb income calculators for details).
Cash Flow Comparison
- Airbnb: Potential for high cash flow in peak periods but susceptible to seasonality and booking dips, leading to inconsistent monthly income.
- Long-Term Rental: Offers stable, predictable monthly cash flow, simplifying personal budgeting.
Key Takeaway: Airbnb might offer higher peak ROI but with more risk and volatility. LTRs typically provide steadier, albeit potentially lower, returns and cash flow. Run the numbers for your specific property using a tool like the AirROI Calculator to see the potential difference.
Best Use Cases: Matching Strategy to Situation
The optimal choice often depends on context:
Scenarios Favoring Airbnb:
- High Tourism Areas & Event Hubs: Where demand for short stays is consistently high. Check the AirROI Market Atlas to assess the STR density and performance near attractions in your area. (Explore potential in top US markets or leading international destinations).
- Unique Properties: Those with features that strongly appeal to travelers.
- Owner Goals: Maximizing revenue potential, hands-on involvement (or budget for high PM fees), comfortable with variability.
- Favorable Regulations: Clear and permissive local STR rules.
Scenarios Favoring Long-Term Rentals:
- Stable Residential Markets: Consistent local housing demand.
- Less Tourist-Reliant Locations: Where STR demand might be weak or highly seasonal.
- Owner Goals: Prioritizing stability, predictability, and passive income.
- Standard Properties: Less distinct features appealing primarily to residents.
- Restrictive STR Regulations: Where short-term renting is difficult or prohibited.
Key Factors for Your Decision
Summarize your analysis by considering:
- Investment Goals: Max return vs. stability?
- Risk Tolerance: Comfortable with income swings?
- Time Commitment: How hands-on can you be?
- Property & Location: Is it truly suited for STRs? Analyze its potential using the Market Atlas.
- Financial Situation: Can you afford STR setup costs and potential income gaps?
- Local Regulations: What are the rules? Crucial diligence required.
- Market Data: What do AirROI's Reports and Calculator project for your property in both scenarios?
Conclusion: Making the Informed Choice
Neither Airbnb nor long-term renting is inherently superior; they are simply different investment strategies with unique risk-reward profiles. The allure of potentially higher Airbnb profitability is tempting, but it comes packaged with greater expenses, significant management demands, and income uncertainty. Long-term rentals offer a dependable, lower-effort path, typically with more moderate returns.
The best decision stems from a clear-eyed assessment of your own goals, resources, and risk tolerance, combined with a thorough, data-driven analysis of your specific property and local market conditions. Leverage market intelligence tools like AirROI's Market Atlas, Regional Reports, and Revenue Calculator to move beyond guesswork and obtain realistic projections for both scenarios. By grounding your rental strategy ROI comparison in solid data, you can confidently choose the path that best aligns with your vision for your real estate investment.
Disclaimer: This article provides a general comparison. Financial outcomes vary significantly based on individual properties, management, market fluctuations, and unforeseen circumstances. All calculations are illustrative. Consult with financial advisors, real estate professionals, and legal counsel, and conduct thorough due diligence using reliable data sources before making investment decisions.