Provincia de Buenos Aires, Provincia de Buenos Aires Airbnb Market Data 2025: STR Report & Statistics
How much can you earn on Airbnb in Provincia de Buenos Aires, Provincia de Buenos Aires? Based on AirROI's 2025 dataset (May 2024 – April 2025), the short answer is $19,607 per year — at a $241 nightly rate, 22.6% occupancy, and a N/A RevPAR.
With just 19 active listings, Provincia de Buenos Aires is a micro-market where selective demand that rewards strong listing quality and pricing strategy. Supply grew 375.0% over the past year, yet revenue and nightly rates both trended upward — a signal that traveler demand is outpacing new inventory rather than being diluted by it. For hosts, pricing power remains intact even as competition increases.
Regulation is low with minimal registration requirements, pointing to an operator-friendly environment. In a market this size, differentiated listings with strong reviews can capture outsized returns relative to the competition.

Table of Contents [hide] [show]
What Are the Key Airbnb Metrics in Provincia de Buenos Aires?
In Provincia de Buenos Aires, the headline Airbnb metrics are $19,607 in average annual revenue,22.6% occupancy, $241 ADR, and $0 in RevPAR, and guests book about 23 days in advance.
How Much Do Airbnb Hosts Earn Monthly in Provincia de Buenos Aires?
Understanding the monthly revenue variations for Airbnb listings in Provincia de Buenos Aires is key to maximizing your short term rental income potential. Seasonality significantly impacts earnings. Our analysis, based on data from the past 12 months, shows that the peak revenue month for STRs in Provincia de Buenos Aires is typically May, while January often presents the lowest earnings, highlighting opportunities for strategic pricing adjustments during shoulder and low seasons. Explore the typical Airbnb income in Provincia de Buenos Aires across different performance tiers:
- Best-in-class properties (Top 10%) achieve $7,482+ monthly, often utilizing dynamic pricing and superior guest experiences.
- Strong performing properties (Top 25%) earn $4,559 or more, indicating effective management and desirable locations/amenities.
- Typical properties (Median) generate around $2,462 per month, representing the average market performance.
- Entry-level properties (Bottom 25%) see earnings around $1,385, often with potential for optimization.
Average Monthly Airbnb Earnings Trend in Provincia de Buenos Aires
What Is the Monthly Airbnb Occupancy Rate in Provincia de Buenos Aires?
Maximize your bookings by understanding the Provincia de Buenos Aires STR occupancy trends. Seasonal demand shifts significantly influence how often properties are booked. Typically, Marchsees the highest demand (peak season occupancy), while August experiences the lowest (low season). Effective strategies, like adjusting minimum stays or offering promotions, can boost occupancy during slower periods. Here's how different property tiers perform in Provincia de Buenos Aires:
- Best-in-class properties (Top 10%) achieve 66%+ occupancy, indicating high desirability and potentially optimized availability.
- Strong performing properties (Top 25%) maintain 56% or higher occupancy, suggesting good market fit and guest satisfaction.
- Typical properties (Median) have an occupancy rate around 26%.
- Entry-level properties (Bottom 25%) average 19% occupancy, potentially facing higher vacancy.
Average Monthly Occupancy Rate Trend in Provincia de Buenos Aires
What Is the Average Airbnb Nightly Rate in Provincia de Buenos Aires?
Effective short term rental pricing strategy in Provincia de Buenos Aires involves understanding monthly ADR fluctuations. The Average Daily Rate (ADR) for Airbnb in Provincia de Buenos Aires typically peaks in January and dips lowest during August. Leveraging Airbnb dynamic pricing tools or strategies based on this seasonality can significantly boost revenue. Here's a look at the typical nightly rates achieved:
- Best-in-class properties (Top 10%) command rates of $459+ per night, often due to premium features or locations.
- Strong performing properties (Top 25%) achieve nightly rates of $316 or more.
- Typical properties (Median) charge around $182 per night.
- Entry-level properties (Bottom 25%) earn around $112 per night.
Average Daily Rate (ADR) Trend by Month in Provincia de Buenos Aires
What Is the RevPAR for Airbnb in Provincia de Buenos Aires?
RevPAR in Provincia de Buenos Aires is currently N/A. Because RevPAR combines nightly rates with realized occupancy, it is one of the cleanest ways to compare how efficiently listings turn demand into revenue across the market.
- Entry-level properties (Bottom 25%) see N/A RevPAR.
- Typical properties (Median) generate N/A RevPAR.
- Strong performers (Top 25%) earn N/A RevPAR.
- Best-in-class (Top 10%) achieve N/A RevPAR.
Average Monthly RevPAR Trend in Provincia de Buenos Aires
RevPAR Insights for Provincia de Buenos Aires
- RevPAR peaks in Jan and bottoms out in Jan, mirroring the broader seasonal demand pattern and suggesting opportunities for dynamic pricing.
Recommendations for Hosts
- Track your own RevPAR monthly against these Provincia de Buenos Aires benchmarks. If your RevPAR falls below the median of N/A, examine whether low occupancy or low ADR is the primary drag.
- Use RevPAR rather than revenue alone when comparing properties of different sizes — it normalizes for available nights and gives a more accurate picture of performance.
Get Live Provincia de Buenos Aires Market Intelligence 👇
Explore Real-time Analytics
When Is the Peak Season for Airbnb in Provincia de Buenos Aires?
Provincia de Buenos Aires's peak Airbnb season falls in May, June, March, while the softest stretch is January, July, August. Overall, the market shows highly seasonal trends requiring careful strategy, which should guide pricing, minimum stays, and cash-flow planning.
Peak Season (May, June, March)
- Revenue averages $5,750 per month
- Occupancy rates average 37.8%
- Daily rates average $223
Shoulder Season
- Revenue averages $2,702 per month
- Occupancy maintains around 37.8%
- Daily rates hold near $234
Low Season (January, July, August)
- Revenue drops to average $1,831 per month
- Occupancy decreases to average 23.8%
- Daily rates adjust to average $229
Seasonality Insights for Provincia de Buenos Aires
- Airbnb seasonality in Provincia de Buenos Aires is pronounced. Revenue swings sharply between peak and low months, which means pricing strategy, minimum-stay settings, and cash reserves all need to account for extended slower periods.
- During the high season, the absolute peak month showcases Provincia de Buenos Aires's highest earning potential, with monthly revenues climbing to $7,233, occupancy reaching 63.4%, and ADRs peaking at $276.
- Conversely, the slowest single month marks the market's lowest point — revenue may dip to $1,468, occupancy could drop to 0.0%, and ADRs may adjust to $204.
- Lower occupancy paired with meaningful seasonality means hosts in Provincia de Buenos Aires need to maximize every peak-season booking and seriously consider whether off-season pricing adjustments or minimum-stay changes can capture incremental revenue.
Seasonal Strategies for Maximizing Profit
- Peak Season: Maximize revenue through premium pricing and potentially longer minimum stays. Ensure high availability and consider tightening cancellation policies to reduce last-minute gaps.
- Low Season: Offer competitive pricing, extended-stay discounts, and flexible cancellation policies. Target off-season travelers like remote workers, budget-conscious guests, and travelers with flexible schedules.
- Shoulder Seasons: Implement dynamic pricing that bridges peak and low rates. Target weekend travelers, local events, and business visitors. Slightly more flexible terms than peak season can help maintain occupancy without deep discounting.
- In a highly seasonal market like Provincia de Buenos Aires, building a cash reserve during the top months is essential for covering fixed costs during the slow period. Automated pricing tools can help capture demand shifts in real time.
Do You Need a License for Airbnb in Provincia de Buenos Aires?
Low regulation and minimal registration activity in Provincia de Buenos Aires, Provincia de Buenos Aires, Argentina point to an operator-friendly environment. That said, even low-regulation markets may have tax collection requirements, safety standards, or HOA rules that affect short-term rental operations. Always verify the latest short-term rental regulations and Airbnb license requirements directly with local government authorities for Provincia de Buenos Aires to ensure full compliance before hosting.
(Source: AirROI data, 2026, finding no licensed listings among those analyzed)
What Are the Best Neighborhoods for Airbnb in Provincia de Buenos Aires?
With a compact short-term rental market, Provincia de Buenos Aires gives early-mover hosts an advantage in the right neighborhoods. The areas listed below are where guest demand and local attractions converge — a useful lens for investors evaluating whether to enter this market and where to position their listing.
| Neighborhood / Area | Why Host Here? (Target Guests & Appeal) | Key Attractions & Landmarks |
|---|---|---|
| La Plata | The capital of Buenos Aires Province, known for its rich history, architecture, and vibrant university culture. Ideal for students and families visiting the area. | Cathedral of La Plata, Parque Pereyra Iraola, Museo de La Plata, Universidad Nacional de La Plata, Teatro Argentino |
| Tigre | A picturesque town located on the delta of the Paraná River, famous for its estuaries and riverside activities. Perfect for weekend getaways and nature lovers. | Parque de la Costa, Tigre River Delta, Museo de Arte Tigre, Puerto de Frutos, Isla El Descanso |
| San Isidro | A charming suburb with a beautiful historical center, lush parks, and a riverside location. Attractive for families and those looking for a peaceful retreat close to the city. | San Isidro Cathedral, Museo Pueyrredón, Lagos de San Isidro, Plaza Mitre, Café de la Plaza |
| Pinamar | A popular beach resort town known for its stunning coastline and upscale vacation homes. Ideal for beachgoers and families looking for a summer escape. | Pinamar Beach, Boulevard de Pinamar, Centro Comercial Pinamar, Valeria del Mar, Playa de Cariló |
| Mar del Plata | One of Argentina's most famous beach destinations, known for its vibrant nightlife, restaurants, and cultural events. Attracts a large number of tourists all year round. | Playa Bristol, Casino Central, Mar del Plata Aquarium, Torreón del Monje, Museo MAR |
| Casa de Campo | A rural area with natural beauty and outdoor activities, great for those looking for a nature-filled escape away from the hustle and bustle of the city. | Parque Nacional Quebrada del Cóndor, Caminos del Vino, Calle de Las Flores, Estancia La Elvira, Laguna El Cristal |
| Bahía Blanca | A major port city with an interesting cultural scene, historical landmarks, and proximity to beautiful natural parks. Suitable for both business and leisure travelers. | Puerto de Bahia Blanca, Museo del Puerto, Parque de la Ciudad, Iglesia de la Virgen de Luján, Cine Gran Rex |
| Chascomús | A charming town known for its lagoon and outdoor activities, popular for picnics and family outings. Provides a serene environment close to water activities. | Laguna de Chascomús, Museo Pampeano, Parque Libres del Sur, Plaza Sarmiento, Cruz del Sur |
With 8 distinct neighborhoods showing meaningful short-term rental activity, Provincia de Buenos Aires offers diversification within a single market. Investors can tailor their strategy — from high-turnover tourist zones to quieter residential areas that attract longer stays and remote workers.
What Types of Properties Are on Airbnb in Provincia de Buenos Aires?
Room Type Distribution
Property Type Distribution
Market Composition Insights for Provincia de Buenos Aires
- The Provincia de Buenos Aires Airbnb market composition is heavily skewed towards Entire Home/Apt listings, which make up 94.7% of the 19 active rentals. This indicates strong guest preference for privacy and space.
- Looking at the property type distribution in Provincia de Buenos Aires, House properties are the most common (84.2%), reflecting the local real estate landscape.
- Houses represent a significant 84.2% portion, catering likely to families or larger groups.
Provincia de Buenos Aires Airbnb Room Capacity Analysis (2026): Bedroom Distribution
Distribution of Listings by Number of Bedrooms
Room Capacity Insights for Provincia de Buenos Aires
- The dominant room capacity in Provincia de Buenos Aires is 3 bedrooms listings, making up 36.8% of the market. This suggests a strong demand for properties suitable for families or small groups.
- Together, 3 bedrooms and 2 bedrooms properties represent 68.4% of the active Airbnb listings in Provincia de Buenos Aires, indicating a high concentration in these sizes.
- A significant 57.9% of listings offer 3+ bedrooms, catering to larger groups and families seeking more space in Provincia de Buenos Aires.
Provincia de Buenos Aires Vacation Rental Guest Capacity Trends (2026)
Distribution of Listings by Guest Capacity
Guest Capacity Insights for Provincia de Buenos Aires
- The most common guest capacity trend in Provincia de Buenos Aires vacation rentals is listings accommodating 8+ guests (36.8%). This suggests the primary traveler segment is likely larger groups.
- Properties designed for 8+ guests and 4 guests dominate the Provincia de Buenos Aires STR market, accounting for 63.1% of listings.
- 63.2% of properties accommodate 6+ guests, serving the market segment for larger families or group travel in Provincia de Buenos Aires.
- On average, properties in Provincia de Buenos Aires are equipped to host 5.8 guests.
What Amenities Do Airbnb Guests Expect in Provincia de Buenos Aires?
Amenity Prevalence
Amenity Insights for Provincia de Buenos Aires
- Essential amenities in Provincia de Buenos Aires that guests expect include: Air conditioning, TV, Kitchen, Hot water, Wifi, Free parking on premises. Lacking these (any) could significantly impact bookings.
- Popular amenities like Heating, BBQ grill, Washer are common but not universal. Offering these can provide a competitive edge.
Recommendations for Hosts
- Ensure your listing includes all essential amenities for Provincia de Buenos Aires: Air conditioning, TV, Kitchen, Hot water, Wifi, Free parking on premises.
- Consider adding popular differentiators like Heating or BBQ grill to increase appeal.
- Highlight unique or less common amenities you offer (e.g., hot tub, dedicated workspace, EV charger) in your listing description and photos.
- Regularly check competitor amenities in Provincia de Buenos Aires to stay competitive.
Dive Deeper: Advanced Provincia de Buenos Aires STR Market Data (2026)
Ready to unlock more insights? AirROI provides access to advanced metrics and comprehensive Airbnb data for Provincia de Buenos Aires. Explore detailed analytics beyond this report to refine your investment strategy, optimize pricing, and maximize your vacation rental profits.
Explore Advanced MetricsProvincia de Buenos Aires Airbnb Guest Demographics & Profile Analysis (2026)
Guest Profile Summary for Provincia de Buenos Aires
- The typical guest profile for Airbnb in Provincia de Buenos Aires consists of primarily domestic travelers (84%), often arriving from nearby Buenos Aires, typically belonging to the Post-2000s (Gen Z/Alpha) group (50%), primarily speaking Spanish or English.
- Domestic travelers account for 84.0% of guests.
- Key international markets include Argentina (84%) and United States (8%).
- Top languages spoken are Spanish (35.7%) followed by English (35.7%).
- A significant demographic segment is the Post-2000s (Gen Z/Alpha) group, representing 50% of guests.
Recommendations for Hosts
- Target domestic marketing efforts towards travelers from Buenos Aires and La Plata.
- Tailor amenities and listing descriptions to appeal to the dominant Post-2000s (Gen Z/Alpha) demographic (e.g., highlight fast WiFi, smart home features, local guides).
- Highlight unique local experiences or amenities relevant to the primary guest profile.
- Consider seasonal promotions aligned with peak travel times for key origin markets.
Provincia de Buenos Aires Airbnb Booking Patterns (2026): Available vs. Booked Days
Available Days Distribution
Booked Days Distribution
Booking Pattern Insights for Provincia de Buenos Aires
- The most common availability pattern in Provincia de Buenos Aires falls within the 271-366 days range, representing 78.9% of listings. This suggests many properties have significant open periods on their calendars.
- Approximately 89.4% of listings show high availability (181+ days open annually), indicating potential for increased bookings or specific owner usage patterns.
- For booked days, the 31-90 days range is most frequent in Provincia de Buenos Aires (73.7%), reflecting common guest stay durations or potential owner blocking patterns.
- A notable 10.5% of properties secure long booking periods (181+ days booked per year), highlighting successful long-term rental strategies or significant owner usage.
How Far in Advance Do Guests Book Airbnb in Provincia de Buenos Aires?
Average Booking Lead Time by Month
Booking Lead Time Insights for Provincia de Buenos Aires
- The overall average booking lead time for vacation rentals in Provincia de Buenos Aires is 23 days.
- Guests book furthest in advance for stays during January (average 67 days), likely coinciding with peak travel demand or local events.
- The shortest booking windows occur for stays in May (average 0 days), indicating more last-minute travel plans during this time.
- Seasonally, Winter (44 days avg.) sees the longest lead times, while Summer (8 days avg.) has the shortest, reflecting typical travel planning cycles.
Recommendations for Hosts
- Use the overall average lead time (23 days) as a baseline for your pricing and availability strategy in Provincia de Buenos Aires.
- For January stays, consider implementing length-of-stay discounts or slightly higher rates for bookings made less than 67 days out to capitalize on advance planning.
- During May, focus on last-minute booking availability and promotions, as guests book with very short notice (0 days avg.).
- Target marketing efforts for the Winter season well in advance (at least 44 days) to capture early planners.
- Monitor your own booking lead times against these Provincia de Buenos Aires averages to identify opportunities for dynamic pricing adjustments.
Provincia de Buenos Aires Airbnb Minimum Stay Requirements Analysis
Distribution of Listings by Minimum Night Requirement
1 Night
2 listings
11.1% of total
2 Nights
5 listings
27.8% of total
4-6 Nights
2 listings
11.1% of total
7-29 Nights
7 listings
38.9% of total
30+ Nights
2 listings
11.1% of total
Key Insights
- The most prevalent minimum stay requirement in Provincia de Buenos Aires is 7-29 Nights, adopted by 38.9% of listings. This highlights the market's preference for shorter, flexible bookings.
- A significant segment (11.1%) caters to monthly stays (30+ nights) in Provincia de Buenos Aires, pointing to opportunities in the extended-stay market.
Recommendations
- Align with the market by considering a 7-29 Nights minimum stay, as 38.9% of Provincia de Buenos Aires hosts use this setting.
- If feasible, allowing 1-night stays, especially midweek or during low season, could capture last-minute bookings, as only 11.1% currently do.
- Explore offering discounts for stays of 30+ nights to attract the 11.1% of the market seeking extended stays.
- Adjust minimum nights based on seasonality – potentially shorter during low season and longer during peak demand periods in Provincia de Buenos Aires.
Provincia de Buenos Aires Airbnb Cancellation Policy Trends Analysis (2026)
Flexible
1 listings
20% of total
Firm
1 listings
20% of total
Strict
3 listings
60% of total
Cancellation Policy Insights for Provincia de Buenos Aires
- The prevailing Airbnb cancellation policy trend in Provincia de Buenos Aires is Strict, used by 60% of listings.
- A majority (80.0%) of hosts in Provincia de Buenos Aires utilize Firm or Strict policies, indicating a market where hosts prioritize booking security.
Recommendations for Hosts
- Consider adopting a Strict policy to align with the 60% market standard in Provincia de Buenos Aires.
- With 60% using Strict terms, this is a viable option in Provincia de Buenos Aires, particularly for high-value properties or during peak demand periods.
- Regularly review your cancellation policy against competitors and market demand shifts in Provincia de Buenos Aires.
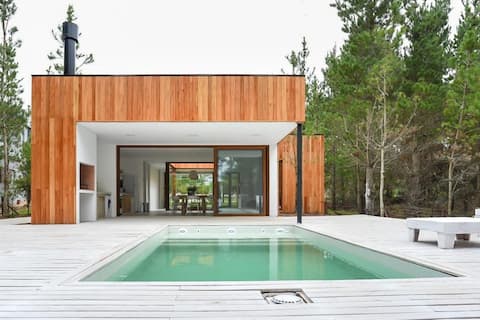
What Do the Top Airbnb Listings in Provincia de Buenos Aires Look Like?
Benchmark your potential! Explore examples of top-performing Airbnb properties in Provincia de Buenos Airesbased on Trailing Twelve Month (TTM) revenue. Analyze their characteristics, revenue, occupancy rate, and ADR to understand what drives success in this market.

VASILY - Design and comfort in a unique environment
Entire Place • 2 bedrooms
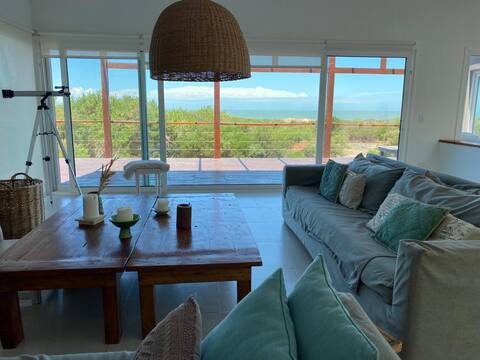
Casa Gratitud Barrio Senderos IV
Entire Place • 3 bedrooms
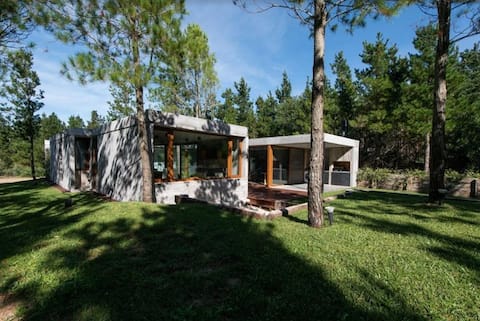
Casa en Barrio Marítimo
Entire Place • 3 bedrooms

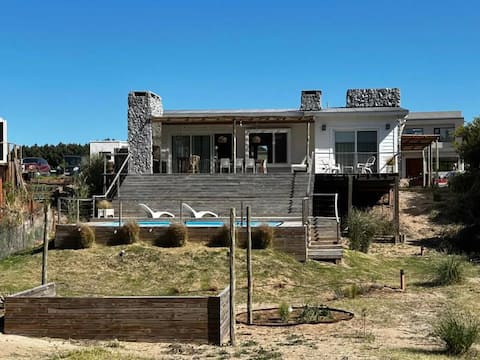
Fin de semana largo casa de campo
Entire Place • 5 bedrooms
Casa Senderos IV
Entire Place • 3 bedrooms
Casa Costa Esmeralda Senderos IV
Entire Place • 3 bedrooms
Note: Performance varies based on location, size, amenities, seasonality, and management quality. Data reflects the past 12 months.
Who Are the Top Airbnb Hosts in Provincia de Buenos Aires?
Learn from the best! This table showcases top-performing Airbnb hosts in Provincia de Buenos Aires based on the number of properties managed and estimated total revenue over the past year. Analyze their scale and performance metrics.
| Host Name | Properties | Grossing Revenue | Stay Reviews | Avg Rating |
|---|---|---|---|---|
| Host #451981962 | 2 | $64,079 | 0 | 0.00/5.0 |
| Sergio | 1 | $50,829 | 22 | 4.91/5.0 |
| Host #240470090 | 1 | $32,791 | 0 | 0.00/5.0 |
| Host #276092038 | 2 | $31,554 | 0 | 0.00/5.0 |
| Host #273686977 | 1 | $30,408 | 0 | 0.00/5.0 |
| Host #79349 | 1 | $25,592 | 0 | 0.00/5.0 |
| Alejandra | 1 | $23,552 | 14 | 5.00/5.0 |
| Host #478582885 | 1 | $20,072 | 0 | 0.00/5.0 |
| Ornela | 1 | $19,245 | 3 | 5.00/5.0 |
| Zucho | 1 | $15,094 | 8 | 4.88/5.0 |
Analyzing the strategies of top hosts, such as their property selection, pricing, and guest communication, can offer valuable lessons for optimizing your own Airbnb operations in Provincia de Buenos Aires.
How Does Provincia de Buenos Aires's Airbnb Market Compare to Nearby Cities?
How does the Provincia de Buenos Aires Airbnb market stack up against its neighbors? Compare key performance metrics like average monthly revenue, ADR, and occupancy rates in surrounding areas to understand the broader regional STR landscape.
Compared with General Pacheco, Provincia de Buenos Aires has 14 percentage points lower occupancy and about $100 higher ADR. That helps frame whether this market is winning more on demand, pricing, or both.
| Market | Active Properties | Monthly Revenue | Daily Rate | Avg. Occupancy |
|---|---|---|---|---|
| Tigre | 339 | $1,641 | $313.51 | 31% |
| Open Door | 14 | $1,627 | $160.71 | 33% |
| Lobos | 48 | $1,575 | $210.03 | 26% |
| Saladillo | 12 | $1,567 | $168.53 | 20% |
| Rincón de Milberg | 59 | $1,565 | $179.97 | 36% |
| El Cazador | 35 | $1,479 | $170.48 | 31% |
| Exaltación de la Cruz | 22 | $1,436 | $151.38 | 34% |
| General Pacheco | 14 | $1,302 | $140.80 | 37% |
| Zelaya | 28 | $1,248 | $171.96 | 32% |
| Luján | 49 | $1,193 | $152.00 | 32% |
Frequently Asked Questions About Airbnb in Provincia de Buenos Aires
These quick answers summarize the most common investor and operator questions using AirROI's latest market data for Provincia de Buenos Aires.
How much do Airbnb hosts make in Provincia de Buenos Aires?
Provincia de Buenos Aires hosts earn about $19,607 per year on average, with an average nightly rate of $241 and RevPAR of N/A. Those figures describe the typical revenue environment for active listings in Provincia de Buenos Aires, Provincia de Buenos Aires, not the ceiling for the best operators. Source: AirROI 2025 data, Provincia de Buenos Aires market, May 2024 to April 2025.
What is the average Airbnb occupancy rate in Provincia de Buenos Aires?
The average Airbnb occupancy rate in Provincia de Buenos Aires is 22.6%. May is the strongest month and January is the softest, so hosts should expect demand to move meaningfully throughout the year rather than stay flat.
What is the average Airbnb daily rate in Provincia de Buenos Aires?
Listings in Provincia de Buenos Aires average $241 per night. The broader pricing spread also matters: lower-performing listings cluster closer to the lower quartiles, while premium homes can price materially above the city average when demand spikes or listing quality stands out.
How many Airbnb listings are active in Provincia de Buenos Aires?
Provincia de Buenos Aires currently has about 19 active Airbnb listings in AirROI's market dataset. That supply count helps explain how competitive the market is, how much depth there is for benchmarking, and whether the market behaves like a niche destination or a scaled urban market.
How strict are short-term rental regulations in Provincia de Buenos Aires?
AirROI currently classifies the short-term rental regulation level in Provincia de Buenos Aires as Low. The dataset also shows about 0.0% of listings with registration evidence. That is a market signal, not legal advice, so hosts should still confirm current licensing and compliance rules locally before listing.
What is the RevPAR for Airbnb in Provincia de Buenos Aires?
RevPAR in Provincia de Buenos Aires is about N/A. That metric combines pricing and occupancy into one efficiency number, so it is often a better quick benchmark than ADR alone when investors want to compare how well listings convert nightly rates into realized revenue.
Is Airbnb profitable in Provincia de Buenos Aires?
Occupancy of 22.6% means Provincia de Buenos Aires is a more selective market. Profitability is achievable but requires careful cost management, premium positioning, or targeting longer stays to reduce turnover. Average annual revenue is $19,607, but individual returns depend on property type, location within the city, and the host's operating efficiency.
How far in advance do guests book Airbnb in Provincia de Buenos Aires?
The average booking lead time in Provincia de Buenos Aires is about 23 days — a moderate lead time that gives hosts planning visibility while still benefiting from last-minute bookings. Hosts who understand their market's booking cadence can adjust minimum stays and pricing windows accordingly.
What are the best neighborhoods for Airbnb in Provincia de Buenos Aires?
Based on AirROI's analysis, some of the top neighborhoods for short-term rentals in Provincia de Buenos Aires include La Plata, Tigre, San Isidro. Each area attracts different guest profiles — from business travelers to leisure visitors — so the best location depends on the property type and target audience a host is aiming for. See the full neighborhood breakdown above.
What type of property performs best on Airbnb in Provincia de Buenos Aires?
entire_home listings make up 94.7% of the active supply in Provincia de Buenos Aires. The most common configuration does not always mean the most profitable — operators who identify underserved property types or bedroom counts can sometimes outperform the market average by filling a gap in local supply.
How does Provincia de Buenos Aires compare to nearby Airbnb markets?
Among neighboring markets, Tigre posts $19,694 in average annual revenue with 30.9% occupancy, compared to Provincia de Buenos Aires's $19,607 and 22.6%. Comparing nearby markets helps investors understand whether a destination's performance reflects local demand or broader regional trends.
When is the peak season for Airbnb in Provincia de Buenos Aires?
May is the highest-revenue month in Provincia de Buenos Aires, while January is the softest. The revenue spread between them indicates a highly seasonal market — revenue in the peak month is more than double the low month, so cash-flow planning and pricing automation are critical.
About AirROI Market Data
AirROI tracks over 20 million properties across 190+ countries and maintains 15+ years of historical performance data, making it one of the deepest Airbnb and STR intelligence platforms available. The analytics pipeline aggregates listing-level data monthly — revenue, occupancy, nightly rates, RevPAR, guest demographics, booking patterns, and competitive supply — so investors and operators can benchmark any market against its own history and against neighboring destinations.
Real estate investors, property managers, financial institutions, hedge funds, tourism boards, hospitality consultants, tech platforms, and academic researchers rely on AirROI data to underwrite acquisitions, optimize pricing, model macro trends, and conduct peer-reviewed research. Data is available through in-depth market reports like this one and the Airbnb API with 22 endpoints and an Airbnb MCP Server for AI agents.
AirROI proprietary analytics as of 2025-04-30. Metrics reflect trailing twelve-month aggregates from active listings. Revenue figures are market averages, not projections. Neighborhood descriptions are AI-generated and reviewed for accuracy. For full methodology, see the data methodology page.