Abobo, Abidjan Airbnb Market Data 2025: STR Report & Statistics
How much can you earn on Airbnb in Abobo, Abidjan? Based on AirROI's 2025 dataset (May 2024 – April 2025), the short answer is $6,125 per year — at a $89 nightly rate, 22.4% occupancy, and a N/A RevPAR.
With just 46 active listings, Abobo is a micro-market where selective demand that rewards strong listing quality and pricing strategy. Supply grew 228.6% over the past year, yet revenue and nightly rates both trended upward — a signal that traveler demand is outpacing new inventory rather than being diluted by it. For hosts, pricing power remains intact even as competition increases.
Regulation is low with minimal registration requirements, pointing to an operator-friendly environment. In a market this size, differentiated listings with strong reviews can capture outsized returns relative to the competition.
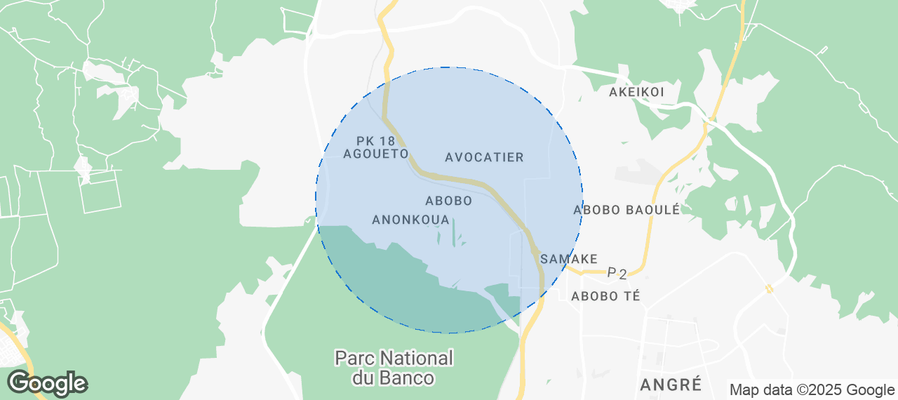
Table of Contents [hide] [show]
What Are the Key Airbnb Metrics in Abobo?
In Abobo, the headline Airbnb metrics are $6,125 in average annual revenue,22.4% occupancy, $89 ADR, and $0 in RevPAR, and guests book about 7 days in advance.
How Much Do Airbnb Hosts Earn Monthly in Abobo?
Understanding the monthly revenue variations for Airbnb listings in Abobo is key to maximizing your short term rental income potential. Seasonality significantly impacts earnings. Our analysis, based on data from the past 12 months, shows that the peak revenue month for STRs in Abobo is typically May, while December often presents the lowest earnings, highlighting opportunities for strategic pricing adjustments during shoulder and low seasons. Explore the typical Airbnb income in Abobo across different performance tiers:
- Best-in-class properties (Top 10%) achieve $2,403+ monthly, often utilizing dynamic pricing and superior guest experiences.
- Strong performing properties (Top 25%) earn $1,353 or more, indicating effective management and desirable locations/amenities.
- Typical properties (Median) generate around $834 per month, representing the average market performance.
- Entry-level properties (Bottom 25%) see earnings around $476, often with potential for optimization.
Average Monthly Airbnb Earnings Trend in Abobo
What Is the Monthly Airbnb Occupancy Rate in Abobo?
Maximize your bookings by understanding the Abobo STR occupancy trends. Seasonal demand shifts significantly influence how often properties are booked. Typically, Augustsees the highest demand (peak season occupancy), while July experiences the lowest (low season). Effective strategies, like adjusting minimum stays or offering promotions, can boost occupancy during slower periods. Here's how different property tiers perform in Abobo:
- Best-in-class properties (Top 10%) achieve 63%+ occupancy, indicating high desirability and potentially optimized availability.
- Strong performing properties (Top 25%) maintain 53% or higher occupancy, suggesting good market fit and guest satisfaction.
- Typical properties (Median) have an occupancy rate around 28%.
- Entry-level properties (Bottom 25%) average 20% occupancy, potentially facing higher vacancy.
Average Monthly Occupancy Rate Trend in Abobo
What Is the Average Airbnb Nightly Rate in Abobo?
Effective short term rental pricing strategy in Abobo involves understanding monthly ADR fluctuations. The Average Daily Rate (ADR) for Airbnb in Abobo typically peaks in December and dips lowest during November. Leveraging Airbnb dynamic pricing tools or strategies based on this seasonality can significantly boost revenue. Here's a look at the typical nightly rates achieved:
- Best-in-class properties (Top 10%) command rates of $129+ per night, often due to premium features or locations.
- Strong performing properties (Top 25%) achieve nightly rates of $87 or more.
- Typical properties (Median) charge around $47 per night.
- Entry-level properties (Bottom 25%) earn around $32 per night.
Average Daily Rate (ADR) Trend by Month in Abobo
What Is the RevPAR for Airbnb in Abobo?
RevPAR in Abobo is currently N/A. Because RevPAR combines nightly rates with realized occupancy, it is one of the cleanest ways to compare how efficiently listings turn demand into revenue across the market.
- Entry-level properties (Bottom 25%) see N/A RevPAR.
- Typical properties (Median) generate N/A RevPAR.
- Strong performers (Top 25%) earn N/A RevPAR.
- Best-in-class (Top 10%) achieve N/A RevPAR.
Average Monthly RevPAR Trend in Abobo
RevPAR Insights for Abobo
- RevPAR peaks in Jan and bottoms out in Jan, mirroring the broader seasonal demand pattern and suggesting opportunities for dynamic pricing.
Recommendations for Hosts
- Track your own RevPAR monthly against these Abobo benchmarks. If your RevPAR falls below the median of N/A, examine whether low occupancy or low ADR is the primary drag.
- Use RevPAR rather than revenue alone when comparing properties of different sizes — it normalizes for available nights and gives a more accurate picture of performance.
Get Live Abobo Market Intelligence 👇
Explore Real-time Analytics
When Is the Peak Season for Airbnb in Abobo?
Abobo's peak Airbnb season falls in May, June, October, while the softest stretch is January, February, December. Overall, the market shows highly seasonal trends requiring careful strategy, which should guide pricing, minimum stays, and cash-flow planning.
Peak Season (May, June, October)
- Revenue averages $2,096 per month
- Occupancy rates average 48.3%
- Daily rates average $70
Shoulder Season
- Revenue averages $1,010 per month
- Occupancy maintains around 36.8%
- Daily rates hold near $74
Low Season (January, February, December)
- Revenue drops to average $481 per month
- Occupancy decreases to average 31.1%
- Daily rates adjust to average $84
Seasonality Insights for Abobo
- Airbnb seasonality in Abobo is pronounced. Revenue swings sharply between peak and low months, which means pricing strategy, minimum-stay settings, and cash reserves all need to account for extended slower periods.
- During the high season, the absolute peak month showcases Abobo's highest earning potential, with monthly revenues climbing to $2,553, occupancy reaching 61.3%, and ADRs peaking at $88.
- Conversely, the slowest single month marks the market's lowest point — revenue may dip to $374, occupancy could drop to 23.9%, and ADRs may adjust to $70.
- Lower occupancy paired with meaningful seasonality means hosts in Abobo need to maximize every peak-season booking and seriously consider whether off-season pricing adjustments or minimum-stay changes can capture incremental revenue.
Seasonal Strategies for Maximizing Profit
- Peak Season: Maximize revenue through premium pricing and potentially longer minimum stays. Ensure high availability and consider tightening cancellation policies to reduce last-minute gaps.
- Low Season: Offer competitive pricing, extended-stay discounts, and flexible cancellation policies. Target off-season travelers like remote workers, budget-conscious guests, and travelers with flexible schedules.
- Shoulder Seasons: Implement dynamic pricing that bridges peak and low rates. Target weekend travelers, local events, and business visitors. Slightly more flexible terms than peak season can help maintain occupancy without deep discounting.
- In a highly seasonal market like Abobo, building a cash reserve during the top months is essential for covering fixed costs during the slow period. Automated pricing tools can help capture demand shifts in real time.
Do You Need a License for Airbnb in Abobo?
Low regulation and minimal registration activity in Abobo, Abidjan, Côte d’Ivoire point to an operator-friendly environment. That said, even low-regulation markets may have tax collection requirements, safety standards, or HOA rules that affect short-term rental operations. Always verify the latest short-term rental regulations and Airbnb license requirements directly with local government authorities for Abobo to ensure full compliance before hosting.
(Source: AirROI data, 2026, finding no licensed listings among those analyzed)
What Are the Best Neighborhoods for Airbnb in Abobo?
With a compact short-term rental market, Abobo gives early-mover hosts an advantage in the right neighborhoods. The areas listed below are where guest demand and local attractions converge — a useful lens for investors evaluating whether to enter this market and where to position their listing.
| Neighborhood / Area | Why Host Here? (Target Guests & Appeal) | Key Attractions & Landmarks |
|---|---|---|
| Abobo Boulangerie | A bustling area known for its local markets and eateries. Ideal for guests wanting an authentic experience of everyday life in Abidjan. | Local markets, Street food stalls, Cafés, Cultural centers, Community events |
| Abobo Adjamé | A vibrant neighborhood famous for its lively atmosphere and cultural diversity. Popular among tourists who want to explore local culture and history. | Adjamé Market, Local music events, Artisans and craft shops, Cultural festivals, Street performances |
| Abobo Plateau | Known for its residential charm and proximity to various amenities. Perfect for longer stays and families seeking a homely environment. | Parks and recreational areas, Family-friendly attractions, Schools and educational institutions, Local shops and markets, Community centers |
| Abobo Avocatier | A quieter area that offers a blend of local life and accessibility to urban amenities. Great for guests looking for a peaceful stay with easy access to the city. | Local parks, Green spaces, Quiet neighborhoods, Restaurants and cafés, Proximity to transport |
| Abobo N'djili | A developing area that offers growth potential for Airbnb investments. Attractive for budget travelers and those exploring off-the-beaten-path locations. | Local community events, Market days, Cultural gatherings, Artisan workshops, Historical sites |
| Abobo La Gare | This area is known for its transport links and connectivity within Abidjan. Ideal for business travelers and vacationers who prioritize accessibility. | Train station, Transport links, Shopping centers, Local eateries, Business services |
| Abobo Lac | A scenic area near the lake, providing a tranquil environment for guests who enjoy nature and outdoor activities. Excellent for nature lovers. | Lakeside activities, Nature walks, Fishing spots, Outdoor picnics, Scenic views |
| Abobo Sogefia | This neighborhood is characterized by its friendly atmosphere and community spirit. Great for travelers looking for a welcoming environment. | Community events, Local sports facilities, Public parks, Social clubs, Cultural exchanges |
With 8 distinct neighborhoods showing meaningful short-term rental activity, Abobo offers diversification within a single market. Investors can tailor their strategy — from high-turnover tourist zones to quieter residential areas that attract longer stays and remote workers.
What Types of Properties Are on Airbnb in Abobo?
Room Type Distribution
Property Type Distribution
Market Composition Insights for Abobo
- The Abobo Airbnb market composition is heavily skewed towards Entire Home/Apt listings, which make up 82.6% of the 46 active rentals. This indicates strong guest preference for privacy and space.
- Looking at the property type distribution in Abobo, Apartment/Condo properties are the most common (78.3%), reflecting the local real estate landscape.
- The presence of 8.7% Hotel/Boutique listings indicates integration with traditional hospitality.
Abobo Airbnb Room Capacity Analysis (2026): Bedroom Distribution
Distribution of Listings by Number of Bedrooms
Room Capacity Insights for Abobo
- The dominant room capacity in Abobo is 1 bedroom listings, making up 65.2% of the market. This suggests a strong demand for properties suitable for couples or solo travelers.
- Together, 1 bedroom and 2 bedrooms properties represent 91.3% of the active Airbnb listings in Abobo, indicating a high concentration in these sizes.
- With over half the market (65.2%) consisting of studios or 1-bedroom units, Abobo is particularly well-suited for individuals or couples.
- Listings with 3+ bedrooms (8.7%) represent a smaller niche, potentially indicating an underserved market for larger group accommodations in Abobo.
Abobo Vacation Rental Guest Capacity Trends (2026)
Distribution of Listings by Guest Capacity
Guest Capacity Insights for Abobo
- The most common guest capacity trend in Abobo vacation rentals is listings accommodating 2 guests (45.7%). This suggests the primary traveler segment is likely couples or solo travelers.
- Properties designed for 2 guests and 4 guests dominate the Abobo STR market, accounting for 78.3% of listings.
- A significant 47.9% of listings cater specifically to 1-2 guests, highlighting strong demand from couples and solo travelers in Abobo.
- 10.8% of properties accommodate 6+ guests, serving the market segment for larger families or group travel in Abobo.
- On average, properties in Abobo are equipped to host 3.3 guests.
What Amenities Do Airbnb Guests Expect in Abobo?
Amenity Prevalence
Amenity Insights for Abobo
- Essential amenities in Abobo that guests expect include: Air conditioning, TV, Kitchen, Wifi, Essentials, Hot water, Smoke alarm. Lacking these (any) could significantly impact bookings.
- Popular amenities like Dryer, Carbon monoxide alarm, Washer are common but not universal. Offering these can provide a competitive edge.
Recommendations for Hosts
- Ensure your listing includes all essential amenities for Abobo: Air conditioning, TV, Kitchen, Wifi, Essentials, Hot water, Smoke alarm.
- Prioritize adding missing essentials: Wifi, Essentials, Hot water, Smoke alarm.
- Consider adding popular differentiators like Dryer or Carbon monoxide alarm to increase appeal.
- Highlight unique or less common amenities you offer (e.g., hot tub, dedicated workspace, EV charger) in your listing description and photos.
- Regularly check competitor amenities in Abobo to stay competitive.
Dive Deeper: Advanced Abobo STR Market Data (2026)
Ready to unlock more insights? AirROI provides access to advanced metrics and comprehensive Airbnb data for Abobo. Explore detailed analytics beyond this report to refine your investment strategy, optimize pricing, and maximize your vacation rental profits.
Explore Advanced MetricsAbobo Airbnb Guest Demographics & Profile Analysis (2026)
Guest Profile Summary for Abobo
- The typical guest profile for Airbnb in Abobo consists of predominantly international visitors (100%), with top international origins including Benin, typically belonging to the Post-2000s (Gen Z/Alpha) group (50%), primarily speaking French or English.
- Domestic travelers account for 0.0% of guests.
- Key international markets include France (66.7%) and Benin (13.3%).
- Top languages spoken are French (50%) followed by English (31.3%).
- A significant demographic segment is the Post-2000s (Gen Z/Alpha) group, representing 50% of guests.
Recommendations for Hosts
- Focus marketing internationally, particularly towards travelers from Benin.
- Offer listing details and communication support in French.
- Tailor amenities and listing descriptions to appeal to the dominant Post-2000s (Gen Z/Alpha) demographic (e.g., highlight fast WiFi, smart home features, local guides).
- Highlight unique local experiences or amenities relevant to the primary guest profile.
- Consider seasonal promotions aligned with peak travel times for key origin markets.
Abobo Airbnb Booking Patterns (2026): Available vs. Booked Days
Available Days Distribution
Booked Days Distribution
Booking Pattern Insights for Abobo
- The most common availability pattern in Abobo falls within the 271-366 days range, representing 91.3% of listings. This suggests many properties have significant open periods on their calendars.
- Approximately 95.6% of listings show high availability (181+ days open annually), indicating potential for increased bookings or specific owner usage patterns.
- For booked days, the 31-90 days range is most frequent in Abobo (87%), reflecting common guest stay durations or potential owner blocking patterns.
- A notable 4.3% of properties secure long booking periods (181+ days booked per year), highlighting successful long-term rental strategies or significant owner usage.
How Far in Advance Do Guests Book Airbnb in Abobo?
Average Booking Lead Time by Month
Booking Lead Time Insights for Abobo
- The overall average booking lead time for vacation rentals in Abobo is 7 days.
- Guests book furthest in advance for stays during August (average 32 days), likely coinciding with peak travel demand or local events.
- The shortest booking windows occur for stays in May (average 0 days), indicating more last-minute travel plans during this time.
- Seasonally, Fall (18 days avg.) sees the longest lead times, while Winter (6 days avg.) has the shortest, reflecting typical travel planning cycles.
Recommendations for Hosts
- Use the overall average lead time (7 days) as a baseline for your pricing and availability strategy in Abobo.
- For August stays, consider implementing length-of-stay discounts or slightly higher rates for bookings made less than 32 days out to capitalize on advance planning.
- Target marketing efforts for the Fall season well in advance (at least 18 days) to capture early planners.
- Monitor your own booking lead times against these Abobo averages to identify opportunities for dynamic pricing adjustments.
Abobo Airbnb Minimum Stay Requirements Analysis
Distribution of Listings by Minimum Night Requirement
1 Night
32 listings
76.2% of total
2 Nights
4 listings
9.5% of total
3 Nights
2 listings
4.8% of total
7-29 Nights
2 listings
4.8% of total
30+ Nights
2 listings
4.8% of total
Key Insights
- The most prevalent minimum stay requirement in Abobo is 1 Night, adopted by 76.2% of listings. This highlights the market's preference for shorter, flexible bookings.
- A strong majority (85.7%) of the Abobo Airbnb data shows acceptance of very short stays (1-2 nights), indicating a dynamic, high-turnover market.
Recommendations
- Align with the market by considering a 1 Night minimum stay, as 76.2% of Abobo hosts use this setting.
- Adjust minimum nights based on seasonality – potentially shorter during low season and longer during peak demand periods in Abobo.
Abobo Airbnb Cancellation Policy Trends Analysis (2026)
Moderate
1 listings
20% of total
Firm
1 listings
20% of total
Strict
3 listings
60% of total
Cancellation Policy Insights for Abobo
- The prevailing Airbnb cancellation policy trend in Abobo is Strict, used by 60% of listings.
- A majority (80.0%) of hosts in Abobo utilize Firm or Strict policies, indicating a market where hosts prioritize booking security.
Recommendations for Hosts
- Consider adopting a Strict policy to align with the 60% market standard in Abobo.
- With 60% using Strict terms, this is a viable option in Abobo, particularly for high-value properties or during peak demand periods.
- Regularly review your cancellation policy against competitors and market demand shifts in Abobo.
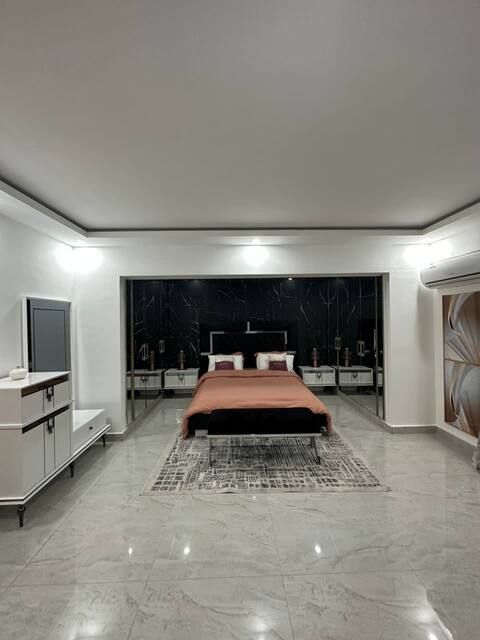
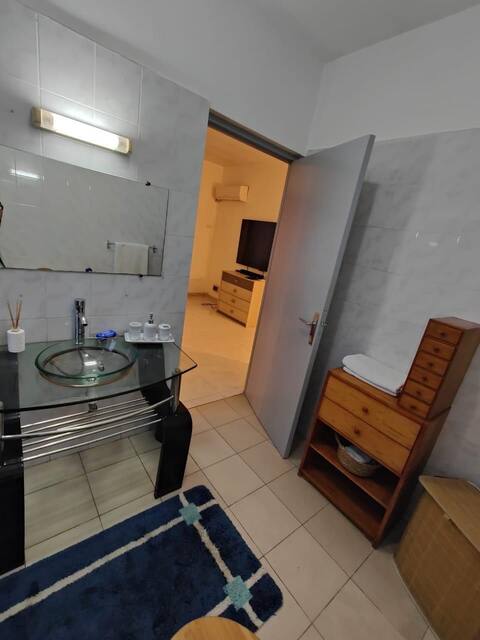
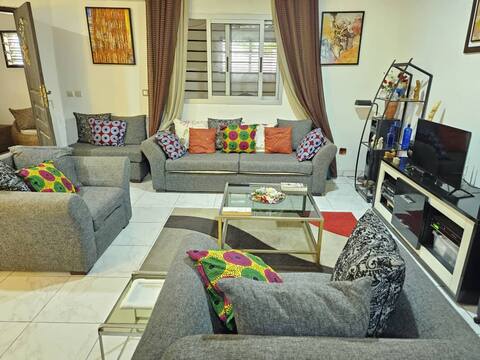
What Do the Top Airbnb Listings in Abobo Look Like?
Benchmark your potential! Explore examples of top-performing Airbnb properties in Abobobased on Trailing Twelve Month (TTM) revenue. Analyze their characteristics, revenue, occupancy rate, and ADR to understand what drives success in this market.
Appat Penthouse luxe à Abidjan
Entire Place • 3 bedrooms
Bel appartement de 4 pièces
Entire Place • 3 bedrooms
Maison meublée vos séjours
Entire Place • 2 bedrooms
Chic Residenz One N‘Dotre
Entire Place • 2 bedrooms
Séjour de luxe
Private Room • 2 bedrooms
Oasis
Entire Place • 2 bedrooms
Note: Performance varies based on location, size, amenities, seasonality, and management quality. Data reflects the past 12 months.
Who Are the Top Airbnb Hosts in Abobo?
Learn from the best! This table showcases top-performing Airbnb hosts in Abobo based on the number of properties managed and estimated total revenue over the past year. Analyze their scale and performance metrics.
| Host Name | Properties | Grossing Revenue | Stay Reviews | Avg Rating |
|---|---|---|---|---|
| Host #318600224 | 3 | $67,684 | 0 | 0.00/5.0 |
| Host #401178225 | 1 | $19,969 | 0 | 0.00/5.0 |
| Host #460765279 | 1 | $11,816 | 0 | 0.00/5.0 |
| Host #30413105 | 1 | $11,611 | 0 | 0.00/5.0 |
| Host #208184839 | 1 | $10,493 | 0 | 0.00/5.0 |
| Host #77267746 | 2 | $10,086 | 0 | 0.00/5.0 |
| Host #116735896 | 1 | $8,584 | 0 | 0.00/5.0 |
| Host #463712570 | 1 | $8,107 | 0 | 0.00/5.0 |
| Host #401903226 | 1 | $8,093 | 0 | 0.00/5.0 |
| Host #431573178 | 1 | $7,968 | 0 | 0.00/5.0 |
Analyzing the strategies of top hosts, such as their property selection, pricing, and guest communication, can offer valuable lessons for optimizing your own Airbnb operations in Abobo.
How Does Abobo's Airbnb Market Compare to Nearby Cities?
How does the Abobo Airbnb market stack up against its neighbors? Compare key performance metrics like average monthly revenue, ADR, and occupancy rates in surrounding areas to understand the broader regional STR landscape.
Compared with Le Plateau, Abobo has 9 percentage points lower occupancy and about $35 lower ADR. That helps frame whether this market is winning more on demand, pricing, or both.
| Market | Active Properties | Monthly Revenue | Daily Rate | Avg. Occupancy |
|---|---|---|---|---|
| Assinie-Mafia | 47 | $2,956 | $533.53 | 21% |
| Assouindé | 36 | $2,407 | $463.43 | 18% |
| Le Plateau | 78 | $908 | $124.24 | 31% |
| Azuretti | 11 | $891 | $113.53 | 24% |
| Marcory | 273 | $843 | $125.00 | 28% |
| Port-Bouët | 35 | $838 | $159.48 | 23% |
| Cocody | 1,819 | $618 | $94.74 | 27% |
| Grand-Bassam | 77 | $615 | $92.78 | 25% |
| Yamoussoukro | 85 | $608 | $107.01 | 22% |
| Anyama | 14 | $601 | $105.98 | 18% |
Frequently Asked Questions About Airbnb in Abobo
These quick answers summarize the most common investor and operator questions using AirROI's latest market data for Abobo.
How much do Airbnb hosts make in Abobo?
Abobo hosts earn about $6,125 per year on average, with an average nightly rate of $89 and RevPAR of N/A. Those figures describe the typical revenue environment for active listings in Abobo, Abidjan, not the ceiling for the best operators. Source: AirROI 2025 data, Abobo market, May 2024 to April 2025.
What is the average Airbnb occupancy rate in Abobo?
The average Airbnb occupancy rate in Abobo is 22.4%. May is the strongest month and December is the softest, so hosts should expect demand to move meaningfully throughout the year rather than stay flat.
What is the average Airbnb daily rate in Abobo?
Listings in Abobo average $89 per night. The broader pricing spread also matters: lower-performing listings cluster closer to the lower quartiles, while premium homes can price materially above the city average when demand spikes or listing quality stands out.
How many Airbnb listings are active in Abobo?
Abobo currently has about 46 active Airbnb listings in AirROI's market dataset. That supply count helps explain how competitive the market is, how much depth there is for benchmarking, and whether the market behaves like a niche destination or a scaled urban market.
How strict are short-term rental regulations in Abobo?
AirROI currently classifies the short-term rental regulation level in Abobo as Low. The dataset also shows about 0.0% of listings with registration evidence. That is a market signal, not legal advice, so hosts should still confirm current licensing and compliance rules locally before listing.
What is the RevPAR for Airbnb in Abobo?
RevPAR in Abobo is about N/A. That metric combines pricing and occupancy into one efficiency number, so it is often a better quick benchmark than ADR alone when investors want to compare how well listings convert nightly rates into realized revenue.
Is Airbnb profitable in Abobo?
Occupancy of 22.4% means Abobo is a more selective market. Profitability is achievable but requires careful cost management, premium positioning, or targeting longer stays to reduce turnover. Average annual revenue is $6,125, but individual returns depend on property type, location within the city, and the host's operating efficiency.
How far in advance do guests book Airbnb in Abobo?
The average booking lead time in Abobo is about 7 days — an extremely short window that favors hosts with flexible availability and last-minute pricing strategies. Hosts who understand their market's booking cadence can adjust minimum stays and pricing windows accordingly.
What are the best neighborhoods for Airbnb in Abobo?
Based on AirROI's analysis, some of the top neighborhoods for short-term rentals in Abobo include Abobo Boulangerie, Abobo Adjamé, Abobo Plateau. Each area attracts different guest profiles — from business travelers to leisure visitors — so the best location depends on the property type and target audience a host is aiming for. See the full neighborhood breakdown above.
What type of property performs best on Airbnb in Abobo?
entire_home listings make up 82.6% of the active supply in Abobo. The most common configuration does not always mean the most profitable — operators who identify underserved property types or bedroom counts can sometimes outperform the market average by filling a gap in local supply.
How does Abobo compare to nearby Airbnb markets?
Among neighboring markets, Assinie-Mafia posts $35,468 in average annual revenue with 21.0% occupancy, compared to Abobo's $6,125 and 22.4%. Comparing nearby markets helps investors understand whether a destination's performance reflects local demand or broader regional trends.
When is the peak season for Airbnb in Abobo?
May is the highest-revenue month in Abobo, while December is the softest. The revenue spread between them indicates a highly seasonal market — revenue in the peak month is more than double the low month, so cash-flow planning and pricing automation are critical.
About AirROI Market Data
AirROI tracks over 20 million properties across 190+ countries and maintains 15+ years of historical performance data, making it one of the deepest Airbnb and STR intelligence platforms available. The analytics pipeline aggregates listing-level data monthly — revenue, occupancy, nightly rates, RevPAR, guest demographics, booking patterns, and competitive supply — so investors and operators can benchmark any market against its own history and against neighboring destinations.
Real estate investors, property managers, financial institutions, hedge funds, tourism boards, hospitality consultants, tech platforms, and academic researchers rely on AirROI data to underwrite acquisitions, optimize pricing, model macro trends, and conduct peer-reviewed research. Data is available through in-depth market reports like this one and the Airbnb API with 22 endpoints and an Airbnb MCP Server for AI agents.
AirROI proprietary analytics as of 2025-04-30. Metrics reflect trailing twelve-month aggregates from active listings. Revenue figures are market averages, not projections. Neighborhood descriptions are AI-generated and reviewed for accuracy. For full methodology, see the data methodology page.