Neuenhagen bei Berlin, Brandenburg Airbnb Market Data 2026: STR Report & Statistics
How much can you earn on Airbnb in Neuenhagen bei Berlin, Brandenburg? Based on AirROI's 2026 dataset (January 2025 – December 2025), the short answer is $14,298 per year — at a $139 nightly rate, 41.2% occupancy, and a N/A RevPAR.
With just 18 active listings, Neuenhagen bei Berlin is a micro-market where moderate demand with room for well-positioned listings to outperform. Supply grew 157.1% year over year, and the market is recalibrating around a new competitive baseline. This is the stage where hosts who invest in amenities, guest experience, and dynamic pricing build durable advantages that compound as the market matures.
Regulation is low with minimal registration requirements, pointing to an operator-friendly environment. In a market this size, differentiated listings with strong reviews can capture outsized returns relative to the competition.
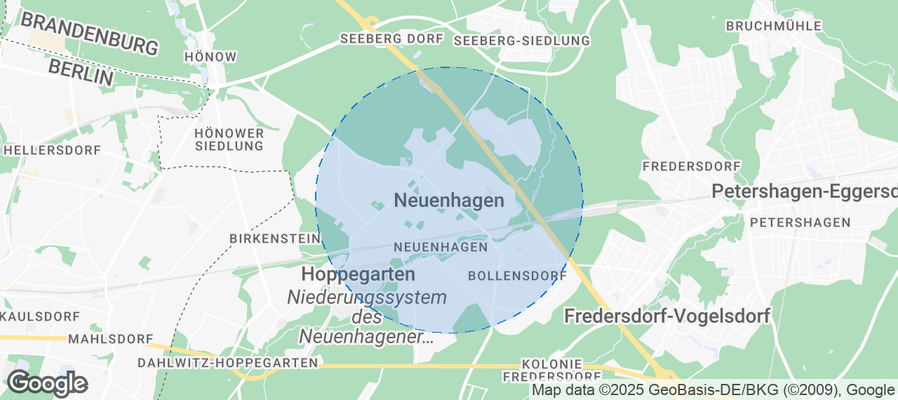
Table of Contents [hide] [show]
What Are the Key Airbnb Metrics in Neuenhagen bei Berlin?
In Neuenhagen bei Berlin, the headline Airbnb metrics are $14,298 in average annual revenue,41.2% occupancy, $139 ADR, and $0 in RevPAR, and guests book about 45 days in advance.
How Much Do Airbnb Hosts Earn Monthly in Neuenhagen bei Berlin?
Understanding the monthly revenue variations for Airbnb listings in Neuenhagen bei Berlin is key to maximizing your short term rental income potential. Seasonality significantly impacts earnings. Our analysis, based on data from the past 12 months, shows that the peak revenue month for STRs in Neuenhagen bei Berlin is typically June, while March often presents the lowest earnings, highlighting opportunities for strategic pricing adjustments during shoulder and low seasons. Explore the typical Airbnb income in Neuenhagen bei Berlin across different performance tiers:
- Best-in-class properties (Top 10%) achieve $4,086+ monthly, often utilizing dynamic pricing and superior guest experiences.
- Strong performing properties (Top 25%) earn $2,046 or more, indicating effective management and desirable locations/amenities.
- Typical properties (Median) generate around $1,199 per month, representing the average market performance.
- Entry-level properties (Bottom 25%) see earnings around $676, often with potential for optimization.
Average Monthly Airbnb Earnings Trend in Neuenhagen bei Berlin
What Is the Monthly Airbnb Occupancy Rate in Neuenhagen bei Berlin?
Maximize your bookings by understanding the Neuenhagen bei Berlin STR occupancy trends. Seasonal demand shifts significantly influence how often properties are booked. Typically, Julysees the highest demand (peak season occupancy), while January experiences the lowest (low season). Effective strategies, like adjusting minimum stays or offering promotions, can boost occupancy during slower periods. Here's how different property tiers perform in Neuenhagen bei Berlin:
- Best-in-class properties (Top 10%) achieve 86%+ occupancy, indicating high desirability and potentially optimized availability.
- Strong performing properties (Top 25%) maintain 76% or higher occupancy, suggesting good market fit and guest satisfaction.
- Typical properties (Median) have an occupancy rate around 50%.
- Entry-level properties (Bottom 25%) average 23% occupancy, potentially facing higher vacancy.
Average Monthly Occupancy Rate Trend in Neuenhagen bei Berlin
What Is the Average Airbnb Nightly Rate in Neuenhagen bei Berlin?
Effective short term rental pricing strategy in Neuenhagen bei Berlin involves understanding monthly ADR fluctuations. The Average Daily Rate (ADR) for Airbnb in Neuenhagen bei Berlin typically peaks in June and dips lowest during March. Leveraging Airbnb dynamic pricing tools or strategies based on this seasonality can significantly boost revenue. Here's a look at the typical nightly rates achieved:
- Best-in-class properties (Top 10%) command rates of $301+ per night, often due to premium features or locations.
- Strong performing properties (Top 25%) achieve nightly rates of $160 or more.
- Typical properties (Median) charge around $97 per night.
- Entry-level properties (Bottom 25%) earn around $74 per night.
Average Daily Rate (ADR) Trend by Month in Neuenhagen bei Berlin
What Is the RevPAR for Airbnb in Neuenhagen bei Berlin?
RevPAR in Neuenhagen bei Berlin is currently N/A. Because RevPAR combines nightly rates with realized occupancy, it is one of the cleanest ways to compare how efficiently listings turn demand into revenue across the market.
- Entry-level properties (Bottom 25%) see N/A RevPAR.
- Typical properties (Median) generate N/A RevPAR.
- Strong performers (Top 25%) earn N/A RevPAR.
- Best-in-class (Top 10%) achieve N/A RevPAR.
Average Monthly RevPAR Trend in Neuenhagen bei Berlin
RevPAR Insights for Neuenhagen bei Berlin
- RevPAR peaks in Jan and bottoms out in Jan, mirroring the broader seasonal demand pattern and suggesting opportunities for dynamic pricing.
Recommendations for Hosts
- Track your own RevPAR monthly against these Neuenhagen bei Berlin benchmarks. If your RevPAR falls below the median of N/A, examine whether low occupancy or low ADR is the primary drag.
- Use RevPAR rather than revenue alone when comparing properties of different sizes — it normalizes for available nights and gives a more accurate picture of performance.
Get Live Neuenhagen bei Berlin Market Intelligence 👇
Explore Real-time Analytics
When Is the Peak Season for Airbnb in Neuenhagen bei Berlin?
Neuenhagen bei Berlin's peak Airbnb season falls in June, September, July, while the softest stretch is January, February, March. Overall, the market shows highly seasonal trends requiring careful strategy, which should guide pricing, minimum stays, and cash-flow planning.
Peak Season (June, September, July)
- Revenue averages $2,370 per month
- Occupancy rates average 60.0%
- Daily rates average $150
Shoulder Season
- Revenue averages $1,738 per month
- Occupancy maintains around 51.6%
- Daily rates hold near $142
Low Season (January, February, March)
- Revenue drops to average $1,156 per month
- Occupancy decreases to average 42.6%
- Daily rates adjust to average $135
Seasonality Insights for Neuenhagen bei Berlin
- Airbnb seasonality in Neuenhagen bei Berlin is pronounced. Revenue swings sharply between peak and low months, which means pricing strategy, minimum-stay settings, and cash reserves all need to account for extended slower periods.
- During the high season, the absolute peak month showcases Neuenhagen bei Berlin's highest earning potential, with monthly revenues climbing to $2,608, occupancy reaching 61.3%, and ADRs peaking at $159.
- Conversely, the slowest single month marks the market's lowest point — revenue may dip to $1,080, occupancy could drop to 34.2%, and ADRs may adjust to $131.
- Understanding both the seasonal averages and these monthly peaks and troughs in revenue, occupancy, and ADR is crucial for maximizing your Airbnb profit potential in Neuenhagen bei Berlin.
Seasonal Strategies for Maximizing Profit
- Peak Season: Maximize revenue through premium pricing and potentially longer minimum stays. Ensure high availability and consider tightening cancellation policies to reduce last-minute gaps.
- Low Season: Offer competitive pricing, extended-stay discounts, and flexible cancellation policies. Target off-season travelers like remote workers, budget-conscious guests, and travelers with flexible schedules.
- Shoulder Seasons: Implement dynamic pricing that bridges peak and low rates. Target weekend travelers, local events, and business visitors. Slightly more flexible terms than peak season can help maintain occupancy without deep discounting.
- In a highly seasonal market like Neuenhagen bei Berlin, building a cash reserve during the top months is essential for covering fixed costs during the slow period. Automated pricing tools can help capture demand shifts in real time.
Do You Need a License for Airbnb in Neuenhagen bei Berlin?
Low regulation and minimal registration activity in Neuenhagen bei Berlin, Brandenburg, Germany point to an operator-friendly environment. That said, even low-regulation markets may have tax collection requirements, safety standards, or HOA rules that affect short-term rental operations. Always verify the latest short-term rental regulations and Airbnb license requirements directly with local government authorities for Neuenhagen bei Berlin to ensure full compliance before hosting.
(Source: AirROI data, 2026, finding no licensed listings among those analyzed)
What Are the Best Neighborhoods for Airbnb in Neuenhagen bei Berlin?
With a compact short-term rental market, Neuenhagen bei Berlin gives early-mover hosts an advantage in the right neighborhoods. The areas listed below are where guest demand and local attractions converge — a useful lens for investors evaluating whether to enter this market and where to position their listing.
| Neighborhood / Area | Why Host Here? (Target Guests & Appeal) | Key Attractions & Landmarks |
|---|---|---|
| Neuenhagen Center | The heart of Neuenhagen, offering easy access to public transport, local shops, and eateries. A prime location for travelers looking for convenience and local experience. | Local restaurants, Parks and recreational areas, Public transport to Berlin, Shopping centers, Cafés |
| Lichtenberg District | A neighboring district with a mix of residential and commercial areas that attracts visitors for its cultural sites and accessibility to Berlin's attractions. | Stasi Museum, Tierpark Berlin, Berlin Hohenschönhausen Memorial, Parks, Public transport access to Berlin |
| Rüdersdorf | Close to Neuenhagen, it offers natural attractions and a quieter environment, ideal for families and nature lovers. | Rüdersdorf limestone quarry, Historic cement factory, Hiking and biking trails, Nature parks |
| Schöneiche | A tranquil suburb with beautiful natural landscapes, great for guests looking for relaxation while being close to urban amenities. | Local parks, Shooting Range, Cycle paths, Outdoor activities |
| Fredersdorf | A nearby town with charming streets and parks, appealing to visitors who wish to explore the Brandenburg region. | Historic town center, Parks, Cafés, Nearby forests and lakes |
| Märkische Scholle | A picturesque area characterized by natural beauty and recreational opportunities, appealing to outdoor enthusiasts and families. | Lakes, Hiking trails, Bike tours, Scenic views |
| Biesdorf | Located further out but connected to public transport, it's attractive for those looking for a quieter stay while having access to urban life. | Biesdorf Palace, Parks, Cafés, Public transport connects to central Berlin |
| Berlin Eastern Suburbs | Though primarily urban, the eastern suburbs offer diverse cultural experiences and are close to Neuenhagen, making it convenient for guests looking to explore Berlin. | Cultural sites, Shopping opportunities, Public transport access to city center, Nightlife |
With 8 distinct neighborhoods showing meaningful short-term rental activity, Neuenhagen bei Berlin offers diversification within a single market. Investors can tailor their strategy — from high-turnover tourist zones to quieter residential areas that attract longer stays and remote workers.
What Types of Properties Are on Airbnb in Neuenhagen bei Berlin?
Room Type Distribution
Property Type Distribution
Market Composition Insights for Neuenhagen bei Berlin
- The Neuenhagen bei Berlin Airbnb market composition is heavily skewed towards Entire Home/Apt listings, which make up 94.4% of the 18 active rentals. This indicates strong guest preference for privacy and space.
- Looking at the property type distribution in Neuenhagen bei Berlin, Apartment/Condo properties are the most common (38.9%), reflecting the local real estate landscape.
- Houses represent a significant 33.3% portion, catering likely to families or larger groups.
- The presence of 16.7% Hotel/Boutique listings indicates integration with traditional hospitality.
Neuenhagen bei Berlin Airbnb Room Capacity Analysis (2026): Bedroom Distribution
Distribution of Listings by Number of Bedrooms
Room Capacity Insights for Neuenhagen bei Berlin
- The dominant room capacity in Neuenhagen bei Berlin is 1 bedroom listings, making up 66.7% of the market. This suggests a strong demand for properties suitable for couples or solo travelers.
- Together, 1 bedroom and 5+ bedrooms properties represent 77.8% of the active Airbnb listings in Neuenhagen bei Berlin, indicating a high concentration in these sizes.
- With over half the market (66.7%) consisting of studios or 1-bedroom units, Neuenhagen bei Berlin is particularly well-suited for individuals or couples.
- A significant 22.2% of listings offer 3+ bedrooms, catering to larger groups and families seeking more space in Neuenhagen bei Berlin.
Neuenhagen bei Berlin Vacation Rental Guest Capacity Trends (2026)
Distribution of Listings by Guest Capacity
Guest Capacity Insights for Neuenhagen bei Berlin
- The most common guest capacity trend in Neuenhagen bei Berlin vacation rentals is listings accommodating 4 guests (38.9%). This suggests the primary traveler segment is likely small families or groups.
- Properties designed for 4 guests and 2 guests dominate the Neuenhagen bei Berlin STR market, accounting for 61.1% of listings.
- 22.3% of properties accommodate 6+ guests, serving the market segment for larger families or group travel in Neuenhagen bei Berlin.
- On average, properties in Neuenhagen bei Berlin are equipped to host 4.1 guests.
What Amenities Do Airbnb Guests Expect in Neuenhagen bei Berlin?
Amenity Prevalence
Amenity Insights for Neuenhagen bei Berlin
- Essential amenities in Neuenhagen bei Berlin that guests expect include: Coffee maker, Wifi, Refrigerator. Lacking these (any) could significantly impact bookings.
- Popular amenities like Hot water kettle, Dishes and silverware, Heating are common but not universal. Offering these can provide a competitive edge.
Recommendations for Hosts
- Ensure your listing includes all essential amenities for Neuenhagen bei Berlin: Coffee maker, Wifi, Refrigerator.
- Consider adding popular differentiators like Hot water kettle or Dishes and silverware to increase appeal.
- Highlight unique or less common amenities you offer (e.g., hot tub, dedicated workspace, EV charger) in your listing description and photos.
- Regularly check competitor amenities in Neuenhagen bei Berlin to stay competitive.
Dive Deeper: Advanced Neuenhagen bei Berlin STR Market Data (2026)
Ready to unlock more insights? AirROI provides access to advanced metrics and comprehensive Airbnb data for Neuenhagen bei Berlin. Explore detailed analytics beyond this report to refine your investment strategy, optimize pricing, and maximize your vacation rental profits.
Explore Advanced MetricsNeuenhagen bei Berlin Airbnb Guest Demographics & Profile Analysis (2026)
Guest Profile Summary for Neuenhagen bei Berlin
- The typical guest profile for Airbnb in Neuenhagen bei Berlin consists of a mix of domestic (55%) and international guests, often arriving from nearby Berlin, typically belonging to the Post-2000s (Gen Z/Alpha) group (50%), primarily speaking English or German.
- Domestic travelers account for 54.6% of guests.
- Key international markets include Germany (54.6%) and Netherlands (6.2%).
- Top languages spoken are English (35.4%) followed by German (26.7%).
- A significant demographic segment is the Post-2000s (Gen Z/Alpha) group, representing 50% of guests.
Recommendations for Hosts
- Balance marketing efforts between domestic and international channels based on the guest mix.
- Tailor amenities and listing descriptions to appeal to the dominant Post-2000s (Gen Z/Alpha) demographic (e.g., highlight fast WiFi, smart home features, local guides).
- Highlight unique local experiences or amenities relevant to the primary guest profile.
- Consider seasonal promotions aligned with peak travel times for key origin markets.
Neuenhagen bei Berlin Airbnb Booking Patterns (2026): Available vs. Booked Days
Available Days Distribution
Booked Days Distribution
Booking Pattern Insights for Neuenhagen bei Berlin
- The most common availability pattern in Neuenhagen bei Berlin falls within the 271-366 days range, representing 55.6% of listings. This suggests many properties have significant open periods on their calendars.
- Approximately 66.7% of listings show high availability (181+ days open annually), indicating potential for increased bookings or specific owner usage patterns.
- For booked days, the 1-30 days range is most frequent in Neuenhagen bei Berlin (27.8%), reflecting common guest stay durations or potential owner blocking patterns.
- A notable 33.3% of properties secure long booking periods (181+ days booked per year), highlighting successful long-term rental strategies or significant owner usage.
How Far in Advance Do Guests Book Airbnb in Neuenhagen bei Berlin?
Average Booking Lead Time by Month
Booking Lead Time Insights for Neuenhagen bei Berlin
- The overall average booking lead time for vacation rentals in Neuenhagen bei Berlin is 45 days.
- Guests book furthest in advance for stays during September (average 92 days), likely coinciding with peak travel demand or local events.
- The shortest booking windows occur for stays in February (average 16 days), indicating more last-minute travel plans during this time.
- Seasonally, Summer (65 days avg.) sees the longest lead times, while Winter (34 days avg.) has the shortest, reflecting typical travel planning cycles.
Recommendations for Hosts
- Use the overall average lead time (45 days) as a baseline for your pricing and availability strategy in Neuenhagen bei Berlin.
- For September stays, consider implementing length-of-stay discounts or slightly higher rates for bookings made less than 92 days out to capitalize on advance planning.
- Target marketing efforts for the Summer season well in advance (at least 65 days) to capture early planners.
- Monitor your own booking lead times against these Neuenhagen bei Berlin averages to identify opportunities for dynamic pricing adjustments.
Neuenhagen bei Berlin Airbnb Minimum Stay Requirements Analysis
Distribution of Listings by Minimum Night Requirement
1 Night
3 listings
16.7% of total
2 Nights
4 listings
22.2% of total
3 Nights
2 listings
11.1% of total
4-6 Nights
3 listings
16.7% of total
7-29 Nights
1 listings
5.6% of total
30+ Nights
5 listings
27.8% of total
Key Insights
- The most prevalent minimum stay requirement in Neuenhagen bei Berlin is 30+ Nights, adopted by 27.8% of listings. This highlights the market's preference for longer commitments.
- A significant segment (27.8%) caters to monthly stays (30+ nights) in Neuenhagen bei Berlin, pointing to opportunities in the extended-stay market.
Recommendations
- Align with the market by considering a 30+ Nights minimum stay, as 27.8% of Neuenhagen bei Berlin hosts use this setting.
- If feasible, allowing 1-night stays, especially midweek or during low season, could capture last-minute bookings, as only 16.7% currently do.
- Explore offering discounts for stays of 30+ nights to attract the 27.8% of the market seeking extended stays.
- Adjust minimum nights based on seasonality – potentially shorter during low season and longer during peak demand periods in Neuenhagen bei Berlin.
Neuenhagen bei Berlin Airbnb Cancellation Policy Trends Analysis (2026)
Flexible
6 listings
33.3% of total
Moderate
3 listings
16.7% of total
Firm
8 listings
44.4% of total
Strict
1 listings
5.6% of total
Cancellation Policy Insights for Neuenhagen bei Berlin
- The prevailing Airbnb cancellation policy trend in Neuenhagen bei Berlin is Firm, used by 44.4% of listings.
- There's a relatively balanced mix between guest-friendly (50.0%) and stricter (50.0%) policies, offering choices for different guest needs.
- Strict cancellation policies are quite rare (5.6%), potentially making listings with this policy less competitive unless justified by high demand or property type.
Recommendations for Hosts
- Consider adopting a Firm policy to align with the 44.4% market standard in Neuenhagen bei Berlin.
- Using a Strict policy might deter some guests, as only 5.6% of listings use it. Evaluate if potential revenue protection outweighs possible lower booking rates.
- Regularly review your cancellation policy against competitors and market demand shifts in Neuenhagen bei Berlin.
What Do the Top Airbnb Listings in Neuenhagen bei Berlin Look Like?
Benchmark your potential! Explore examples of top-performing Airbnb properties in Neuenhagen bei Berlinbased on Trailing Twelve Month (TTM) revenue. Analyze their characteristics, revenue, occupancy rate, and ADR to understand what drives success in this market.

Villa with Pool, A/C, Sauna...
Entire Place • 7 bedrooms

Romantic 3-bedroom villa with large garden
Entire Place • 3 bedrooms

Comfy & Cozy Apartment
Entire Place • 1 bedroom
Modern living on the outskirts of Berlin
Entire Place • 3 bedrooms
Vacation home in the countryside near Berlin
Entire Place • 1 bedroom

Vacation home, apartment, guesthouse, apartment
Entire Place • 1 bedroom
Note: Performance varies based on location, size, amenities, seasonality, and management quality. Data reflects the past 12 months.
Who Are the Top Airbnb Hosts in Neuenhagen bei Berlin?
Learn from the best! This table showcases top-performing Airbnb hosts in Neuenhagen bei Berlin based on the number of properties managed and estimated total revenue over the past year. Analyze their scale and performance metrics.
| Host Name | Properties | Grossing Revenue | Stay Reviews | Avg Rating |
|---|---|---|---|---|
| Marcus | 1 | $50,084 | 35 | 4.77/5.0 |
| Johannes | 1 | $48,459 | 64 | 4.89/5.0 |
| Katja | 1 | $25,860 | 75 | 4.95/5.0 |
| Lisa | 1 | $25,068 | 14 | 5.00/5.0 |
| Doreen | 1 | $24,079 | 58 | 4.91/5.0 |
| Anja Und Dennis | 1 | $15,693 | 69 | 4.93/5.0 |
| Dennis | 1 | $14,211 | 103 | 4.95/5.0 |
| Klaus | 1 | $12,957 | 54 | 4.85/5.0 |
| Christian | 2 | $10,014 | 49 | 4.82/5.0 |
| Renate | 1 | $8,520 | 105 | 4.70/5.0 |
Analyzing the strategies of top hosts, such as their property selection, pricing, and guest communication, can offer valuable lessons for optimizing your own Airbnb operations in Neuenhagen bei Berlin.
How Does Neuenhagen bei Berlin's Airbnb Market Compare to Nearby Cities?
How does the Neuenhagen bei Berlin Airbnb market stack up against its neighbors? Compare key performance metrics like average monthly revenue, ADR, and occupancy rates in surrounding areas to understand the broader regional STR landscape.
Compared with Groß Nemerow, Neuenhagen bei Berlin has 23 percentage points lower occupancy and about $12 higher ADR. That helps frame whether this market is winning more on demand, pricing, or both.
| Market | Active Properties | Monthly Revenue | Daily Rate | Avg. Occupancy |
|---|---|---|---|---|
| Löbnitz | 10 | $3,419 | $200.10 | 52% |
| Kremmen | 10 | $3,352 | $332.66 | 30% |
| Gallin-Kuppentin | 14 | $3,027 | $358.80 | 30% |
| Luckow | 17 | $2,932 | $267.59 | 42% |
| Groß Nemerow | 12 | $2,563 | $126.48 | 64% |
| Heiligengrabe | 12 | $2,495 | $230.13 | 42% |
| Zastań | 28 | $2,197 | $263.72 | 34% |
| Berlin | 6,415 | $2,131 | $168.16 | 50% |
| Pouch | 12 | $2,033 | $194.56 | 39% |
| Wendisch Rietz | 24 | $2,009 | $198.91 | 43% |
Frequently Asked Questions About Airbnb in Neuenhagen bei Berlin
These quick answers summarize the most common investor and operator questions using AirROI's latest market data for Neuenhagen bei Berlin.
How much do Airbnb hosts make in Neuenhagen bei Berlin?
Neuenhagen bei Berlin hosts earn about $14,298 per year on average, with an average nightly rate of $139 and RevPAR of N/A. Those figures describe the typical revenue environment for active listings in Neuenhagen bei Berlin, Brandenburg, not the ceiling for the best operators. Source: AirROI 2026 data, Neuenhagen bei Berlin market, January 2025 to December 2025.
What is the average Airbnb occupancy rate in Neuenhagen bei Berlin?
The average Airbnb occupancy rate in Neuenhagen bei Berlin is 41.2%. June is the strongest month and March is the softest, so hosts should expect demand to move meaningfully throughout the year rather than stay flat.
What is the average Airbnb daily rate in Neuenhagen bei Berlin?
Listings in Neuenhagen bei Berlin average $139 per night. The broader pricing spread also matters: lower-performing listings cluster closer to the lower quartiles, while premium homes can price materially above the city average when demand spikes or listing quality stands out.
How many Airbnb listings are active in Neuenhagen bei Berlin?
Neuenhagen bei Berlin currently has about 18 active Airbnb listings in AirROI's market dataset. That supply count helps explain how competitive the market is, how much depth there is for benchmarking, and whether the market behaves like a niche destination or a scaled urban market.
How strict are short-term rental regulations in Neuenhagen bei Berlin?
AirROI currently classifies the short-term rental regulation level in Neuenhagen bei Berlin as Low. The dataset also shows about 0.0% of listings with registration evidence. That is a market signal, not legal advice, so hosts should still confirm current licensing and compliance rules locally before listing.
What is the RevPAR for Airbnb in Neuenhagen bei Berlin?
RevPAR in Neuenhagen bei Berlin is about N/A. That metric combines pricing and occupancy into one efficiency number, so it is often a better quick benchmark than ADR alone when investors want to compare how well listings convert nightly rates into realized revenue.
Is Airbnb profitable in Neuenhagen bei Berlin?
At 41.2% occupancy, Neuenhagen bei Berlin can be profitable — but margins depend heavily on operating costs, property acquisition price, and how well hosts optimize pricing across seasons. Average annual revenue is $14,298, but individual returns depend on property type, location within the city, and the host's operating efficiency.
How far in advance do guests book Airbnb in Neuenhagen bei Berlin?
The average booking lead time in Neuenhagen bei Berlin is about 45 days — a moderate lead time that gives hosts planning visibility while still benefiting from last-minute bookings. Hosts who understand their market's booking cadence can adjust minimum stays and pricing windows accordingly.
What are the best neighborhoods for Airbnb in Neuenhagen bei Berlin?
Based on AirROI's analysis, some of the top neighborhoods for short-term rentals in Neuenhagen bei Berlin include Neuenhagen Center, Lichtenberg District, Rüdersdorf. Each area attracts different guest profiles — from business travelers to leisure visitors — so the best location depends on the property type and target audience a host is aiming for. See the full neighborhood breakdown above.
What type of property performs best on Airbnb in Neuenhagen bei Berlin?
entire_home listings make up 94.4% of the active supply in Neuenhagen bei Berlin. The most common configuration does not always mean the most profitable — operators who identify underserved property types or bedroom counts can sometimes outperform the market average by filling a gap in local supply.
How does Neuenhagen bei Berlin compare to nearby Airbnb markets?
Among neighboring markets, Löbnitz posts $41,023 in average annual revenue with 51.6% occupancy, compared to Neuenhagen bei Berlin's $14,298 and 41.2%. Comparing nearby markets helps investors understand whether a destination's performance reflects local demand or broader regional trends.
When is the peak season for Airbnb in Neuenhagen bei Berlin?
June is the highest-revenue month in Neuenhagen bei Berlin, while March is the softest. The revenue spread between them indicates moderate seasonality with a clear peak period, giving hosts opportunities to maximize rates during high demand without facing dramatic off-season drops.
About AirROI Market Data
AirROI tracks over 20 million properties across 190+ countries and maintains 15+ years of historical performance data, making it one of the deepest Airbnb and STR intelligence platforms available. The analytics pipeline aggregates listing-level data monthly — revenue, occupancy, nightly rates, RevPAR, guest demographics, booking patterns, and competitive supply — so investors and operators can benchmark any market against its own history and against neighboring destinations.
Real estate investors, property managers, financial institutions, hedge funds, tourism boards, hospitality consultants, tech platforms, and academic researchers rely on AirROI data to underwrite acquisitions, optimize pricing, model macro trends, and conduct peer-reviewed research. Data is available through in-depth market reports like this one and the Airbnb API with 22 endpoints and an Airbnb MCP Server for AI agents.
AirROI proprietary analytics as of 2025-12-31. Metrics reflect trailing twelve-month aggregates from active listings. Revenue figures are market averages, not projections. Neighborhood descriptions are AI-generated and reviewed for accuracy. For full methodology, see the data methodology page.