Hamburg, HH Airbnb Market Data 2025: STR Report & Statistics
How much can you earn on Airbnb in Hamburg, HH? Based on AirROI's 2025 dataset (June 2024 – May 2025), the short answer is $18,937 per year — at a $135 nightly rate, 52.9% occupancy, and a N/A RevPAR.
At 66 active listings, Hamburg is a boutique market where solid booking activity throughout the year. Active supply contracted 7.0% year over year, yet revenue and nightly rates both rose — fewer listings are capturing more of the market. Remaining and incoming hosts benefit from reduced competition and stronger pricing.
Regulation is high and 77% of listings show active registration — compliance is the cost of entry. In a market this size, differentiated listings with strong reviews can capture outsized returns relative to the competition.

Table of Contents [hide] [show]
What Are the Key Airbnb Metrics in Hamburg?
In Hamburg, the headline Airbnb metrics are $18,937 in average annual revenue,52.9% occupancy, $135 ADR, and $0 in RevPAR, and guests book about 66 days in advance.
How Much Do Airbnb Hosts Earn Monthly in Hamburg?
Understanding the monthly revenue variations for Airbnb listings in Hamburg is key to maximizing your short term rental income potential. Seasonality significantly impacts earnings. Our analysis, based on data from the past 12 months, shows that the peak revenue month for STRs in Hamburg is typically August, while January often presents the lowest earnings, highlighting opportunities for strategic pricing adjustments during shoulder and low seasons. Explore the typical Airbnb income in Hamburg across different performance tiers:
- Best-in-class properties (Top 10%) achieve $3,698+ monthly, often utilizing dynamic pricing and superior guest experiences.
- Strong performing properties (Top 25%) earn $2,621 or more, indicating effective management and desirable locations/amenities.
- Typical properties (Median) generate around $1,628 per month, representing the average market performance.
- Entry-level properties (Bottom 25%) see earnings around $975, often with potential for optimization.
Average Monthly Airbnb Earnings Trend in Hamburg
What Is the Monthly Airbnb Occupancy Rate in Hamburg?
Maximize your bookings by understanding the Hamburg STR occupancy trends. Seasonal demand shifts significantly influence how often properties are booked. Typically, Septembersees the highest demand (peak season occupancy), while January experiences the lowest (low season). Effective strategies, like adjusting minimum stays or offering promotions, can boost occupancy during slower periods. Here's how different property tiers perform in Hamburg:
- Best-in-class properties (Top 10%) achieve 90%+ occupancy, indicating high desirability and potentially optimized availability.
- Strong performing properties (Top 25%) maintain 78% or higher occupancy, suggesting good market fit and guest satisfaction.
- Typical properties (Median) have an occupancy rate around 55%.
- Entry-level properties (Bottom 25%) average 30% occupancy, potentially facing higher vacancy.
Average Monthly Occupancy Rate Trend in Hamburg
What Is the Average Airbnb Nightly Rate in Hamburg?
Effective short term rental pricing strategy in Hamburg involves understanding monthly ADR fluctuations. The Average Daily Rate (ADR) for Airbnb in Hamburg typically peaks in May and dips lowest during June. Leveraging Airbnb dynamic pricing tools or strategies based on this seasonality can significantly boost revenue. Here's a look at the typical nightly rates achieved:
- Best-in-class properties (Top 10%) command rates of $179+ per night, often due to premium features or locations.
- Strong performing properties (Top 25%) achieve nightly rates of $134 or more.
- Typical properties (Median) charge around $95 per night.
- Entry-level properties (Bottom 25%) earn around $69 per night.
Average Daily Rate (ADR) Trend by Month in Hamburg
What Is the RevPAR for Airbnb in Hamburg?
RevPAR in Hamburg is currently N/A. Because RevPAR combines nightly rates with realized occupancy, it is one of the cleanest ways to compare how efficiently listings turn demand into revenue across the market.
- Entry-level properties (Bottom 25%) see N/A RevPAR.
- Typical properties (Median) generate N/A RevPAR.
- Strong performers (Top 25%) earn N/A RevPAR.
- Best-in-class (Top 10%) achieve N/A RevPAR.
Average Monthly RevPAR Trend in Hamburg
RevPAR Insights for Hamburg
- RevPAR peaks in Jan and bottoms out in Jan, mirroring the broader seasonal demand pattern and suggesting opportunities for dynamic pricing.
Recommendations for Hosts
- Track your own RevPAR monthly against these Hamburg benchmarks. If your RevPAR falls below the median of N/A, examine whether low occupancy or low ADR is the primary drag.
- Use RevPAR rather than revenue alone when comparing properties of different sizes — it normalizes for available nights and gives a more accurate picture of performance.
Get Live Hamburg Market Intelligence 👇
Explore Real-time Analytics
When Is the Peak Season for Airbnb in Hamburg?
Hamburg's peak Airbnb season falls in August, September, July, while the softest stretch is January, February, November. Overall, the market shows moderate seasonality with distinct peak and low periods, which should guide pricing, minimum stays, and cash-flow planning.
Peak Season (August, September, July)
- Revenue averages $2,355 per month
- Occupancy rates average 66.1%
- Daily rates average $105
Shoulder Season
- Revenue averages $2,053 per month
- Occupancy maintains around 54.4%
- Daily rates hold near $123
Low Season (January, February, November)
- Revenue drops to average $1,534 per month
- Occupancy decreases to average 40.8%
- Daily rates adjust to average $126
Seasonality Insights for Hamburg
- The Airbnb seasonality pattern in Hamburg shows moderate seasonality with distinct peak and low periods. While the sections above show seasonal averages, it is also insightful to look at the extremes:
- During the high season, the absolute peak month showcases Hamburg's highest earning potential, with monthly revenues climbing to $2,396, occupancy reaching 67.6%, and ADRs peaking at $146.
- Conversely, the slowest single month marks the market's lowest point — revenue may dip to $1,318, occupancy could drop to 32.7%, and ADRs may adjust to $104.
- Understanding both the seasonal averages and these monthly peaks and troughs in revenue, occupancy, and ADR is crucial for maximizing your Airbnb profit potential in Hamburg.
Seasonal Strategies for Maximizing Profit
- Peak Season: Maximize revenue through premium pricing. In a high-regulation market like Hamburg, ensure your permit covers the number of nights you plan to book — some jurisdictions cap annual rental days.
- Low Season: Offer competitive pricing, extended-stay discounts, and flexible cancellation policies. Target off-season travelers like remote workers, budget-conscious guests, and travelers with flexible schedules.
- Shoulder Seasons: Implement dynamic pricing that bridges peak and low rates. Target weekend travelers, local events, and business visitors. Slightly more flexible terms than peak season can help maintain occupancy without deep discounting.
- Regularly analyze your own performance against these Hamburg seasonality benchmarks and adjust your pricing and availability strategy accordingly.
Do You Need a License for Airbnb in Hamburg?
Yes, Hamburg, HH, Germany enforces high STR regulations and 77% of active listings show registration evidence — indicating that enforcement is active and compliance is a prerequisite for operating legally. Hosts entering this market should budget for permit fees, inspections, and potential occupancy tax obligations as part of their startup costs. Always verify the latest short-term rental regulations and Airbnb license requirements directly with local government authorities for Hamburg to ensure full compliance before hosting.
(Source: AirROI data, 2026, based on 77% licensed listings)
What Are the Best Neighborhoods for Airbnb in Hamburg?
Hamburg is a smaller vacation rental market where a handful of neighborhoods drive most of the booking activity. Choosing the right area is especially important in boutique markets — there is less room for a mediocre location to succeed on volume alone. The areas below highlight where short-term rental demand is strongest and why.
| Neighborhood / Area | Why Host Here? (Target Guests & Appeal) | Key Attractions & Landmarks |
|---|---|---|
| Altstadt | The historic heart of Hamburg, known for its beautiful architecture and cultural landmarks. A prime area for tourists due to its proximity to the main attractions and vibrant atmosphere. | Hamburg Rathaus, St. Nicolai Memorial, Speicherstadt, Elbphilharmonie, Miniatur Wunderland, Berliner Tor |
| St. Pauli | Famous for its nightlife and entertainment, St. Pauli is a popular district among locals and tourists alike. It offers a unique experience with the Reeperbahn and various bars and clubs. | Reeperbahn, St. Pauli Piers, Fischmarkt, Millerntor-Stadion, Tanzende Türme, Schmidt Theater |
| Altona | A trendy area with a mix of old and new architecture. Altona is known for its scenic waterfront and diverse dining options, attracting both tourists and locals. | Altona Balkon, HafenCity, Fischmarkt Altona, Elbstrand, Altona Museum, Planten un Blomen |
| Eimsbüttel | A charming neighborhood that blends residential living with trendy cafes and boutique shops. Eimsbüttel attracts young professionals and families seeking a vibrant community atmosphere. | Leistungspark, Eppendorfer Park, Schmidt Theater, Café Paris, Hochschule für Musik und Theater |
| Winterhude | Known for its lakes and parks, Winterhude is a family-friendly neighborhood that appeals to those looking for a quieter stay while still being close to the city center. | Aussenalster, Planetarium Hamburg, Humboldtplatz, Goldbekplatz, Humboldtstraße, Parks and gardens |
| Sternschanze | An up-and-coming area known for its hip cafes and vibrant street life. It appeals to younger travelers and those looking for a unique urban experience. | Schanzenviertel, Falkensteiner Strand, Eimsbüttel Markets, Rote Flora, Café SternChance |
| HafenCity | One of the largest urban development projects in Europe, HafenCity is modern and attracts business travelers, as well as tourists looking for waterfront views and contemporary living. | Elbphilharmonie, HafenCity Universität, Magellan-Terrassen, Sculpture Network, HafenCity Park |
| Barmbek | A diverse and lively district known for its local markets and family-friendly atmosphere. Barmbek offers a different take on Hamburg living and is gaining popularity among visitors. | Kulturhaus Barmbek, Barmbek Market, Tegelsbarg Park, Hamburger Meile, Local dining spots |
Because Hamburg has a high regulation profile, confirming that short-term rental permits are available in your target neighborhood is a critical first step before committing to a property purchase. Regulation can vary at the neighborhood or district level even within the same city.
What Types of Properties Are on Airbnb in Hamburg?
Room Type Distribution
Property Type Distribution
Market Composition Insights for Hamburg
- The Hamburg Airbnb market composition is heavily skewed towards Entire Home/Apt listings, which make up 69.7% of the 66 active rentals. This indicates strong guest preference for privacy and space.
- However, a notable 28.8% share for Private Rooms suggests opportunities for budget-conscious travelers or hosts renting out spare rooms.
- Looking at the property type distribution in Hamburg, Apartment/Condo properties are the most common (78.8%), reflecting the local real estate landscape.
- The presence of 9.1% Hotel/Boutique listings indicates integration with traditional hospitality.
- Smaller segments like others (combined 3.0%) offer potential for unique stay experiences.
Hamburg Airbnb Room Capacity Analysis (2026): Bedroom Distribution
Distribution of Listings by Number of Bedrooms
Room Capacity Insights for Hamburg
- The dominant room capacity in Hamburg is 1 bedroom listings, making up 60.6% of the market. This suggests a strong demand for properties suitable for couples or solo travelers.
- Together, 1 bedroom and 2 bedrooms properties represent 72.7% of the active Airbnb listings in Hamburg, indicating a high concentration in these sizes.
- With over half the market (60.6%) consisting of studios or 1-bedroom units, Hamburg is particularly well-suited for individuals or couples.
- Listings with 3+ bedrooms (6.0%) represent a smaller niche, potentially indicating an underserved market for larger group accommodations in Hamburg.
Hamburg Vacation Rental Guest Capacity Trends (2026)
Distribution of Listings by Guest Capacity
Guest Capacity Insights for Hamburg
- The most common guest capacity trend in Hamburg vacation rentals is listings accommodating 2 guests (40.9%). This suggests the primary traveler segment is likely couples or solo travelers.
- Properties designed for 2 guests and 4 guests dominate the Hamburg STR market, accounting for 56.1% of listings.
- A significant 45.4% of listings cater specifically to 1-2 guests, highlighting strong demand from couples and solo travelers in Hamburg.
- On average, properties in Hamburg are equipped to host 2.4 guests.
What Amenities Do Airbnb Guests Expect in Hamburg?
Amenity Prevalence
Amenity Insights for Hamburg
- Essential amenities in Hamburg that guests expect include: Wifi, Smoke alarm. Lacking these (any) could significantly impact bookings.
- Popular amenities like Heating, Refrigerator, Essentials are common but not universal. Offering these can provide a competitive edge.
Recommendations for Hosts
- Ensure your listing includes all essential amenities for Hamburg: Wifi, Smoke alarm.
- Prioritize adding missing essentials: Wifi, Smoke alarm.
- Consider adding popular differentiators like Heating or Refrigerator to increase appeal.
- Highlight unique or less common amenities you offer (e.g., hot tub, dedicated workspace, EV charger) in your listing description and photos.
- Regularly check competitor amenities in Hamburg to stay competitive.
Dive Deeper: Advanced Hamburg STR Market Data (2026)
Ready to unlock more insights? AirROI provides access to advanced metrics and comprehensive Airbnb data for Hamburg. Explore detailed analytics beyond this report to refine your investment strategy, optimize pricing, and maximize your vacation rental profits.
Explore Advanced MetricsHamburg Airbnb Guest Demographics & Profile Analysis (2026)
Guest Profile Summary for Hamburg
- The typical guest profile for Airbnb in Hamburg consists of a mix of domestic (57%) and international guests, often arriving from nearby Berlin, typically belonging to the Post-2000s (Gen Z/Alpha) group (50%), primarily speaking English or German.
- Domestic travelers account for 56.9% of guests.
- Key international markets include Germany (56.9%) and United Kingdom (4.9%).
- Top languages spoken are English (40.3%) followed by German (29.3%).
- A significant demographic segment is the Post-2000s (Gen Z/Alpha) group, representing 50% of guests.
Recommendations for Hosts
- Balance marketing efforts between domestic and international channels based on the guest mix.
- Tailor amenities and listing descriptions to appeal to the dominant Post-2000s (Gen Z/Alpha) demographic (e.g., highlight fast WiFi, smart home features, local guides).
- Highlight unique local experiences or amenities relevant to the primary guest profile.
- Consider seasonal promotions aligned with peak travel times for key origin markets.
Hamburg Airbnb Booking Patterns (2026): Available vs. Booked Days
Available Days Distribution
Booked Days Distribution
Booking Pattern Insights for Hamburg
- The most common availability pattern in Hamburg falls within the 181-270 days range, representing 37.9% of listings. This suggests many properties have significant open periods on their calendars.
- Approximately 63.7% of listings show high availability (181+ days open annually), indicating potential for increased bookings or specific owner usage patterns.
- For booked days, the 91-180 days range is most frequent in Hamburg (39.4%), reflecting common guest stay durations or potential owner blocking patterns.
- A notable 36.4% of properties secure long booking periods (181+ days booked per year), highlighting successful long-term rental strategies or significant owner usage.
How Far in Advance Do Guests Book Airbnb in Hamburg?
Average Booking Lead Time by Month
Booking Lead Time Insights for Hamburg
- The overall average booking lead time for vacation rentals in Hamburg is 66 days.
- Guests book furthest in advance for stays during July (average 93 days), likely coinciding with peak travel demand or local events.
- The shortest booking windows occur for stays in January (average 38 days), indicating more last-minute travel plans during this time.
- Seasonally, Summer (87 days avg.) sees the longest lead times, while Winter (50 days avg.) has the shortest, reflecting typical travel planning cycles.
Recommendations for Hosts
- Use the overall average lead time (66 days) as a baseline for your pricing and availability strategy in Hamburg.
- For July stays, consider implementing length-of-stay discounts or slightly higher rates for bookings made less than 93 days out to capitalize on advance planning.
- Target marketing efforts for the Summer season well in advance (at least 87 days) to capture early planners.
- Monitor your own booking lead times against these Hamburg averages to identify opportunities for dynamic pricing adjustments.
Hamburg Airbnb Minimum Stay Requirements Analysis
Distribution of Listings by Minimum Night Requirement
1 Night
20 listings
30.3% of total
2 Nights
22 listings
33.3% of total
3 Nights
4 listings
6.1% of total
4-6 Nights
4 listings
6.1% of total
7-29 Nights
3 listings
4.5% of total
30+ Nights
13 listings
19.7% of total
Key Insights
- The most prevalent minimum stay requirement in Hamburg is 2 Nights, adopted by 33.3% of listings. This highlights the market's preference for shorter, flexible bookings.
- A strong majority (63.6%) of the Hamburg Airbnb data shows acceptance of very short stays (1-2 nights), indicating a dynamic, high-turnover market.
- A significant segment (19.7%) caters to monthly stays (30+ nights) in Hamburg, pointing to opportunities in the extended-stay market.
Recommendations
- Align with the market by considering a 2 Nights minimum stay, as 33.3% of Hamburg hosts use this setting.
- Explore offering discounts for stays of 30+ nights to attract the 19.7% of the market seeking extended stays.
- Adjust minimum nights based on seasonality – potentially shorter during low season and longer during peak demand periods in Hamburg.
Hamburg Airbnb Cancellation Policy Trends Analysis (2026)
Flexible
4 listings
6.1% of total
Moderate
28 listings
42.4% of total
Firm
9 listings
13.6% of total
Strict
25 listings
37.9% of total
Cancellation Policy Insights for Hamburg
- The prevailing Airbnb cancellation policy trend in Hamburg is Moderate, used by 42.4% of listings.
- A majority (51.5%) of hosts in Hamburg utilize Firm or Strict policies, indicating a market where hosts prioritize booking security.
Recommendations for Hosts
- Consider adopting a Moderate policy to align with the 42.4% market standard in Hamburg.
- With 37.9% using Strict terms, this is a viable option in Hamburg, particularly for high-value properties or during peak demand periods.
- Regularly review your cancellation policy against competitors and market demand shifts in Hamburg.
What Do the Top Airbnb Listings in Hamburg Look Like?
Benchmark your potential! Explore examples of top-performing Airbnb properties in Hamburgbased on Trailing Twelve Month (TTM) revenue. Analyze their characteristics, revenue, occupancy rate, and ADR to understand what drives success in this market.
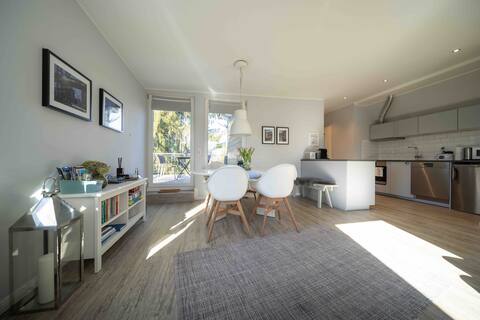
Sunny loft in youth style villa
Entire Place • 2 bedrooms

Apartment in the heart of St. Pauli
Entire Place • 1 bedroom
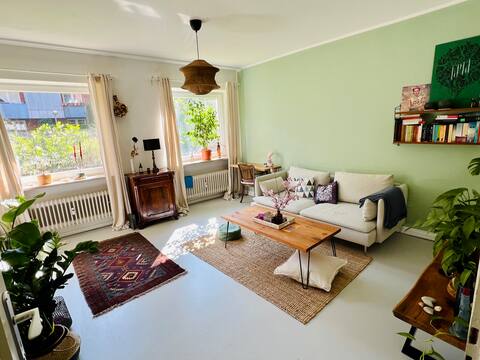
Cozy and central apartment close to the Alster
Entire Place • 1 bedroom

Cozy apartment in the Schanzenviertel
Entire Place • 1 bedroom
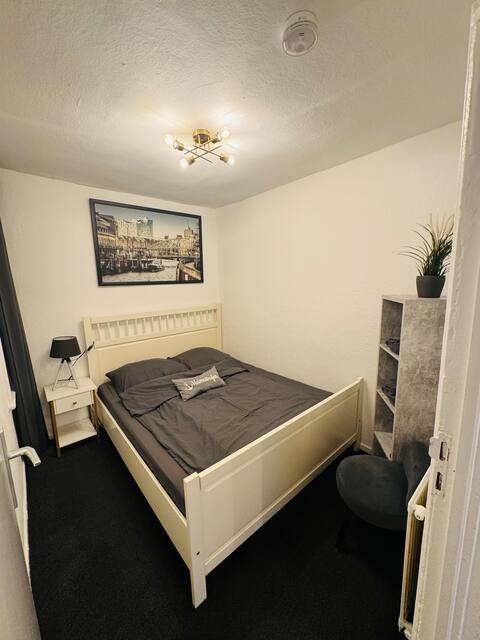
Small pearl 2 in the middle of St. Pauli
Entire Place • 1 bedroom

Alster Waterfront Apartments Family
Entire Place • 5 bedrooms
Note: Performance varies based on location, size, amenities, seasonality, and management quality. Data reflects the past 12 months.
Who Are the Top Airbnb Hosts in Hamburg?
Learn from the best! This table showcases top-performing Airbnb hosts in Hamburg based on the number of properties managed and estimated total revenue over the past year. Analyze their scale and performance metrics.
| Host Name | Properties | Grossing Revenue | Stay Reviews | Avg Rating |
|---|---|---|---|---|
| Ricarda | 3 | $112,682 | 1117 | 4.77/5.0 |
| Room-Pauli | 6 | $92,298 | 404 | 4.45/5.0 |
| Sabine | 1 | $55,980 | 215 | 5.00/5.0 |
| Frank | 4 | $51,613 | 575 | 4.91/5.0 |
| Andrea | 1 | $41,223 | 26 | 4.88/5.0 |
| Carina | 1 | $36,615 | 445 | 4.93/5.0 |
| Patricia | 1 | $32,613 | 93 | 4.92/5.0 |
| Kim-Thaya | 1 | $31,740 | 41 | 4.98/5.0 |
| Isabell | 1 | $30,440 | 16 | 4.94/5.0 |
| Moritz Jost | 1 | $113,497 | 125 | 4.62/5.0 |
Analyzing the strategies of top hosts, such as their property selection, pricing, and guest communication, can offer valuable lessons for optimizing your own Airbnb operations in Hamburg.
How Does Hamburg's Airbnb Market Compare to Nearby Cities?
How does the Hamburg Airbnb market stack up against its neighbors? Compare key performance metrics like average monthly revenue, ADR, and occupancy rates in surrounding areas to understand the broader regional STR landscape.
Compared with Hamburg, Hamburg has 3 percentage points higher occupancy and about $13 lower ADR. That helps frame whether this market is winning more on demand, pricing, or both.
| Market | Active Properties | Monthly Revenue | Daily Rate | Avg. Occupancy |
|---|---|---|---|---|
| Stapel | 10 | $2,144 | $290.14 | 40% |
| Ærøskøbing | 32 | $1,908 | $170.47 | 49% |
| Tetenbüll | 29 | $1,766 | $235.43 | 31% |
| Hamburg | 2,528 | $1,649 | $148.15 | 50% |
| Højer | 33 | $1,631 | $214.18 | 37% |
| Schülp | 16 | $1,627 | $159.37 | 47% |
| Egernsund | 29 | $1,621 | $283.91 | 38% |
| Osterhever | 18 | $1,564 | $243.04 | 33% |
| Kampen (Sylt) | 24 | $1,542 | $444.94 | 24% |
| Stelle | 21 | $1,530 | $141.21 | 50% |
Frequently Asked Questions About Airbnb in Hamburg
These quick answers summarize the most common investor and operator questions using AirROI's latest market data for Hamburg.
How much do Airbnb hosts make in Hamburg?
Hamburg hosts earn about $18,937 per year on average, with an average nightly rate of $135 and RevPAR of N/A. Those figures describe the typical revenue environment for active listings in Hamburg, HH, not the ceiling for the best operators. Source: AirROI 2025 data, Hamburg market, June 2024 to May 2025.
What is the average Airbnb occupancy rate in Hamburg?
The average Airbnb occupancy rate in Hamburg is 52.9%. August is the strongest month and January is the softest, so hosts should expect demand to move meaningfully throughout the year rather than stay flat.
What is the average Airbnb daily rate in Hamburg?
Listings in Hamburg average $135 per night. The broader pricing spread also matters: lower-performing listings cluster closer to the lower quartiles, while premium homes can price materially above the city average when demand spikes or listing quality stands out.
How many Airbnb listings are active in Hamburg?
Hamburg currently has about 66 active Airbnb listings in AirROI's market dataset. That supply count helps explain how competitive the market is, how much depth there is for benchmarking, and whether the market behaves like a niche destination or a scaled urban market.
How strict are short-term rental regulations in Hamburg?
AirROI currently classifies the short-term rental regulation level in Hamburg as High. The dataset also shows about 77.3% of listings with registration evidence. That is a market signal, not legal advice, so hosts should still confirm current licensing and compliance rules locally before listing.
What is the RevPAR for Airbnb in Hamburg?
RevPAR in Hamburg is about N/A. That metric combines pricing and occupancy into one efficiency number, so it is often a better quick benchmark than ADR alone when investors want to compare how well listings convert nightly rates into realized revenue.
Is Airbnb profitable in Hamburg?
At 52.9% occupancy, Hamburg can be profitable — but margins depend heavily on operating costs, property acquisition price, and how well hosts optimize pricing across seasons. Average annual revenue is $18,937, but individual returns depend on property type, location within the city, and the host's operating efficiency.
How far in advance do guests book Airbnb in Hamburg?
The average booking lead time in Hamburg is about 66 days — a longer planning horizon typical of destination or vacation markets where travelers book well in advance. Hosts who understand their market's booking cadence can adjust minimum stays and pricing windows accordingly.
What are the best neighborhoods for Airbnb in Hamburg?
Based on AirROI's analysis, some of the top neighborhoods for short-term rentals in Hamburg include Altstadt, St. Pauli, Altona. Each area attracts different guest profiles — from business travelers to leisure visitors — so the best location depends on the property type and target audience a host is aiming for. See the full neighborhood breakdown above.
What type of property performs best on Airbnb in Hamburg?
entire_home listings make up 69.7% of the active supply in Hamburg. The most common configuration does not always mean the most profitable — operators who identify underserved property types or bedroom counts can sometimes outperform the market average by filling a gap in local supply.
How does Hamburg compare to nearby Airbnb markets?
Among neighboring markets, Stapel posts $25,731 in average annual revenue with 40.1% occupancy, compared to Hamburg's $18,937 and 52.9%. Comparing nearby markets helps investors understand whether a destination's performance reflects local demand or broader regional trends.
When is the peak season for Airbnb in Hamburg?
August is the highest-revenue month in Hamburg, while January is the softest. The revenue spread between them indicates moderate seasonality with a clear peak period, giving hosts opportunities to maximize rates during high demand without facing dramatic off-season drops.
About AirROI Market Data
AirROI tracks over 20 million properties across 190+ countries and maintains 15+ years of historical performance data, making it one of the deepest Airbnb and STR intelligence platforms available. The analytics pipeline aggregates listing-level data monthly — revenue, occupancy, nightly rates, RevPAR, guest demographics, booking patterns, and competitive supply — so investors and operators can benchmark any market against its own history and against neighboring destinations.
Real estate investors, property managers, financial institutions, hedge funds, tourism boards, hospitality consultants, tech platforms, and academic researchers rely on AirROI data to underwrite acquisitions, optimize pricing, model macro trends, and conduct peer-reviewed research. Data is available through in-depth market reports like this one and the Airbnb API with 22 endpoints and an Airbnb MCP Server for AI agents.
AirROI proprietary analytics as of 2025-05-31. Metrics reflect trailing twelve-month aggregates from active listings. Revenue figures are market averages, not projections. Neighborhood descriptions are AI-generated and reviewed for accuracy. For full methodology, see the data methodology page.