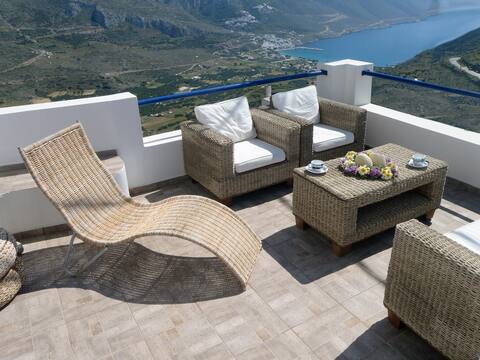
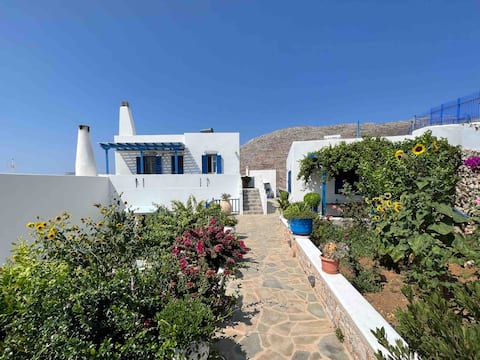
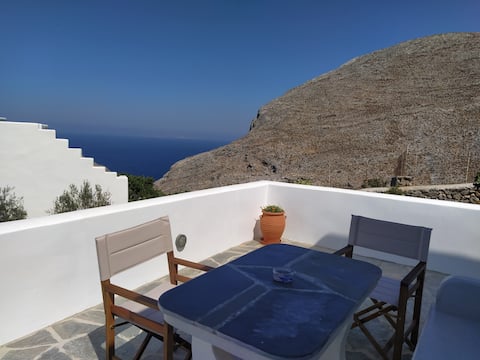
Tholaria, Aegean Airbnb Market Data 2026: STR Report & Statistics
How much can you earn on Airbnb in Tholaria, Aegean? Based on AirROI's 2026 dataset (March 2025 – February 2026), the short answer is $6,219 per year — at a $142 nightly rate, 41.7% occupancy, and a N/A RevPAR.
With just 18 active listings, Tholaria is a micro-market where moderate demand with room for well-positioned listings to outperform. The market trimmed 14.3% of its supply while nightly rates moved higher — fewer listings competing for the same travelers, and those travelers are paying more. Hosts who can unlock occupancy through standout listings, flexible policies, and targeted marketing have clear revenue upside.
Regulation is high and 83% of listings show active registration — compliance is the cost of entry. In a market this size, differentiated listings with strong reviews can capture outsized returns relative to the competition.

Table of Contents [hide] [show]
What Are the Key Airbnb Metrics in Tholaria?
In Tholaria, the headline Airbnb metrics are $6,219 in average annual revenue,41.7% occupancy, $142 ADR, and $0 in RevPAR, and guests book about 66 days in advance.
How Much Do Airbnb Hosts Earn Monthly in Tholaria?
Understanding the monthly revenue variations for Airbnb listings in Tholaria is key to maximizing your short term rental income potential. Seasonality significantly impacts earnings. Our analysis, based on data from the past 12 months, shows that the peak revenue month for STRs in Tholaria is typically August, while April often presents the lowest earnings, highlighting opportunities for strategic pricing adjustments during shoulder and low seasons. Explore the typical Airbnb income in Tholaria across different performance tiers:
- Best-in-class properties (Top 10%) achieve $1,955+ monthly, often utilizing dynamic pricing and superior guest experiences.
- Strong performing properties (Top 25%) earn $1,637 or more, indicating effective management and desirable locations/amenities.
- Typical properties (Median) generate around $1,234 per month, representing the average market performance.
- Entry-level properties (Bottom 25%) see earnings around $976, often with potential for optimization.
Average Monthly Airbnb Earnings Trend in Tholaria
What Is the Monthly Airbnb Occupancy Rate in Tholaria?
Maximize your bookings by understanding the Tholaria STR occupancy trends. Seasonal demand shifts significantly influence how often properties are booked. Typically, Augustsees the highest demand (peak season occupancy), while October experiences the lowest (low season). Effective strategies, like adjusting minimum stays or offering promotions, can boost occupancy during slower periods. Here's how different property tiers perform in Tholaria:
- Best-in-class properties (Top 10%) achieve 51%+ occupancy, indicating high desirability and potentially optimized availability.
- Strong performing properties (Top 25%) maintain 45% or higher occupancy, suggesting good market fit and guest satisfaction.
- Typical properties (Median) have an occupancy rate around 31%.
- Entry-level properties (Bottom 25%) average 23% occupancy, potentially facing higher vacancy.
Average Monthly Occupancy Rate Trend in Tholaria
What Is the Average Airbnb Nightly Rate in Tholaria?
Effective short term rental pricing strategy in Tholaria involves understanding monthly ADR fluctuations. The Average Daily Rate (ADR) for Airbnb in Tholaria typically peaks in March and dips lowest during October. Leveraging Airbnb dynamic pricing tools or strategies based on this seasonality can significantly boost revenue. Here's a look at the typical nightly rates achieved:
- Best-in-class properties (Top 10%) command rates of $222+ per night, often due to premium features or locations.
- Strong performing properties (Top 25%) achieve nightly rates of $177 or more.
- Typical properties (Median) charge around $142 per night.
- Entry-level properties (Bottom 25%) earn around $92 per night.
Average Daily Rate (ADR) Trend by Month in Tholaria
What Is the RevPAR for Airbnb in Tholaria?
RevPAR in Tholaria is currently N/A. Because RevPAR combines nightly rates with realized occupancy, it is one of the cleanest ways to compare how efficiently listings turn demand into revenue across the market.
- Entry-level properties (Bottom 25%) see N/A RevPAR.
- Typical properties (Median) generate N/A RevPAR.
- Strong performers (Top 25%) earn N/A RevPAR.
- Best-in-class (Top 10%) achieve N/A RevPAR.
Average Monthly RevPAR Trend in Tholaria
RevPAR Insights for Tholaria
- RevPAR peaks in Jan and bottoms out in Jan, mirroring the broader seasonal demand pattern and suggesting opportunities for dynamic pricing.
Recommendations for Hosts
- Track your own RevPAR monthly against these Tholaria benchmarks. If your RevPAR falls below the median of N/A, examine whether low occupancy or low ADR is the primary drag.
- Use RevPAR rather than revenue alone when comparing properties of different sizes — it normalizes for available nights and gives a more accurate picture of performance.
Get Live Tholaria Market Intelligence 👇
Explore Real-time Analytics
When Is the Peak Season for Airbnb in Tholaria?
Tholaria's peak Airbnb season falls in August, July, June, while the softest stretch is January, March, April. Overall, the market shows highly seasonal trends requiring careful strategy, which should guide pricing, minimum stays, and cash-flow planning.
Peak Season (August, July, June)
- Revenue averages $2,276 per month
- Occupancy rates average 53.7%
- Daily rates average $149
Shoulder Season
- Revenue averages $1,063 per month
- Occupancy maintains around 28.6%
- Daily rates hold near $141
Low Season (January, March, April)
- Revenue drops to average $154 per month
- Occupancy decreases to average 6.7%
- Daily rates adjust to average $152
Seasonality Insights for Tholaria
- Airbnb seasonality in Tholaria is pronounced. Revenue swings sharply between peak and low months, which means pricing strategy, minimum-stay settings, and cash reserves all need to account for extended slower periods.
- During the high season, the absolute peak month showcases Tholaria's highest earning potential, with monthly revenues climbing to $3,248, occupancy reaching 71.7%, and ADRs peaking at $166.
- Conversely, the slowest single month marks the market's lowest point — revenue may dip to $0, occupancy could drop to 0.0%, and ADRs may adjust to $136.
- Understanding both the seasonal averages and these monthly peaks and troughs in revenue, occupancy, and ADR is crucial for maximizing your Airbnb profit potential in Tholaria.
Seasonal Strategies for Maximizing Profit
- Peak Season: Maximize revenue through premium pricing. In a high-regulation market like Tholaria, ensure your permit covers the number of nights you plan to book — some jurisdictions cap annual rental days.
- Low Season: Offer competitive pricing, extended-stay discounts, and flexible cancellation policies. Target off-season travelers like remote workers, budget-conscious guests, and travelers with flexible schedules.
- Shoulder Seasons: Implement dynamic pricing that bridges peak and low rates. Target weekend travelers, local events, and business visitors. Slightly more flexible terms than peak season can help maintain occupancy without deep discounting.
- In a highly seasonal market like Tholaria, building a cash reserve during the top months is essential for covering fixed costs during the slow period. Automated pricing tools can help capture demand shifts in real time.
Do You Need a License for Airbnb in Tholaria?
Yes, Tholaria, Aegean, Greece enforces high STR regulations and 83% of active listings show registration evidence — indicating that enforcement is active and compliance is a prerequisite for operating legally. Hosts entering this market should budget for permit fees, inspections, and potential occupancy tax obligations as part of their startup costs. Always verify the latest short-term rental regulations and Airbnb license requirements directly with local government authorities for Tholaria to ensure full compliance before hosting.
(Source: AirROI data, 2026, based on 83% licensed listings)
What Are the Best Neighborhoods for Airbnb in Tholaria?
With a compact short-term rental market, Tholaria gives early-mover hosts an advantage in the right neighborhoods. The areas listed below are where guest demand and local attractions converge — a useful lens for investors evaluating whether to enter this market and where to position their listing.
| Neighborhood / Area | Why Host Here? (Target Guests & Appeal) | Key Attractions & Landmarks |
|---|---|---|
| Main Square | The heart of Tholaria with stunning views, easy access to local restaurants, and cultural attractions. A perfect spot for tourists wanting to immerse themselves in the local lifestyle. | Tholaria Main Square, Local tavernas, Cultural festivals, Traditional architecture, Nearby hiking trails |
| Church of Agios Georgios | A historical landmark with beautiful architecture and stunning panoramic views of the surrounding area. Great for guests interested in cultural experiences. | Agios Georgios Church, Scenic viewpoints, Local art galleries, Historical landmarks, Photography spots |
| Nearby Beaches | Access to pristine beaches with crystal clear waters, ideal for sunbathing and water activities. A must for tourists looking for relaxation and adventure. | Aegiali Beach, Levrosos Beach, Beach bars, Water sports rental, Sunset views |
| Mountain Trails | An ideal spot for hiking enthusiasts, offering beautiful landscapes and nature experiences. Attracts eco-tourists and adventure seekers. | Hiking trails, Biking paths, Natural parks, Bird watching, Stunning vistas |
| Traditional Villages | Experience authentic Greek culture and hospitality in charming, traditional villages. Great for those looking to explore local life. | Local crafts shops, Culinary experiences, Traditional music, Folklore events, Village festivities |
| Cultural Festivals | Host to various cultural festivals throughout the year, attracting tourists looking for unique experiences and local traditions. | Local festivals, Food markets, Music events, Dance performances, Art exhibits |
| Scenic Lookouts | Areas offering breathtaking views of the Aegean Sea and surrounding islands, perfect for relaxation and sightseeing. | Sunset viewing spots, Photography locations, Quiet retreats, Nature walks, Picnic areas |
| Local Wineries | Discover the local wine culture through vineyard tours and tastings. A great experience for food and wine enthusiasts. | Wine tasting tours, Beautiful vineyard scenery, Culinary pairings, Local wine production, Cultural heritage |
Because Tholaria has a high regulation profile, confirming that short-term rental permits are available in your target neighborhood is a critical first step before committing to a property purchase. Regulation can vary at the neighborhood or district level even within the same city.
What Types of Properties Are on Airbnb in Tholaria?
Room Type Distribution
Property Type Distribution
Market Composition Insights for Tholaria
- The Tholaria Airbnb market composition is heavily skewed towards Entire Home/Apt listings, which make up 77.8% of the 18 active rentals. This indicates strong guest preference for privacy and space.
- Looking at the property type distribution in Tholaria, House properties are the most common (66.7%), reflecting the local real estate landscape.
- Houses represent a significant 66.7% portion, catering likely to families or larger groups.
- The presence of 5.6% Hotel/Boutique listings indicates integration with traditional hospitality.
Tholaria Airbnb Room Capacity Analysis (2026): Bedroom Distribution
Distribution of Listings by Number of Bedrooms
Room Capacity Insights for Tholaria
- The dominant room capacity in Tholaria is 1 bedroom listings, making up 55.6% of the market. This suggests a strong demand for properties suitable for couples or solo travelers.
- Together, 1 bedroom and 2 bedrooms properties represent 77.8% of the active Airbnb listings in Tholaria, indicating a high concentration in these sizes.
- With over half the market (55.6%) consisting of studios or 1-bedroom units, Tholaria is particularly well-suited for individuals or couples.
Tholaria Vacation Rental Guest Capacity Trends (2026)
Distribution of Listings by Guest Capacity
Guest Capacity Insights for Tholaria
- The most common guest capacity trend in Tholaria vacation rentals is listings accommodating 4 guests (38.9%). This suggests the primary traveler segment is likely small families or groups.
- Properties designed for 4 guests and 2 guests dominate the Tholaria STR market, accounting for 72.2% of listings.
- On average, properties in Tholaria are equipped to host 3.1 guests.
What Amenities Do Airbnb Guests Expect in Tholaria?
Amenity Prevalence
Amenity Insights for Tholaria
- Popular amenities like Hair dryer, Hangers, Essentials are common but not universal. Offering these can provide a competitive edge.
- Warning: Wifi is not universally provided but is considered essential globally. Ensure reliable Wifi is offered.
Recommendations for Hosts
- Consider adding popular differentiators like Hair dryer or Hangers to increase appeal.
- Highlight unique or less common amenities you offer (e.g., hot tub, dedicated workspace, EV charger) in your listing description and photos.
- Regularly check competitor amenities in Tholaria to stay competitive.
Dive Deeper: Advanced Tholaria STR Market Data (2026)
Ready to unlock more insights? AirROI provides access to advanced metrics and comprehensive Airbnb data for Tholaria. Explore detailed analytics beyond this report to refine your investment strategy, optimize pricing, and maximize your vacation rental profits.
Explore Advanced MetricsTholaria Airbnb Guest Demographics & Profile Analysis (2026)
Guest Profile Summary for Tholaria
- The typical guest profile for Airbnb in Tholaria consists of predominantly international visitors (87%), with top international origins including Greece, typically belonging to the Post-2000s (Gen Z/Alpha) group (50%), primarily speaking English or French.
- Domestic travelers account for 13.3% of guests.
- Key international markets include France (44.4%) and Greece (13.3%).
- Top languages spoken are English (36%) followed by French (26%).
- A significant demographic segment is the Post-2000s (Gen Z/Alpha) group, representing 50% of guests.
Recommendations for Hosts
- Focus marketing internationally, particularly towards travelers from Greece.
- Tailor amenities and listing descriptions to appeal to the dominant Post-2000s (Gen Z/Alpha) demographic (e.g., highlight fast WiFi, smart home features, local guides).
- Highlight unique local experiences or amenities relevant to the primary guest profile.
- Consider seasonal promotions aligned with peak travel times for key origin markets.
Tholaria Airbnb Booking Patterns (2026): Available vs. Booked Days
Available Days Distribution
Booked Days Distribution
Booking Pattern Insights for Tholaria
- The most common availability pattern in Tholaria falls within the 271-366 days range, representing 88.9% of listings. This suggests many properties have significant open periods on their calendars.
- Approximately 100.0% of listings show high availability (181+ days open annually), indicating potential for increased bookings or specific owner usage patterns.
- For booked days, the 31-90 days range is most frequent in Tholaria (50%), reflecting common guest stay durations or potential owner blocking patterns.
How Far in Advance Do Guests Book Airbnb in Tholaria?
Average Booking Lead Time by Month
Booking Lead Time Insights for Tholaria
- The overall average booking lead time for vacation rentals in Tholaria is 66 days.
- Guests book furthest in advance for stays during August (average 90 days), likely coinciding with peak travel demand or local events.
- The shortest booking windows occur for stays in March (average 0 days), indicating more last-minute travel plans during this time.
- Seasonally, Summer (68 days avg.) sees the longest lead times, while Winter (1 days avg.) has the shortest, reflecting typical travel planning cycles.
Recommendations for Hosts
- Use the overall average lead time (66 days) as a baseline for your pricing and availability strategy in Tholaria.
- For August stays, consider implementing length-of-stay discounts or slightly higher rates for bookings made less than 90 days out to capitalize on advance planning.
- During March, focus on last-minute booking availability and promotions, as guests book with very short notice (0 days avg.).
- Target marketing efforts for the Summer season well in advance (at least 68 days) to capture early planners.
- Monitor your own booking lead times against these Tholaria averages to identify opportunities for dynamic pricing adjustments.
Tholaria Airbnb Minimum Stay Requirements Analysis
Distribution of Listings by Minimum Night Requirement
1 Night
3 listings
16.7% of total
2 Nights
2 listings
11.1% of total
3 Nights
2 listings
11.1% of total
4-6 Nights
3 listings
16.7% of total
7-29 Nights
1 listings
5.6% of total
30+ Nights
7 listings
38.9% of total
Key Insights
- The most prevalent minimum stay requirement in Tholaria is 30+ Nights, adopted by 38.9% of listings. This highlights the market's preference for longer commitments.
- A significant segment (38.9%) caters to monthly stays (30+ nights) in Tholaria, pointing to opportunities in the extended-stay market.
Recommendations
- Align with the market by considering a 30+ Nights minimum stay, as 38.9% of Tholaria hosts use this setting.
- If feasible, allowing 1-night stays, especially midweek or during low season, could capture last-minute bookings, as only 16.7% currently do.
- Explore offering discounts for stays of 30+ nights to attract the 38.9% of the market seeking extended stays.
- Adjust minimum nights based on seasonality – potentially shorter during low season and longer during peak demand periods in Tholaria.
Tholaria Airbnb Cancellation Policy Trends Analysis (2026)
Flexible
3 listings
16.7% of total
Moderate
3 listings
16.7% of total
Firm
5 listings
27.8% of total
Strict
7 listings
38.9% of total
Cancellation Policy Insights for Tholaria
- The prevailing Airbnb cancellation policy trend in Tholaria is Strict, used by 38.9% of listings.
- A majority (66.7%) of hosts in Tholaria utilize Firm or Strict policies, indicating a market where hosts prioritize booking security.
Recommendations for Hosts
- Consider adopting a Strict policy to align with the 38.9% market standard in Tholaria.
- With 38.9% using Strict terms, this is a viable option in Tholaria, particularly for high-value properties or during peak demand periods.
- Regularly review your cancellation policy against competitors and market demand shifts in Tholaria.
What Do the Top Airbnb Listings in Tholaria Look Like?
Benchmark your potential! Explore examples of top-performing Airbnb properties in Tholariabased on Trailing Twelve Month (TTM) revenue. Analyze their characteristics, revenue, occupancy rate, and ADR to understand what drives success in this market.

Family house in Tholaria Amorgos
Entire Place • 2 bedrooms
PLORI APTS/OSTRIATraditional private apt for 4-5 p
Entire Place • 1 bedroom
Beautiful cycladic house in Tholaria with garden
Entire Place • 1 bedroom

PLORI STUDIOS/ZEFYROS studio with sea view
Private Room • N/A
Traditional newly built house with big terrace
Entire Place • 1 bedroom

PLORI STUDIOS/LEVANTE quiet studio in Anc. Aegiali
Entire Place • N/A
Note: Performance varies based on location, size, amenities, seasonality, and management quality. Data reflects the past 12 months.
Who Are the Top Airbnb Hosts in Tholaria?
Learn from the best! This table showcases top-performing Airbnb hosts in Tholaria based on the number of properties managed and estimated total revenue over the past year. Analyze their scale and performance metrics.
| Host Name | Properties | Grossing Revenue | Stay Reviews | Avg Rating |
|---|---|---|---|---|
| Nadia | 4 | $33,314 | 72 | 4.94/5.0 |
| Marina | 3 | $19,735 | 191 | 4.91/5.0 |
| George | 3 | $15,029 | 58 | 4.88/5.0 |
| Stamatis | 1 | $14,041 | 103 | 4.95/5.0 |
| Irini | 1 | $6,092 | 40 | 4.98/5.0 |
| Despina | 1 | $5,407 | 67 | 4.96/5.0 |
| Plito | 1 | $4,957 | 26 | 4.96/5.0 |
| Despina | 1 | $4,514 | 1 | Not Rated |
| Wendula | 1 | $4,257 | 7 | 4.43/5.0 |
| Susanna | 1 | $2,911 | 1 | Not Rated |
Analyzing the strategies of top hosts, such as their property selection, pricing, and guest communication, can offer valuable lessons for optimizing your own Airbnb operations in Tholaria.
How Does Tholaria's Airbnb Market Compare to Nearby Cities?
How does the Tholaria Airbnb market stack up against its neighbors? Compare key performance metrics like average monthly revenue, ADR, and occupancy rates in surrounding areas to understand the broader regional STR landscape.
Compared with Viranepiskopi, Tholaria has 24 percentage points lower occupancy and about $181 lower ADR. That helps frame whether this market is winning more on demand, pricing, or both.
| Market | Active Properties | Monthly Revenue | Daily Rate | Avg. Occupancy |
|---|---|---|---|---|
| Violi Charaki | 19 | $7,726 | $516.38 | 56% |
| Amnatos | 15 | $5,903 | $739.75 | 49% |
| Skaleta | 58 | $5,149 | $571.45 | 49% |
| Viranepiskopi | 11 | $5,048 | $322.71 | 66% |
| Pithari | 22 | $5,011 | $407.79 | 56% |
| Perama | 27 | $4,953 | $391.11 | 53% |
| Faros Armenistis | 114 | $4,924 | $712.32 | 42% |
| Xiro Chorio | 20 | $4,561 | $394.09 | 51% |
| Nea Magnisia | 22 | $4,360 | $393.94 | 52% |
| Tsikalaria | 11 | $4,175 | $302.76 | 53% |
Frequently Asked Questions About Airbnb in Tholaria
These quick answers summarize the most common investor and operator questions using AirROI's latest market data for Tholaria.
How much do Airbnb hosts make in Tholaria?
Tholaria hosts earn about $6,219 per year on average, with an average nightly rate of $142 and RevPAR of N/A. Those figures describe the typical revenue environment for active listings in Tholaria, Aegean, not the ceiling for the best operators. Source: AirROI 2026 data, Tholaria market, March 2025 to February 2026.
What is the average Airbnb occupancy rate in Tholaria?
The average Airbnb occupancy rate in Tholaria is 41.7%. August is the strongest month and April is the softest, so hosts should expect demand to move meaningfully throughout the year rather than stay flat.
What is the average Airbnb daily rate in Tholaria?
Listings in Tholaria average $142 per night. The broader pricing spread also matters: lower-performing listings cluster closer to the lower quartiles, while premium homes can price materially above the city average when demand spikes or listing quality stands out.
How many Airbnb listings are active in Tholaria?
Tholaria currently has about 18 active Airbnb listings in AirROI's market dataset. That supply count helps explain how competitive the market is, how much depth there is for benchmarking, and whether the market behaves like a niche destination or a scaled urban market.
How strict are short-term rental regulations in Tholaria?
AirROI currently classifies the short-term rental regulation level in Tholaria as High. The dataset also shows about 83.3% of listings with registration evidence. That is a market signal, not legal advice, so hosts should still confirm current licensing and compliance rules locally before listing.
What is the RevPAR for Airbnb in Tholaria?
RevPAR in Tholaria is about N/A. That metric combines pricing and occupancy into one efficiency number, so it is often a better quick benchmark than ADR alone when investors want to compare how well listings convert nightly rates into realized revenue.
Is Airbnb profitable in Tholaria?
At 41.7% occupancy, Tholaria can be profitable — but margins depend heavily on operating costs, property acquisition price, and how well hosts optimize pricing across seasons. Average annual revenue is $6,219, but individual returns depend on property type, location within the city, and the host's operating efficiency.
How far in advance do guests book Airbnb in Tholaria?
The average booking lead time in Tholaria is about 66 days — a longer planning horizon typical of destination or vacation markets where travelers book well in advance. Hosts who understand their market's booking cadence can adjust minimum stays and pricing windows accordingly.
What are the best neighborhoods for Airbnb in Tholaria?
Based on AirROI's analysis, some of the top neighborhoods for short-term rentals in Tholaria include Main Square, Church of Agios Georgios, Nearby Beaches. Each area attracts different guest profiles — from business travelers to leisure visitors — so the best location depends on the property type and target audience a host is aiming for. See the full neighborhood breakdown above.
What type of property performs best on Airbnb in Tholaria?
entire_home listings make up 77.8% of the active supply in Tholaria. The most common configuration does not always mean the most profitable — operators who identify underserved property types or bedroom counts can sometimes outperform the market average by filling a gap in local supply.
How does Tholaria compare to nearby Airbnb markets?
Among neighboring markets, Violi Charaki posts $92,715 in average annual revenue with 56.5% occupancy, compared to Tholaria's $6,219 and 41.7%. Comparing nearby markets helps investors understand whether a destination's performance reflects local demand or broader regional trends.
When is the peak season for Airbnb in Tholaria?
August is the highest-revenue month in Tholaria, while April is the softest. The revenue spread between them indicates a highly seasonal market — revenue in the peak month is more than double the low month, so cash-flow planning and pricing automation are critical.
About AirROI Market Data
AirROI tracks over 20 million properties across 190+ countries and maintains 15+ years of historical performance data, making it one of the deepest Airbnb and STR intelligence platforms available. The analytics pipeline aggregates listing-level data monthly — revenue, occupancy, nightly rates, RevPAR, guest demographics, booking patterns, and competitive supply — so investors and operators can benchmark any market against its own history and against neighboring destinations.
Real estate investors, property managers, financial institutions, hedge funds, tourism boards, hospitality consultants, tech platforms, and academic researchers rely on AirROI data to underwrite acquisitions, optimize pricing, model macro trends, and conduct peer-reviewed research. Data is available through in-depth market reports like this one and the Airbnb API with 22 endpoints and an Airbnb MCP Server for AI agents.
AirROI proprietary analytics as of 2026-02-28. Metrics reflect trailing twelve-month aggregates from active listings. Revenue figures are market averages, not projections. Neighborhood descriptions are AI-generated and reviewed for accuracy. For full methodology, see the data methodology page.