Abha, 'Asir Province Airbnb Market Data 2025: STR Report & Statistics
How much can you earn on Airbnb in Abha, 'Asir Province? Based on AirROI's 2025 dataset (December 2024 – November 2025), the short answer is $6,201 per year — at a $126 nightly rate, 27.0% occupancy, and a N/A RevPAR.
At 148 active listings, Abha is a boutique market where selective demand that rewards strong listing quality and pricing strategy. Supply expanded 311.1% as revenue climbed even while nightly rates softened — occupancy gains are outrunning rate pressure. For hosts entering now, strengthening demand means there is still room to build a profitable listing.
Regulation is high and 82% of listings show active registration — compliance is the cost of entry. In a market this size, differentiated listings with strong reviews can capture outsized returns relative to the competition.

Table of Contents [hide] [show]
What Are the Key Airbnb Metrics in Abha?
In Abha, the headline Airbnb metrics are $6,201 in average annual revenue,27.0% occupancy, $126 ADR, and $0 in RevPAR, and guests book about 11 days in advance.
How Much Do Airbnb Hosts Earn Monthly in Abha?
Understanding the monthly revenue variations for Airbnb listings in Abha is key to maximizing your short term rental income potential. Seasonality significantly impacts earnings. Our analysis, based on data from the past 12 months, shows that the peak revenue month for STRs in Abha is typically August, while March often presents the lowest earnings, highlighting opportunities for strategic pricing adjustments during shoulder and low seasons. Explore the typical Airbnb income in Abha across different performance tiers:
- Best-in-class properties (Top 10%) achieve $1,995+ monthly, often utilizing dynamic pricing and superior guest experiences.
- Strong performing properties (Top 25%) earn $1,163 or more, indicating effective management and desirable locations/amenities.
- Typical properties (Median) generate around $646 per month, representing the average market performance.
- Entry-level properties (Bottom 25%) see earnings around $317, often with potential for optimization.
Average Monthly Airbnb Earnings Trend in Abha
What Is the Monthly Airbnb Occupancy Rate in Abha?
Maximize your bookings by understanding the Abha STR occupancy trends. Seasonal demand shifts significantly influence how often properties are booked. Typically, Augustsees the highest demand (peak season occupancy), while March experiences the lowest (low season). Effective strategies, like adjusting minimum stays or offering promotions, can boost occupancy during slower periods. Here's how different property tiers perform in Abha:
- Best-in-class properties (Top 10%) achieve 51%+ occupancy, indicating high desirability and potentially optimized availability.
- Strong performing properties (Top 25%) maintain 34% or higher occupancy, suggesting good market fit and guest satisfaction.
- Typical properties (Median) have an occupancy rate around 20%.
- Entry-level properties (Bottom 25%) average 11% occupancy, potentially facing higher vacancy.
Average Monthly Occupancy Rate Trend in Abha
What Is the Average Airbnb Nightly Rate in Abha?
Effective short term rental pricing strategy in Abha involves understanding monthly ADR fluctuations. The Average Daily Rate (ADR) for Airbnb in Abha typically peaks in July and dips lowest during November. Leveraging Airbnb dynamic pricing tools or strategies based on this seasonality can significantly boost revenue. Here's a look at the typical nightly rates achieved:
- Best-in-class properties (Top 10%) command rates of $235+ per night, often due to premium features or locations.
- Strong performing properties (Top 25%) achieve nightly rates of $155 or more.
- Typical properties (Median) charge around $102 per night.
- Entry-level properties (Bottom 25%) earn around $69 per night.
Average Daily Rate (ADR) Trend by Month in Abha
What Is the RevPAR for Airbnb in Abha?
RevPAR in Abha is currently N/A. Because RevPAR combines nightly rates with realized occupancy, it is one of the cleanest ways to compare how efficiently listings turn demand into revenue across the market.
- Entry-level properties (Bottom 25%) see N/A RevPAR.
- Typical properties (Median) generate N/A RevPAR.
- Strong performers (Top 25%) earn N/A RevPAR.
- Best-in-class (Top 10%) achieve N/A RevPAR.
Average Monthly RevPAR Trend in Abha
RevPAR Insights for Abha
- RevPAR peaks in Jan and bottoms out in Jan, mirroring the broader seasonal demand pattern and suggesting opportunities for dynamic pricing.
Recommendations for Hosts
- Track your own RevPAR monthly against these Abha benchmarks. If your RevPAR falls below the median of N/A, examine whether low occupancy or low ADR is the primary drag.
- Use RevPAR rather than revenue alone when comparing properties of different sizes — it normalizes for available nights and gives a more accurate picture of performance.
Get Live Abha Market Intelligence 👇
Explore Real-time Analytics
When Is the Peak Season for Airbnb in Abha?
Abha's peak Airbnb season falls in August, July, June, while the softest stretch is January, March, November. Overall, the market shows highly seasonal trends requiring careful strategy, which should guide pricing, minimum stays, and cash-flow planning.
Peak Season (August, July, June)
- Revenue averages $1,625 per month
- Occupancy rates average 35.5%
- Daily rates average $137
Shoulder Season
- Revenue averages $805 per month
- Occupancy maintains around 22.9%
- Daily rates hold near $127
Low Season (January, March, November)
- Revenue drops to average $591 per month
- Occupancy decreases to average 18.2%
- Daily rates adjust to average $125
Seasonality Insights for Abha
- Airbnb seasonality in Abha is pronounced. Revenue swings sharply between peak and low months, which means pricing strategy, minimum-stay settings, and cash reserves all need to account for extended slower periods.
- During the high season, the absolute peak month showcases Abha's highest earning potential, with monthly revenues climbing to $1,995, occupancy reaching 44.3%, and ADRs peaking at $141.
- Conversely, the slowest single month marks the market's lowest point — revenue may dip to $557, occupancy could drop to 16.5%, and ADRs may adjust to $112.
- Lower occupancy paired with meaningful seasonality means hosts in Abha need to maximize every peak-season booking and seriously consider whether off-season pricing adjustments or minimum-stay changes can capture incremental revenue.
Seasonal Strategies for Maximizing Profit
- Peak Season: Maximize revenue through premium pricing. In a high-regulation market like Abha, ensure your permit covers the number of nights you plan to book — some jurisdictions cap annual rental days.
- Low Season: Offer competitive pricing, extended-stay discounts, and flexible cancellation policies. Target off-season travelers like remote workers, budget-conscious guests, and travelers with flexible schedules.
- Shoulder Seasons: Implement dynamic pricing that bridges peak and low rates. Target weekend travelers, local events, and business visitors. Slightly more flexible terms than peak season can help maintain occupancy without deep discounting.
- In a highly seasonal market like Abha, building a cash reserve during the top months is essential for covering fixed costs during the slow period. Automated pricing tools can help capture demand shifts in real time.
Do You Need a License for Airbnb in Abha?
Yes, Abha, 'Asir Province, Saudi Arabia enforces high STR regulations and 82% of active listings show registration evidence — indicating that enforcement is active and compliance is a prerequisite for operating legally. Hosts entering this market should budget for permit fees, inspections, and potential occupancy tax obligations as part of their startup costs. Always verify the latest short-term rental regulations and Airbnb license requirements directly with local government authorities for Abha to ensure full compliance before hosting.
(Source: AirROI data, 2026, based on 82% licensed listings)
What Are the Best Neighborhoods for Airbnb in Abha?
Abha is a smaller vacation rental market where a handful of neighborhoods drive most of the booking activity. Choosing the right area is especially important in boutique markets — there is less room for a mediocre location to succeed on volume alone. The areas below highlight where short-term rental demand is strongest and why.
| Neighborhood / Area | Why Host Here? (Target Guests & Appeal) | Key Attractions & Landmarks |
|---|---|---|
| Al-Soudah | A stunning mountainous area known for its cool climate, Al-Soudah is popular for outdoor enthusiasts and families looking to escape the heat. It's an ideal location for eco-tourism and nature lovers. | Al-Soudah Park, Cable car to the mountain, Hiking trails, Beautiful views of the Asir mountains, Local markets |
| Abha City Center | The vibrant city center offers a mix of culture, shopping, and dining experiences. It's well-connected and popular among tourists who wish to explore the city and its attractions. | Al-Muftaha Village, Abha Palace Hotel, Souq Al-Hamdi, Art galleries, Abha Lake |
| Aas Saydah | Famous for its unique cultural heritage, this area attracts visitors interested in traditional Saudi architecture and local crafts. A great location for experiencing the local culture. | Al-Soudah Park Museum, Traditional markets, Heritage villages, Cultural festivals |
| Al-Namas | Known for its beautiful greenery and traditional markets, Al-Namas offers a unique glimpse into rural life in Asir. It's perfect for travelers looking for authenticity. | Namas Heritage Village, Local handicrafts, Traditional Saudi cuisine |
| Habala Village | This historic village is known for its caves and hanging homes. It's a unique spot for tourists interested in history and local traditions, offering incredible views. | Habala Hanging Village, Hiking and trekking routes, Cultural experiences |
| Al-Darajah | A scenic area that offers beautiful landscapes and perfect weather, Al-Darajah is an excellent choice for eco-tourism and those seeking tranquility in nature. | Scenic view points, Agricultural terraces, Local wildlife |
| Al-Muftaha | This area is famous for its art scene and cultural events. It's ideal for visitors looking for a creative atmosphere and artistic endeavors. | Art galleries, Cultural festivals, Museum of Folklore |
| Asir National Park | A vast natural park that draws nature lovers with its diverse wildlife and stunning scenery. A fantastic spot for outdoor activities and camping. | Hiking trails, Camping sites, Wildlife watching |
Because Abha has a high regulation profile, confirming that short-term rental permits are available in your target neighborhood is a critical first step before committing to a property purchase. Regulation can vary at the neighborhood or district level even within the same city.
What Types of Properties Are on Airbnb in Abha?
Room Type Distribution
Property Type Distribution
Market Composition Insights for Abha
- The Abha Airbnb market composition is heavily skewed towards Entire Home/Apt listings, which make up 98.6% of the 148 active rentals. This indicates strong guest preference for privacy and space.
- Looking at the property type distribution in Abha, Apartment/Condo properties are the most common (89.2%), reflecting the local real estate landscape.
- Smaller segments like outdoor/unique, hotel/boutique, others (combined 2.8%) offer potential for unique stay experiences.
Abha Airbnb Room Capacity Analysis (2026): Bedroom Distribution
Distribution of Listings by Number of Bedrooms
Room Capacity Insights for Abha
- The dominant room capacity in Abha is 1 bedroom listings, making up 46.6% of the market. This suggests a strong demand for properties suitable for couples or solo travelers.
- Together, 1 bedroom and 2 bedrooms properties represent 80.4% of the active Airbnb listings in Abha, indicating a high concentration in these sizes.
Abha Vacation Rental Guest Capacity Trends (2026)
Distribution of Listings by Guest Capacity
Guest Capacity Insights for Abha
- The most common guest capacity trend in Abha vacation rentals is listings accommodating 2 guests (29.1%). This suggests the primary traveler segment is likely couples or solo travelers.
- Properties designed for 2 guests and 4 guests dominate the Abha STR market, accounting for 50.7% of listings.
- 27.0% of properties accommodate 6+ guests, serving the market segment for larger families or group travel in Abha.
- On average, properties in Abha are equipped to host 4.2 guests.
What Amenities Do Airbnb Guests Expect in Abha?
Amenity Prevalence
Amenity Insights for Abha
- Essential amenities in Abha that guests expect include: TV, Air conditioning. Lacking these (any) could significantly impact bookings.
- Popular amenities like Free parking on premises, Kitchen, Wifi are common but not universal. Offering these can provide a competitive edge.
- Warning: Wifi is not universally provided but is considered essential globally. Ensure reliable Wifi is offered.
Recommendations for Hosts
- Ensure your listing includes all essential amenities for Abha: TV, Air conditioning.
- Prioritize adding missing essentials: Air conditioning.
- Consider adding popular differentiators like Free parking on premises or Kitchen to increase appeal.
- Highlight unique or less common amenities you offer (e.g., hot tub, dedicated workspace, EV charger) in your listing description and photos.
- Regularly check competitor amenities in Abha to stay competitive.
Dive Deeper: Advanced Abha STR Market Data (2026)
Ready to unlock more insights? AirROI provides access to advanced metrics and comprehensive Airbnb data for Abha. Explore detailed analytics beyond this report to refine your investment strategy, optimize pricing, and maximize your vacation rental profits.
Explore Advanced MetricsAbha Airbnb Guest Demographics & Profile Analysis (2026)
Guest Profile Summary for Abha
- The typical guest profile for Airbnb in Abha consists of primarily domestic travelers (84%), often arriving from nearby Riyadh, typically belonging to the Post-2000s (Gen Z/Alpha) group (50%), primarily speaking Arabic or English.
- Domestic travelers account for 83.7% of guests.
- Key international markets include Saudi Arabia (83.7%) and United States (6.6%).
- Top languages spoken are Arabic (44.5%) followed by English (43.6%).
- A significant demographic segment is the Post-2000s (Gen Z/Alpha) group, representing 50% of guests.
Recommendations for Hosts
- Target domestic marketing efforts towards travelers from Riyadh and Jeddah.
- Tailor amenities and listing descriptions to appeal to the dominant Post-2000s (Gen Z/Alpha) demographic (e.g., highlight fast WiFi, smart home features, local guides).
- Highlight unique local experiences or amenities relevant to the primary guest profile.
- Consider seasonal promotions aligned with peak travel times for key origin markets.
Abha Airbnb Booking Patterns (2026): Available vs. Booked Days
Available Days Distribution
Booked Days Distribution
Booking Pattern Insights for Abha
- The most common availability pattern in Abha falls within the 271-366 days range, representing 87.8% of listings. This suggests many properties have significant open periods on their calendars.
- Approximately 100.0% of listings show high availability (181+ days open annually), indicating potential for increased bookings or specific owner usage patterns.
- For booked days, the 31-90 days range is most frequent in Abha (43.2%), reflecting common guest stay durations or potential owner blocking patterns.
- A notable 0.7% of properties secure long booking periods (181+ days booked per year), highlighting successful long-term rental strategies or significant owner usage.
How Far in Advance Do Guests Book Airbnb in Abha?
Average Booking Lead Time by Month
Booking Lead Time Insights for Abha
- The overall average booking lead time for vacation rentals in Abha is 11 days.
- Guests book furthest in advance for stays during November (average 20 days), likely coinciding with peak travel demand or local events.
- The shortest booking windows occur for stays in December (average 4 days), indicating more last-minute travel plans during this time.
- Seasonally, Spring (13 days avg.) sees the longest lead times, while Winter (6 days avg.) has the shortest, reflecting typical travel planning cycles.
Recommendations for Hosts
- Use the overall average lead time (11 days) as a baseline for your pricing and availability strategy in Abha.
- Target marketing efforts for the Spring season well in advance (at least 13 days) to capture early planners.
- Monitor your own booking lead times against these Abha averages to identify opportunities for dynamic pricing adjustments.
Abha Airbnb Minimum Stay Requirements Analysis
Distribution of Listings by Minimum Night Requirement
1 Night
112 listings
75.7% of total
2 Nights
7 listings
4.7% of total
3 Nights
6 listings
4.1% of total
30+ Nights
23 listings
15.5% of total
Key Insights
- The most prevalent minimum stay requirement in Abha is 1 Night, adopted by 75.7% of listings. This highlights the market's preference for shorter, flexible bookings.
- A strong majority (80.4%) of the Abha Airbnb data shows acceptance of very short stays (1-2 nights), indicating a dynamic, high-turnover market.
- A significant segment (15.5%) caters to monthly stays (30+ nights) in Abha, pointing to opportunities in the extended-stay market.
Recommendations
- Align with the market by considering a 1 Night minimum stay, as 75.7% of Abha hosts use this setting.
- Explore offering discounts for stays of 30+ nights to attract the 15.5% of the market seeking extended stays.
- Adjust minimum nights based on seasonality – potentially shorter during low season and longer during peak demand periods in Abha.
Abha Airbnb Cancellation Policy Trends Analysis (2026)
Flexible
103 listings
70.5% of total
Moderate
29 listings
19.9% of total
Firm
12 listings
8.2% of total
Strict
2 listings
1.4% of total
Cancellation Policy Insights for Abha
- The prevailing Airbnb cancellation policy trend in Abha is Flexible, used by 70.5% of listings.
- The market strongly favors guest-friendly terms, with 90.4% of listings offering Flexible or Moderate policies. This suggests guests in Abha may expect booking flexibility.
- Strict cancellation policies are quite rare (1.4%), potentially making listings with this policy less competitive unless justified by high demand or property type.
Recommendations for Hosts
- Consider adopting a Flexible policy to align with the 70.5% market standard in Abha.
- Given the high prevalence of Flexible policies (70.5%), offering this can enhance booking appeal, especially during shoulder seasons.
- Using a Strict policy might deter some guests, as only 1.4% of listings use it. Evaluate if potential revenue protection outweighs possible lower booking rates.
- Regularly review your cancellation policy against competitors and market demand shifts in Abha.
What Do the Top Airbnb Listings in Abha Look Like?
Benchmark your potential! Explore examples of top-performing Airbnb properties in Abhabased on Trailing Twelve Month (TTM) revenue. Analyze their characteristics, revenue, occupancy rate, and ADR to understand what drives success in this market.

The Fog Vista Cabin The Fog Vista Cabin
Entire Place • 2 bedrooms
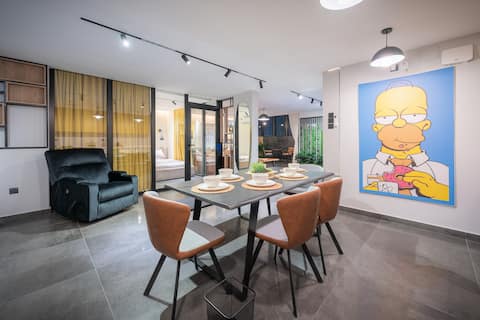
Simpsons Apartment
Entire Place • 2 bedrooms
Fog View Shawl
Entire Place • 2 bedrooms
Cricket chalet with a pool, spacious outdoor patio and seating overlooking
Entire Place • 2 bedrooms
Chalet with two bedrooms and indoor pool
Entire Place • 2 bedrooms

Abha Summer Resort 3
Entire Place • 5 bedrooms
Note: Performance varies based on location, size, amenities, seasonality, and management quality. Data reflects the past 12 months.
Who Are the Top Airbnb Hosts in Abha?
Learn from the best! This table showcases top-performing Airbnb hosts in Abha based on the number of properties managed and estimated total revenue over the past year. Analyze their scale and performance metrics.
| Host Name | Properties | Grossing Revenue | Stay Reviews | Avg Rating |
|---|---|---|---|---|
| Arz | 6 | $88,550 | 275 | 4.88/5.0 |
| Mohammed | 2 | $71,619 | 17 | 5.00/5.0 |
| Abdul | 3 | $64,601 | 104 | 4.98/5.0 |
| Abu Meteab | 2 | $42,714 | 7 | 4.80/5.0 |
| تركي | 7 | $40,770 | 232 | 4.87/5.0 |
| Aziz | 4 | $39,971 | 801 | 4.90/5.0 |
| بدر | 6 | $38,745 | 272 | 4.90/5.0 |
| Nawaf | 10 | $34,077 | 146 | 4.80/5.0 |
| Osama | 3 | $28,204 | 120 | 4.79/5.0 |
| مشبب | 1 | $28,069 | 9 | 4.67/5.0 |
Analyzing the strategies of top hosts, such as their property selection, pricing, and guest communication, can offer valuable lessons for optimizing your own Airbnb operations in Abha.
How Does Abha's Airbnb Market Compare to Nearby Cities?
How does the Abha Airbnb market stack up against its neighbors? Compare key performance metrics like average monthly revenue, ADR, and occupancy rates in surrounding areas to understand the broader regional STR landscape.
Compared with Khamis Mushayt, Abha has 3 percentage points higher occupancy and about $5 lower ADR. That helps frame whether this market is winning more on demand, pricing, or both.
| Market | Active Properties | Monthly Revenue | Daily Rate | Avg. Occupancy |
|---|---|---|---|---|
| Khamis Mushayt | 37 | $462 | $130.38 | 24% |
| Khamis Mushait | 20 | $349 | $120.10 | 21% |
| Al-Imarat | 10 | $321 | $109.08 | 23% |
Frequently Asked Questions About Airbnb in Abha
These quick answers summarize the most common investor and operator questions using AirROI's latest market data for Abha.
How much do Airbnb hosts make in Abha?
Abha hosts earn about $6,201 per year on average, with an average nightly rate of $126 and RevPAR of N/A. Those figures describe the typical revenue environment for active listings in Abha, 'Asir Province, not the ceiling for the best operators. Source: AirROI 2025 data, Abha market, December 2024 to November 2025.
What is the average Airbnb occupancy rate in Abha?
The average Airbnb occupancy rate in Abha is 27.0%. August is the strongest month and March is the softest, so hosts should expect demand to move meaningfully throughout the year rather than stay flat.
What is the average Airbnb daily rate in Abha?
Listings in Abha average $126 per night. The broader pricing spread also matters: lower-performing listings cluster closer to the lower quartiles, while premium homes can price materially above the city average when demand spikes or listing quality stands out.
How many Airbnb listings are active in Abha?
Abha currently has about 148 active Airbnb listings in AirROI's market dataset. That supply count helps explain how competitive the market is, how much depth there is for benchmarking, and whether the market behaves like a niche destination or a scaled urban market.
How strict are short-term rental regulations in Abha?
AirROI currently classifies the short-term rental regulation level in Abha as High. The dataset also shows about 82.4% of listings with registration evidence. That is a market signal, not legal advice, so hosts should still confirm current licensing and compliance rules locally before listing.
What is the RevPAR for Airbnb in Abha?
RevPAR in Abha is about N/A. That metric combines pricing and occupancy into one efficiency number, so it is often a better quick benchmark than ADR alone when investors want to compare how well listings convert nightly rates into realized revenue.
Is Airbnb profitable in Abha?
Occupancy of 27.0% means Abha is a more selective market. Profitability is achievable but requires careful cost management, premium positioning, or targeting longer stays to reduce turnover. Average annual revenue is $6,201, but individual returns depend on property type, location within the city, and the host's operating efficiency.
How far in advance do guests book Airbnb in Abha?
The average booking lead time in Abha is about 11 days — a relatively short booking window, meaning most guests decide within a few weeks of their trip — dynamic pricing can capture late demand. Hosts who understand their market's booking cadence can adjust minimum stays and pricing windows accordingly.
What are the best neighborhoods for Airbnb in Abha?
Based on AirROI's analysis, some of the top neighborhoods for short-term rentals in Abha include Al-Soudah, Abha City Center, Aas Saydah. Each area attracts different guest profiles — from business travelers to leisure visitors — so the best location depends on the property type and target audience a host is aiming for. See the full neighborhood breakdown above.
What type of property performs best on Airbnb in Abha?
entire_home listings make up 98.6% of the active supply in Abha. The most common configuration does not always mean the most profitable — operators who identify underserved property types or bedroom counts can sometimes outperform the market average by filling a gap in local supply.
How does Abha compare to nearby Airbnb markets?
Among neighboring markets, Khamis Mushayt posts $5,547 in average annual revenue with 23.6% occupancy, compared to Abha's $6,201 and 27.0%. Comparing nearby markets helps investors understand whether a destination's performance reflects local demand or broader regional trends.
When is the peak season for Airbnb in Abha?
August is the highest-revenue month in Abha, while March is the softest. The revenue spread between them indicates a highly seasonal market — revenue in the peak month is more than double the low month, so cash-flow planning and pricing automation are critical.
About AirROI Market Data
AirROI tracks over 20 million properties across 190+ countries and maintains 15+ years of historical performance data, making it one of the deepest Airbnb and STR intelligence platforms available. The analytics pipeline aggregates listing-level data monthly — revenue, occupancy, nightly rates, RevPAR, guest demographics, booking patterns, and competitive supply — so investors and operators can benchmark any market against its own history and against neighboring destinations.
Real estate investors, property managers, financial institutions, hedge funds, tourism boards, hospitality consultants, tech platforms, and academic researchers rely on AirROI data to underwrite acquisitions, optimize pricing, model macro trends, and conduct peer-reviewed research. Data is available through in-depth market reports like this one and the Airbnb API with 22 endpoints and an Airbnb MCP Server for AI agents.
AirROI proprietary analytics as of 2025-11-30. Metrics reflect trailing twelve-month aggregates from active listings. Revenue figures are market averages, not projections. Neighborhood descriptions are AI-generated and reviewed for accuracy. For full methodology, see the data methodology page.