Icheon-ri, Gapyeong-gun Airbnb Market Data 2025: STR Report & Statistics
How much can you earn on Airbnb in Icheon-ri, Gapyeong-gun? Based on AirROI's 2025 dataset (June 2024 – May 2025), the short answer is $13,386 per year — at a $235 nightly rate, 22.4% occupancy, and a N/A RevPAR.
With just 23 active listings, Icheon-ri is a micro-market where selective demand that rewards strong listing quality and pricing strategy. Supply grew 76.9% and nightly rates have risen, creating an environment where the most bookable listings stand to capture outsized share. Hosts who pair competitive pricing with strong guest experience are well-positioned to convert the growing traveler base into consistent bookings.
Regulation data is limited for this market, and hosts should verify short-term rental rules with the local government. In a market this size, differentiated listings with strong reviews can capture outsized returns relative to the competition.
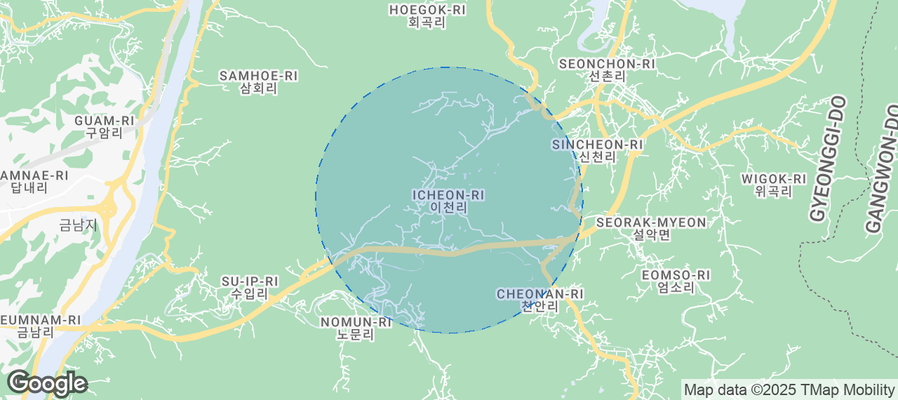
Table of Contents [hide] [show]
What Are the Key Airbnb Metrics in Icheon-ri?
In Icheon-ri, the headline Airbnb metrics are $13,386 in average annual revenue,22.4% occupancy, $235 ADR, and $0 in RevPAR, and guests book about 22 days in advance.
How Much Do Airbnb Hosts Earn Monthly in Icheon-ri?
Understanding the monthly revenue variations for Airbnb listings in Icheon-ri is key to maximizing your short term rental income potential. Seasonality significantly impacts earnings. Our analysis, based on data from the past 12 months, shows that the peak revenue month for STRs in Icheon-ri is typically January, while June often presents the lowest earnings, highlighting opportunities for strategic pricing adjustments during shoulder and low seasons. Explore the typical Airbnb income in Icheon-ri across different performance tiers:
- Best-in-class properties (Top 10%) achieve $3,936+ monthly, often utilizing dynamic pricing and superior guest experiences.
- Strong performing properties (Top 25%) earn $2,621 or more, indicating effective management and desirable locations/amenities.
- Typical properties (Median) generate around $1,346 per month, representing the average market performance.
- Entry-level properties (Bottom 25%) see earnings around $741, often with potential for optimization.
Average Monthly Airbnb Earnings Trend in Icheon-ri
What Is the Monthly Airbnb Occupancy Rate in Icheon-ri?
Maximize your bookings by understanding the Icheon-ri STR occupancy trends. Seasonal demand shifts significantly influence how often properties are booked. Typically, Augustsees the highest demand (peak season occupancy), while July experiences the lowest (low season). Effective strategies, like adjusting minimum stays or offering promotions, can boost occupancy during slower periods. Here's how different property tiers perform in Icheon-ri:
- Best-in-class properties (Top 10%) achieve 50%+ occupancy, indicating high desirability and potentially optimized availability.
- Strong performing properties (Top 25%) maintain 33% or higher occupancy, suggesting good market fit and guest satisfaction.
- Typical properties (Median) have an occupancy rate around 22%.
- Entry-level properties (Bottom 25%) average 15% occupancy, potentially facing higher vacancy.
Average Monthly Occupancy Rate Trend in Icheon-ri
What Is the Average Airbnb Nightly Rate in Icheon-ri?
Effective short term rental pricing strategy in Icheon-ri involves understanding monthly ADR fluctuations. The Average Daily Rate (ADR) for Airbnb in Icheon-ri typically peaks in February and dips lowest during August. Leveraging Airbnb dynamic pricing tools or strategies based on this seasonality can significantly boost revenue. Here's a look at the typical nightly rates achieved:
- Best-in-class properties (Top 10%) command rates of $457+ per night, often due to premium features or locations.
- Strong performing properties (Top 25%) achieve nightly rates of $290 or more.
- Typical properties (Median) charge around $188 per night.
- Entry-level properties (Bottom 25%) earn around $149 per night.
Average Daily Rate (ADR) Trend by Month in Icheon-ri
What Is the RevPAR for Airbnb in Icheon-ri?
RevPAR in Icheon-ri is currently N/A. Because RevPAR combines nightly rates with realized occupancy, it is one of the cleanest ways to compare how efficiently listings turn demand into revenue across the market.
- Entry-level properties (Bottom 25%) see N/A RevPAR.
- Typical properties (Median) generate N/A RevPAR.
- Strong performers (Top 25%) earn N/A RevPAR.
- Best-in-class (Top 10%) achieve N/A RevPAR.
Average Monthly RevPAR Trend in Icheon-ri
RevPAR Insights for Icheon-ri
- RevPAR peaks in Jan and bottoms out in Jan, mirroring the broader seasonal demand pattern and suggesting opportunities for dynamic pricing.
Recommendations for Hosts
- Track your own RevPAR monthly against these Icheon-ri benchmarks. If your RevPAR falls below the median of N/A, examine whether low occupancy or low ADR is the primary drag.
- Use RevPAR rather than revenue alone when comparing properties of different sizes — it normalizes for available nights and gives a more accurate picture of performance.
Get Live Icheon-ri Market Intelligence 👇
Explore Real-time Analytics
When Is the Peak Season for Airbnb in Icheon-ri?
Icheon-ri's peak Airbnb season falls in January, May, August, while the softest stretch is June, July, December. Overall, the market shows moderate seasonality with distinct peak and low periods, which should guide pricing, minimum stays, and cash-flow planning.
Peak Season (January, May, August)
- Revenue averages $2,233 per month
- Occupancy rates average 28.2%
- Daily rates average $252
Shoulder Season
- Revenue averages $1,898 per month
- Occupancy maintains around 27.1%
- Daily rates hold near $235
Low Season (June, July, December)
- Revenue drops to average $1,493 per month
- Occupancy decreases to average 25.4%
- Daily rates adjust to average $214
Seasonality Insights for Icheon-ri
- The Airbnb seasonality pattern in Icheon-ri shows moderate seasonality with distinct peak and low periods. While the sections above show seasonal averages, it is also insightful to look at the extremes:
- During the high season, the absolute peak month showcases Icheon-ri's highest earning potential, with monthly revenues climbing to $2,467, occupancy reaching 32.1%, and ADRs peaking at $275.
- Conversely, the slowest single month marks the market's lowest point — revenue may dip to $1,363, occupancy could drop to 22.6%, and ADRs may adjust to $209.
- Lower occupancy paired with meaningful seasonality means hosts in Icheon-ri need to maximize every peak-season booking and seriously consider whether off-season pricing adjustments or minimum-stay changes can capture incremental revenue.
Seasonal Strategies for Maximizing Profit
- Peak Season: Maximize revenue through premium pricing and potentially longer minimum stays. Ensure high availability and consider tightening cancellation policies to reduce last-minute gaps.
- Low Season: Offer competitive pricing, extended-stay discounts, and flexible cancellation policies. Target off-season travelers like remote workers, budget-conscious guests, and travelers with flexible schedules.
- Shoulder Seasons: Implement dynamic pricing that bridges peak and low rates. Target weekend travelers, local events, and business visitors. Slightly more flexible terms than peak season can help maintain occupancy without deep discounting.
- Regularly analyze your own performance against these Icheon-ri seasonality benchmarks and adjust your pricing and availability strategy accordingly.
Do You Need a License for Airbnb in Icheon-ri?
With 22% of listings showing registration in 2026, understanding potential Airbnb license requirements is crucial in Icheon-ri. Always verify the latest short-term rental regulations and Airbnb license requirements directly with local government authorities for Icheon-ri to ensure full compliance before hosting.
(Source: AirROI data, 2026, based on 22% licensed listings)
What Are the Best Neighborhoods for Airbnb in Icheon-ri?
With a compact short-term rental market, Icheon-ri gives early-mover hosts an advantage in the right neighborhoods. The areas listed below are where guest demand and local attractions converge — a useful lens for investors evaluating whether to enter this market and where to position their listing.
| Neighborhood / Area | Why Host Here? (Target Guests & Appeal) | Key Attractions & Landmarks |
|---|---|---|
| Chuncheon | A scenic city known for its natural beauty and proximity to the famous Nami Island, attracting tourists throughout the year. | Nami Island, Soyang Lake, Chuncheon Myeongdong Street, Animation Museum, Kangwon National University |
| Gapyeong | Famous for its stunning nature, including mountains and rivers, making it popular for both relaxation and adventure activities. | Nami Island, Petite France, The Garden of Morning Calm, Cheongpyeong Lake, Gapyeong Rail Park |
| Pocheon | Known for its beautiful landscapes and recreational activities, offering a peaceful retreat away from the city hustle. | Pocheon Art Valley, Herb Island, Pocheon National Museum, Saneum Recreational Forest, Korean Folk Village |
| Inje | Popular for outdoor activities like hiking and water sports, with pristine natural settings that attract adventure seekers. | Seoraksan National Park, Inje Speedium, Bokhangang River, Inje Icefish Festival, Hwaamdonggul Cave |
| Suwon | A city rich in history with its UNESCO World Heritage site, attracting both domestic and international tourists. | Hwaseong Fortress, Korean Folk Village, Suwon World Cup Stadium, Samsung Innovation Museum, Suwoncheon Stream |
| Yangpyeong | A peaceful area near Seoul, famous for its beautiful landscapes and eco-friendly tourism. | Dumulmeori, Yangpyeong Rail Bike, Yangpyeong Tea Plantation, Yeoju Premium Outlets, Seonmaeul Recreational Forest |
| Icheon | Known for its traditional pottery and rich cultural heritage, it attracts visitors interested in crafts and local cuisine. | Icheon Ceramic Village, Icheon Termeden Spa, Korean Traditional Pottery Museum, Icheon Rice Museum, Icheon Wine Tunnel |
| Yeoju | Features cultural sites and is famous for its beautiful riverside areas, making it a popular destination for relaxation and family trips. | Yeoju Premium Outlets, Shilleuksa Temple, Yeoju Seonbichon, Yeoju Art Park, Bonghwang Bridge |
With 8 distinct neighborhoods showing meaningful short-term rental activity, Icheon-ri offers diversification within a single market. Investors can tailor their strategy — from high-turnover tourist zones to quieter residential areas that attract longer stays and remote workers.
What Types of Properties Are on Airbnb in Icheon-ri?
Room Type Distribution
Property Type Distribution
Market Composition Insights for Icheon-ri
- The Icheon-ri Airbnb market composition is heavily skewed towards Entire Home/Apt listings, which make up 82.6% of the 23 active rentals. This indicates strong guest preference for privacy and space.
- Looking at the property type distribution in Icheon-ri, Hotel/Boutique properties are the most common (60.9%), reflecting the local real estate landscape.
- Houses represent a significant 30.4% portion, catering likely to families or larger groups.
- The presence of 60.9% Hotel/Boutique listings indicates integration with traditional hospitality.
Icheon-ri Airbnb Room Capacity Analysis (2026): Bedroom Distribution
Distribution of Listings by Number of Bedrooms
Room Capacity Insights for Icheon-ri
- The dominant room capacity in Icheon-ri is 2 bedrooms listings, making up 56.5% of the market. This suggests a strong demand for properties suitable for couples or solo travelers.
- Together, 2 bedrooms and 1 bedroom properties represent 82.6% of the active Airbnb listings in Icheon-ri, indicating a high concentration in these sizes.
Icheon-ri Vacation Rental Guest Capacity Trends (2026)
Distribution of Listings by Guest Capacity
Guest Capacity Insights for Icheon-ri
- The most common guest capacity trend in Icheon-ri vacation rentals is listings accommodating 8+ guests (56.5%). This suggests the primary traveler segment is likely larger groups.
- Properties designed for 8+ guests and 6 guests dominate the Icheon-ri STR market, accounting for 78.2% of listings.
- 78.2% of properties accommodate 6+ guests, serving the market segment for larger families or group travel in Icheon-ri.
- On average, properties in Icheon-ri are equipped to host 6.7 guests.
What Amenities Do Airbnb Guests Expect in Icheon-ri?
Amenity Prevalence
Amenity Insights for Icheon-ri
- Essential amenities in Icheon-ri that guests expect include: Fire extinguisher, Smoke alarm, Wifi, Kitchen, Heating, Air conditioning, Hot water, Refrigerator. Lacking these (any) could significantly impact bookings.
- Popular amenities like Free parking on premises, TV are common but not universal. Offering these can provide a competitive edge.
Recommendations for Hosts
- Ensure your listing includes all essential amenities for Icheon-ri: Fire extinguisher, Smoke alarm, Wifi, Kitchen, Heating, Air conditioning, Hot water, Refrigerator.
- Prioritize adding missing essentials: Hot water, Refrigerator.
- Consider adding popular differentiators like Free parking on premises or TV to increase appeal.
- Highlight unique or less common amenities you offer (e.g., hot tub, dedicated workspace, EV charger) in your listing description and photos.
- Regularly check competitor amenities in Icheon-ri to stay competitive.
Dive Deeper: Advanced Icheon-ri STR Market Data (2026)
Ready to unlock more insights? AirROI provides access to advanced metrics and comprehensive Airbnb data for Icheon-ri. Explore detailed analytics beyond this report to refine your investment strategy, optimize pricing, and maximize your vacation rental profits.
Explore Advanced MetricsIcheon-ri Airbnb Guest Demographics & Profile Analysis (2026)
Guest Profile Summary for Icheon-ri
- The typical guest profile for Airbnb in Icheon-ri consists of primarily domestic travelers (94%), often arriving from nearby Seoul, typically belonging to the Post-2000s (Gen Z/Alpha) group (50%), primarily speaking Korean or English.
- Domestic travelers account for 93.9% of guests.
- Key international markets include South Korea (93.9%) and Singapore (2.4%).
- Top languages spoken are Korean (57.4%) followed by English (27.7%).
- A significant demographic segment is the Post-2000s (Gen Z/Alpha) group, representing 50% of guests.
Recommendations for Hosts
- Target domestic marketing efforts towards travelers from Seoul and Ansan-si.
- Tailor amenities and listing descriptions to appeal to the dominant Post-2000s (Gen Z/Alpha) demographic (e.g., highlight fast WiFi, smart home features, local guides).
- Highlight unique local experiences or amenities relevant to the primary guest profile.
- Consider seasonal promotions aligned with peak travel times for key origin markets.
Icheon-ri Airbnb Booking Patterns (2026): Available vs. Booked Days
Available Days Distribution
Booked Days Distribution
Booking Pattern Insights for Icheon-ri
- The most common availability pattern in Icheon-ri falls within the 271-366 days range, representing 78.3% of listings. This suggests many properties have significant open periods on their calendars.
- Approximately 95.7% of listings show high availability (181+ days open annually), indicating potential for increased bookings or specific owner usage patterns.
- For booked days, the 1-30 days range is most frequent in Icheon-ri (43.5%), reflecting common guest stay durations or potential owner blocking patterns.
- A notable 4.3% of properties secure long booking periods (181+ days booked per year), highlighting successful long-term rental strategies or significant owner usage.
How Far in Advance Do Guests Book Airbnb in Icheon-ri?
Average Booking Lead Time by Month
Booking Lead Time Insights for Icheon-ri
- The overall average booking lead time for vacation rentals in Icheon-ri is 22 days.
- Guests book furthest in advance for stays during June (average 28 days), likely coinciding with peak travel demand or local events.
- The shortest booking windows occur for stays in July (average 13 days), indicating more last-minute travel plans during this time.
- Seasonally, Summer (23 days avg.) sees the longest lead times, while Winter (18 days avg.) has the shortest, reflecting typical travel planning cycles.
Recommendations for Hosts
- Use the overall average lead time (22 days) as a baseline for your pricing and availability strategy in Icheon-ri.
- During July, focus on last-minute booking availability and promotions, as guests book with very short notice (13 days avg.).
- Target marketing efforts for the Summer season well in advance (at least 23 days) to capture early planners.
- Monitor your own booking lead times against these Icheon-ri averages to identify opportunities for dynamic pricing adjustments.
Icheon-ri Airbnb Minimum Stay Requirements Analysis
Distribution of Listings by Minimum Night Requirement
1 Night
23 listings
100% of total
Key Insights
- The most prevalent minimum stay requirement in Icheon-ri is 1 Night, adopted by 100% of listings. This highlights the market's preference for shorter, flexible bookings.
- A strong majority (100.0%) of the Icheon-ri Airbnb data shows acceptance of very short stays (1-2 nights), indicating a dynamic, high-turnover market.
Recommendations
- Align with the market by considering a 1 Night minimum stay, as 100% of Icheon-ri hosts use this setting.
- Adjust minimum nights based on seasonality – potentially shorter during low season and longer during peak demand periods in Icheon-ri.
Icheon-ri Airbnb Cancellation Policy Trends Analysis (2026)
Flexible
2 listings
10% of total
Moderate
13 listings
65% of total
Strict
5 listings
25% of total
Cancellation Policy Insights for Icheon-ri
- The prevailing Airbnb cancellation policy trend in Icheon-ri is Moderate, used by 65% of listings.
- The market strongly favors guest-friendly terms, with 75.0% of listings offering Flexible or Moderate policies. This suggests guests in Icheon-ri may expect booking flexibility.
Recommendations for Hosts
- Consider adopting a Moderate policy to align with the 65% market standard in Icheon-ri.
- Regularly review your cancellation policy against competitors and market demand shifts in Icheon-ri.
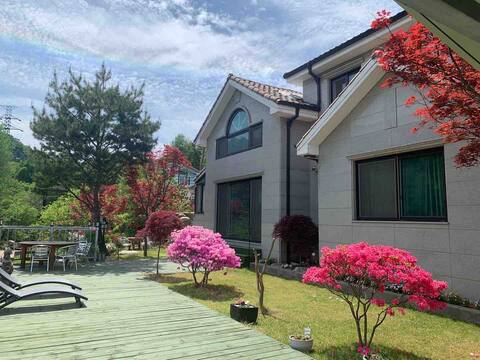
What Do the Top Airbnb Listings in Icheon-ri Look Like?
Benchmark your potential! Explore examples of top-performing Airbnb properties in Icheon-ribased on Trailing Twelve Month (TTM) revenue. Analyze their characteristics, revenue, occupancy rate, and ADR to understand what drives success in this market.
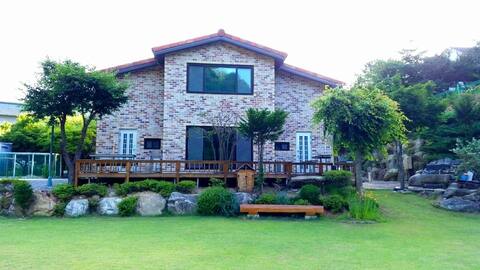
'Damseowon Pension' (Newly-built private house, 40 pyeong)
Entire Place • 3 bedrooms

La Brisa Detached house with private garden # Barbecue # Bonfire # Entertainment machine
Entire Place • 2 bedrooms
Kasa Swiss Pension/Private House/Jokgu Court/Valley/Karaoke/Swiss Village/Fire Pit/Barbecue
Entire Place • 4 bedrooms
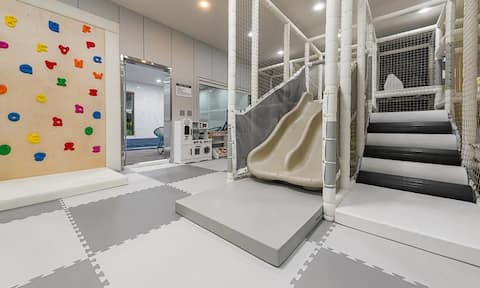
가족들과 함께하는 객실, 키즈 풀빌라 3
Entire Place • 2 bedrooms

지호농원(2층독채펜션/냇가와 넓은잔디마당)
Entire Place • 2 bedrooms
아이들과 함께 하는 소중한 공간
Entire Place • 2 bedrooms
Note: Performance varies based on location, size, amenities, seasonality, and management quality. Data reflects the past 12 months.
Who Are the Top Airbnb Hosts in Icheon-ri?
Learn from the best! This table showcases top-performing Airbnb hosts in Icheon-ri based on the number of properties managed and estimated total revenue over the past year. Analyze their scale and performance metrics.
| Host Name | Properties | Grossing Revenue | Stay Reviews | Avg Rating |
|---|---|---|---|---|
| 숙희 | 1 | $67,733 | 176 | 4.86/5.0 |
| Host #331842977 | 3 | $54,229 | 0 | Not Rated |
| Host #531188870 | 3 | $40,970 | 0 | Not Rated |
| 세원 | 3 | $37,522 | 74 | 4.99/5.0 |
| 두리 | 1 | $27,075 | 352 | 4.96/5.0 |
| 명규 | 1 | $26,030 | 6 | 5.00/5.0 |
| Host #267707708 | 1 | $20,590 | 86 | 4.88/5.0 |
| 정진 | 4 | $10,149 | 48 | 4.56/5.0 |
| Soojung | 1 | $9,413 | 280 | 4.84/5.0 |
| 황지수 | 2 | $8,355 | 145 | 4.84/5.0 |
Analyzing the strategies of top hosts, such as their property selection, pricing, and guest communication, can offer valuable lessons for optimizing your own Airbnb operations in Icheon-ri.
How Does Icheon-ri's Airbnb Market Compare to Nearby Cities?
How does the Icheon-ri Airbnb market stack up against its neighbors? Compare key performance metrics like average monthly revenue, ADR, and occupancy rates in surrounding areas to understand the broader regional STR landscape.
Compared with Wondeok-ri, Icheon-ri has 16 percentage points lower occupancy and about $33 higher ADR. That helps frame whether this market is winning more on demand, pricing, or both.
| Market | Active Properties | Monthly Revenue | Daily Rate | Avg. Occupancy |
|---|---|---|---|---|
| Wondeok-ri | 13 | $2,237 | $202.05 | 38% |
| Seorak-myeon | 11 | $1,842 | $185.73 | 34% |
| Homyeong-ri | 32 | $1,832 | $286.02 | 25% |
| Dojang-ri | 12 | $1,785 | $194.17 | 31% |
| Mugan-ri | 15 | $1,749 | $217.46 | 24% |
| Mitan-myeon | 15 | $1,713 | $232.93 | 27% |
| Seorak | 11 | $1,669 | $205.64 | 29% |
| Gapcheon-myeon | 11 | $1,548 | $145.79 | 37% |
| Yangpyeong-gun | 14 | $1,360 | $246.73 | 27% |
| Seojong | 19 | $1,350 | $193.83 | 25% |
Frequently Asked Questions About Airbnb in Icheon-ri
These quick answers summarize the most common investor and operator questions using AirROI's latest market data for Icheon-ri.
How much do Airbnb hosts make in Icheon-ri?
Icheon-ri hosts earn about $13,386 per year on average, with an average nightly rate of $235 and RevPAR of N/A. Those figures describe the typical revenue environment for active listings in Icheon-ri, Gapyeong-gun, not the ceiling for the best operators. Source: AirROI 2025 data, Icheon-ri market, June 2024 to May 2025.
What is the average Airbnb occupancy rate in Icheon-ri?
The average Airbnb occupancy rate in Icheon-ri is 22.4%. January is the strongest month and June is the softest, so hosts should expect demand to move meaningfully throughout the year rather than stay flat.
What is the average Airbnb daily rate in Icheon-ri?
Listings in Icheon-ri average $235 per night. The broader pricing spread also matters: lower-performing listings cluster closer to the lower quartiles, while premium homes can price materially above the city average when demand spikes or listing quality stands out.
How many Airbnb listings are active in Icheon-ri?
Icheon-ri currently has about 23 active Airbnb listings in AirROI's market dataset. That supply count helps explain how competitive the market is, how much depth there is for benchmarking, and whether the market behaves like a niche destination or a scaled urban market.
How strict are short-term rental regulations in Icheon-ri?
AirROI currently classifies the short-term rental regulation level in Icheon-ri as Moderate. The dataset also shows about 21.7% of listings with registration evidence. That is a market signal, not legal advice, so hosts should still confirm current licensing and compliance rules locally before listing.
What is the RevPAR for Airbnb in Icheon-ri?
RevPAR in Icheon-ri is about N/A. That metric combines pricing and occupancy into one efficiency number, so it is often a better quick benchmark than ADR alone when investors want to compare how well listings convert nightly rates into realized revenue.
Is Airbnb profitable in Icheon-ri?
Occupancy of 22.4% means Icheon-ri is a more selective market. Profitability is achievable but requires careful cost management, premium positioning, or targeting longer stays to reduce turnover. Average annual revenue is $13,386, but individual returns depend on property type, location within the city, and the host's operating efficiency.
How far in advance do guests book Airbnb in Icheon-ri?
The average booking lead time in Icheon-ri is about 22 days — a moderate lead time that gives hosts planning visibility while still benefiting from last-minute bookings. Hosts who understand their market's booking cadence can adjust minimum stays and pricing windows accordingly.
What are the best neighborhoods for Airbnb in Icheon-ri?
Based on AirROI's analysis, some of the top neighborhoods for short-term rentals in Icheon-ri include Chuncheon, Gapyeong, Pocheon. Each area attracts different guest profiles — from business travelers to leisure visitors — so the best location depends on the property type and target audience a host is aiming for. See the full neighborhood breakdown above.
What type of property performs best on Airbnb in Icheon-ri?
entire_home listings make up 82.6% of the active supply in Icheon-ri. The most common configuration does not always mean the most profitable — operators who identify underserved property types or bedroom counts can sometimes outperform the market average by filling a gap in local supply.
How does Icheon-ri compare to nearby Airbnb markets?
Among neighboring markets, Wondeok-ri posts $26,841 in average annual revenue with 37.6% occupancy, compared to Icheon-ri's $13,386 and 22.4%. Comparing nearby markets helps investors understand whether a destination's performance reflects local demand or broader regional trends.
When is the peak season for Airbnb in Icheon-ri?
January is the highest-revenue month in Icheon-ri, while June is the softest. The revenue spread between them indicates moderate seasonality with a clear peak period, giving hosts opportunities to maximize rates during high demand without facing dramatic off-season drops.
About AirROI Market Data
AirROI tracks over 20 million properties across 190+ countries and maintains 15+ years of historical performance data, making it one of the deepest Airbnb and STR intelligence platforms available. The analytics pipeline aggregates listing-level data monthly — revenue, occupancy, nightly rates, RevPAR, guest demographics, booking patterns, and competitive supply — so investors and operators can benchmark any market against its own history and against neighboring destinations.
Real estate investors, property managers, financial institutions, hedge funds, tourism boards, hospitality consultants, tech platforms, and academic researchers rely on AirROI data to underwrite acquisitions, optimize pricing, model macro trends, and conduct peer-reviewed research. Data is available through in-depth market reports like this one and the Airbnb API with 22 endpoints and an Airbnb MCP Server for AI agents.
AirROI proprietary analytics as of 2025-05-31. Metrics reflect trailing twelve-month aggregates from active listings. Revenue figures are market averages, not projections. Neighborhood descriptions are AI-generated and reviewed for accuracy. For full methodology, see the data methodology page.