Ha-ri, North Chungcheong Airbnb Market Data 2025: STR Report & Statistics
How much can you earn on Airbnb in Ha-ri, North Chungcheong? Based on AirROI's 2025 dataset (June 2024 – May 2025), the short answer is $8,765 per year — at a $106 nightly rate, 29.6% occupancy, and a N/A RevPAR.
With just 29 active listings, Ha-ri is a micro-market where selective demand that rewards strong listing quality and pricing strategy. Supply expanded 70.6% as revenue climbed even while nightly rates softened — occupancy gains are outrunning rate pressure. For hosts entering now, strengthening demand means there is still room to build a profitable listing.
Regulation is high, and hosts should factor licensing costs and compliance timelines into their launch plan. In a market this size, differentiated listings with strong reviews can capture outsized returns relative to the competition.

Table of Contents [hide] [show]
What Are the Key Airbnb Metrics in Ha-ri?
In Ha-ri, the headline Airbnb metrics are $8,765 in average annual revenue,29.6% occupancy, $106 ADR, and $0 in RevPAR, and guests book about 20 days in advance.
How Much Do Airbnb Hosts Earn Monthly in Ha-ri?
Understanding the monthly revenue variations for Airbnb listings in Ha-ri is key to maximizing your short term rental income potential. Seasonality significantly impacts earnings. Our analysis, based on data from the past 12 months, shows that the peak revenue month for STRs in Ha-ri is typically August, while November often presents the lowest earnings, highlighting opportunities for strategic pricing adjustments during shoulder and low seasons. Explore the typical Airbnb income in Ha-ri across different performance tiers:
- Best-in-class properties (Top 10%) achieve $1,991+ monthly, often utilizing dynamic pricing and superior guest experiences.
- Strong performing properties (Top 25%) earn $1,563 or more, indicating effective management and desirable locations/amenities.
- Typical properties (Median) generate around $972 per month, representing the average market performance.
- Entry-level properties (Bottom 25%) see earnings around $705, often with potential for optimization.
Average Monthly Airbnb Earnings Trend in Ha-ri
What Is the Monthly Airbnb Occupancy Rate in Ha-ri?
Maximize your bookings by understanding the Ha-ri STR occupancy trends. Seasonal demand shifts significantly influence how often properties are booked. Typically, Augustsees the highest demand (peak season occupancy), while November experiences the lowest (low season). Effective strategies, like adjusting minimum stays or offering promotions, can boost occupancy during slower periods. Here's how different property tiers perform in Ha-ri:
- Best-in-class properties (Top 10%) achieve 51%+ occupancy, indicating high desirability and potentially optimized availability.
- Strong performing properties (Top 25%) maintain 36% or higher occupancy, suggesting good market fit and guest satisfaction.
- Typical properties (Median) have an occupancy rate around 28%.
- Entry-level properties (Bottom 25%) average 22% occupancy, potentially facing higher vacancy.
Average Monthly Occupancy Rate Trend in Ha-ri
What Is the Average Airbnb Nightly Rate in Ha-ri?
Effective short term rental pricing strategy in Ha-ri involves understanding monthly ADR fluctuations. The Average Daily Rate (ADR) for Airbnb in Ha-ri typically peaks in January and dips lowest during October. Leveraging Airbnb dynamic pricing tools or strategies based on this seasonality can significantly boost revenue. Here's a look at the typical nightly rates achieved:
- Best-in-class properties (Top 10%) command rates of $178+ per night, often due to premium features or locations.
- Strong performing properties (Top 25%) achieve nightly rates of $135 or more.
- Typical properties (Median) charge around $98 per night.
- Entry-level properties (Bottom 25%) earn around $69 per night.
Average Daily Rate (ADR) Trend by Month in Ha-ri
What Is the RevPAR for Airbnb in Ha-ri?
RevPAR in Ha-ri is currently N/A. Because RevPAR combines nightly rates with realized occupancy, it is one of the cleanest ways to compare how efficiently listings turn demand into revenue across the market.
- Entry-level properties (Bottom 25%) see N/A RevPAR.
- Typical properties (Median) generate N/A RevPAR.
- Strong performers (Top 25%) earn N/A RevPAR.
- Best-in-class (Top 10%) achieve N/A RevPAR.
Average Monthly RevPAR Trend in Ha-ri
RevPAR Insights for Ha-ri
- RevPAR peaks in Jan and bottoms out in Jan, mirroring the broader seasonal demand pattern and suggesting opportunities for dynamic pricing.
Recommendations for Hosts
- Track your own RevPAR monthly against these Ha-ri benchmarks. If your RevPAR falls below the median of N/A, examine whether low occupancy or low ADR is the primary drag.
- Use RevPAR rather than revenue alone when comparing properties of different sizes — it normalizes for available nights and gives a more accurate picture of performance.
Get Live Ha-ri Market Intelligence 👇
Explore Real-time Analytics
When Is the Peak Season for Airbnb in Ha-ri?
Ha-ri's peak Airbnb season falls in August, May, January, while the softest stretch is February, April, November. Overall, the market shows highly seasonal trends requiring careful strategy, which should guide pricing, minimum stays, and cash-flow planning.
Peak Season (August, May, January)
- Revenue averages $1,660 per month
- Occupancy rates average 40.4%
- Daily rates average $114
Shoulder Season
- Revenue averages $1,094 per month
- Occupancy maintains around 30.0%
- Daily rates hold near $105
Low Season (February, April, November)
- Revenue drops to average $808 per month
- Occupancy decreases to average 23.9%
- Daily rates adjust to average $108
Seasonality Insights for Ha-ri
- Airbnb seasonality in Ha-ri is pronounced. Revenue swings sharply between peak and low months, which means pricing strategy, minimum-stay settings, and cash reserves all need to account for extended slower periods.
- During the high season, the absolute peak month showcases Ha-ri's highest earning potential, with monthly revenues climbing to $2,279, occupancy reaching 50.8%, and ADRs peaking at $118.
- Conversely, the slowest single month marks the market's lowest point — revenue may dip to $605, occupancy could drop to 17.8%, and ADRs may adjust to $102.
- Lower occupancy paired with meaningful seasonality means hosts in Ha-ri need to maximize every peak-season booking and seriously consider whether off-season pricing adjustments or minimum-stay changes can capture incremental revenue.
Seasonal Strategies for Maximizing Profit
- Peak Season: Maximize revenue through premium pricing. In a high-regulation market like Ha-ri, ensure your permit covers the number of nights you plan to book — some jurisdictions cap annual rental days.
- Low Season: Offer competitive pricing, extended-stay discounts, and flexible cancellation policies. Target off-season travelers like remote workers, budget-conscious guests, and travelers with flexible schedules.
- Shoulder Seasons: Implement dynamic pricing that bridges peak and low rates. Target weekend travelers, local events, and business visitors. Slightly more flexible terms than peak season can help maintain occupancy without deep discounting.
- In a highly seasonal market like Ha-ri, building a cash reserve during the top months is essential for covering fixed costs during the slow period. Automated pricing tools can help capture demand shifts in real time.
Do You Need a License for Airbnb in Ha-ri?
Ha-ri, North Chungcheong, South Korea has a high regulation classification, yet only 38% of listings show registration evidence. That gap between regulation on the books and compliance on the ground can shift quickly — municipalities often tighten enforcement in waves, putting unregistered operators at risk of fines or delisting. Always verify the latest short-term rental regulations and Airbnb license requirements directly with local government authorities for Ha-ri to ensure full compliance before hosting.
(Source: AirROI data, 2026, based on 38% licensed listings)
What Are the Best Neighborhoods for Airbnb in Ha-ri?
With a compact short-term rental market, Ha-ri gives early-mover hosts an advantage in the right neighborhoods. The areas listed below are where guest demand and local attractions converge — a useful lens for investors evaluating whether to enter this market and where to position their listing.
| Neighborhood / Area | Why Host Here? (Target Guests & Appeal) | Key Attractions & Landmarks |
|---|---|---|
| Cheongju | The capital of North Chungcheong Province, known for its rich history and cultural sites. Cheongju attracts tourists interested in traditional Korean culture and history, making it a prime location for Airbnb hosting. | Cheongju National Museum, Heungguksa Temple, Sangdangsan Mountain, Cheongju Early Printing Museum, Cheongju Arts Center |
| Daejeon | A nearby metropolitan city with a significant population and many business travelers. Daejeon has a vibrant urban scene and hosts various conferences, attracting visitors year-round. | Daejeon O-World, Hanbat Arboretum, Daejeon Museum of Art, Ttanggeun Railway Park, Yuseong Hot Springs |
| Jincheon | A quieter area known for its natural scenery and outdoor activities. Jincheon is appealing for guests looking for relaxation and nature, which can be attractive for families and solo travelers. | Jincheon Sports Park, Sangseong Fortress, Jincheon National Sports Center, Local hiking trails, Cultural heritage sites |
| Okcheon | A small and peaceful town surrounded by mountains, Okcheon is perfect for travelers wanting to escape the city hustle and enjoy nature. It's a great spot for those seeking tranquility. | Okcheon Seowon, Mount Bulam, Rural farm experiences, Okcheon Hot Springs, Local guesthouses |
| Yeongdong | Famous for its wine production, Yeongdong has wineries and beautiful landscapes, appealing to tourists interested in wine and culinary experiences. | Yeongdong Wine Tunnel, Vineyard tours, Local wineries, Scenic countryside, Culinary festivals |
| Boeun | Known for historic sites and traditional Korean culture, Boeun attracts visitors interested in exploring Korea's philosophy and history. It's a great option for cultural tourism. | Baekje Historic Areas, Deokjusa Temple, Boeun Agricultural and Scenic Development Area, Local traditional markets |
| Samsong-dong | A residential area with easy access to Cheongju and surrounding attractions. Preferred for its peaceful environment while being close to urban conveniences. | Parks and recreational areas, Local eateries, Community cultural events, Proximity to Cheongju |
| Mungyeong | Famous for its historical and natural attractions, Mungyeong is ideal for hikers and history enthusiasts. Guests can enjoy its beautiful mountains and preserved heritage. | Mungyeong Saejae Provincial Park, Historic alleyways, Mungyeong Traditional Market, Guryeongsa Temple, Natural hiking trails |
Because Ha-ri has a high regulation profile, confirming that short-term rental permits are available in your target neighborhood is a critical first step before committing to a property purchase. Regulation can vary at the neighborhood or district level even within the same city.
What Types of Properties Are on Airbnb in Ha-ri?
Room Type Distribution
Property Type Distribution
Market Composition Insights for Ha-ri
- The Ha-ri Airbnb market composition is heavily skewed towards Entire Home/Apt listings, which make up 100% of the 29 active rentals. This indicates strong guest preference for privacy and space.
- Looking at the property type distribution in Ha-ri, Hotel/Boutique properties are the most common (93.1%), reflecting the local real estate landscape.
- The presence of 93.1% Hotel/Boutique listings indicates integration with traditional hospitality.
Ha-ri Airbnb Room Capacity Analysis (2026): Bedroom Distribution
Distribution of Listings by Number of Bedrooms
Room Capacity Insights for Ha-ri
- The dominant room capacity in Ha-ri is 1 bedroom listings, making up 51.7% of the market. This suggests a strong demand for properties suitable for couples or solo travelers.
- Together, 1 bedroom and 2 bedrooms properties represent 93.1% of the active Airbnb listings in Ha-ri, indicating a high concentration in these sizes.
- With over half the market (51.7%) consisting of studios or 1-bedroom units, Ha-ri is particularly well-suited for individuals or couples.
Ha-ri Vacation Rental Guest Capacity Trends (2026)
Distribution of Listings by Guest Capacity
Guest Capacity Insights for Ha-ri
- The most common guest capacity trend in Ha-ri vacation rentals is listings accommodating 2 guests (44.8%). This suggests the primary traveler segment is likely couples or solo travelers.
- Properties designed for 2 guests and 4 guests dominate the Ha-ri STR market, accounting for 65.5% of listings.
- A significant 44.8% of listings cater specifically to 1-2 guests, highlighting strong demand from couples and solo travelers in Ha-ri.
- 17.2% of properties accommodate 6+ guests, serving the market segment for larger families or group travel in Ha-ri.
- On average, properties in Ha-ri are equipped to host 3.4 guests.
What Amenities Do Airbnb Guests Expect in Ha-ri?
Amenity Prevalence
No amenities with partial availability (less than 100%) were found to display in the chart. All essential amenities might be present in all listings. Check insights below.
Amenity Insights for Ha-ri
- Essential amenities in Ha-ri that guests expect include: Heating, Bed linens, Essentials, Hair dryer, TV, Wifi, Free parking on premises, Shampoo, Hot water, Fire extinguisher. Lacking these (any) could significantly impact bookings.
Recommendations for Hosts
- Ensure your listing includes all essential amenities for Ha-ri: Heating, Bed linens, Essentials, Hair dryer, TV, Wifi, Free parking on premises, Shampoo, Hot water, Fire extinguisher.
- Highlight unique or less common amenities you offer (e.g., hot tub, dedicated workspace, EV charger) in your listing description and photos.
- Regularly check competitor amenities in Ha-ri to stay competitive.
Dive Deeper: Advanced Ha-ri STR Market Data (2026)
Ready to unlock more insights? AirROI provides access to advanced metrics and comprehensive Airbnb data for Ha-ri. Explore detailed analytics beyond this report to refine your investment strategy, optimize pricing, and maximize your vacation rental profits.
Explore Advanced MetricsHa-ri Airbnb Guest Demographics & Profile Analysis (2026)
Guest Profile Summary for Ha-ri
- The typical guest profile for Airbnb in Ha-ri consists of primarily domestic travelers (90%), often arriving from nearby Seoul, typically belonging to the Post-2000s (Gen Z/Alpha) group (50%), primarily speaking Korean or English.
- Domestic travelers account for 90.0% of guests.
- Key international markets include South Korea (90%) and Italy (2.2%).
- Top languages spoken are Korean (56.9%) followed by English (27.7%).
- A significant demographic segment is the Post-2000s (Gen Z/Alpha) group, representing 50% of guests.
Recommendations for Hosts
- Target domestic marketing efforts towards travelers from Seoul and Yongin-si.
- Tailor amenities and listing descriptions to appeal to the dominant Post-2000s (Gen Z/Alpha) demographic (e.g., highlight fast WiFi, smart home features, local guides).
- Highlight unique local experiences or amenities relevant to the primary guest profile.
- Consider seasonal promotions aligned with peak travel times for key origin markets.
Ha-ri Airbnb Booking Patterns (2026): Available vs. Booked Days
Available Days Distribution
Booked Days Distribution
Booking Pattern Insights for Ha-ri
- The most common availability pattern in Ha-ri falls within the 271-366 days range, representing 89.7% of listings. This suggests many properties have significant open periods on their calendars.
- Approximately 100.0% of listings show high availability (181+ days open annually), indicating potential for increased bookings or specific owner usage patterns.
- For booked days, the 31-90 days range is most frequent in Ha-ri (86.2%), reflecting common guest stay durations or potential owner blocking patterns.
How Far in Advance Do Guests Book Airbnb in Ha-ri?
Average Booking Lead Time by Month
Booking Lead Time Insights for Ha-ri
- The overall average booking lead time for vacation rentals in Ha-ri is 20 days.
- Guests book furthest in advance for stays during May (average 43 days), likely coinciding with peak travel demand or local events.
- The shortest booking windows occur for stays in July (average 7 days), indicating more last-minute travel plans during this time.
- Seasonally, Spring (27 days avg.) sees the longest lead times, while Summer (15 days avg.) has the shortest, reflecting typical travel planning cycles.
Recommendations for Hosts
- Use the overall average lead time (20 days) as a baseline for your pricing and availability strategy in Ha-ri.
- For May stays, consider implementing length-of-stay discounts or slightly higher rates for bookings made less than 43 days out to capitalize on advance planning.
- During July, focus on last-minute booking availability and promotions, as guests book with very short notice (7 days avg.).
- Target marketing efforts for the Spring season well in advance (at least 27 days) to capture early planners.
- Monitor your own booking lead times against these Ha-ri averages to identify opportunities for dynamic pricing adjustments.
Ha-ri Airbnb Minimum Stay Requirements Analysis
Distribution of Listings by Minimum Night Requirement
1 Night
29 listings
100% of total
Key Insights
- The most prevalent minimum stay requirement in Ha-ri is 1 Night, adopted by 100% of listings. This highlights the market's preference for shorter, flexible bookings.
- A strong majority (100.0%) of the Ha-ri Airbnb data shows acceptance of very short stays (1-2 nights), indicating a dynamic, high-turnover market.
Recommendations
- Align with the market by considering a 1 Night minimum stay, as 100% of Ha-ri hosts use this setting.
- Adjust minimum nights based on seasonality – potentially shorter during low season and longer during peak demand periods in Ha-ri.
Ha-ri Airbnb Cancellation Policy Trends Analysis (2026)
Moderate
20 listings
87% of total
Firm
3 listings
13% of total
Cancellation Policy Insights for Ha-ri
- The prevailing Airbnb cancellation policy trend in Ha-ri is Moderate, used by 87% of listings.
- The market strongly favors guest-friendly terms, with 87.0% of listings offering Flexible or Moderate policies. This suggests guests in Ha-ri may expect booking flexibility.
Recommendations for Hosts
- Consider adopting a Moderate policy to align with the 87% market standard in Ha-ri.
- Regularly review your cancellation policy against competitors and market demand shifts in Ha-ri.
What Do the Top Airbnb Listings in Ha-ri Look Like?
Benchmark your potential! Explore examples of top-performing Airbnb properties in Ha-ribased on Trailing Twelve Month (TTM) revenue. Analyze their characteristics, revenue, occupancy rate, and ADR to understand what drives success in this market.

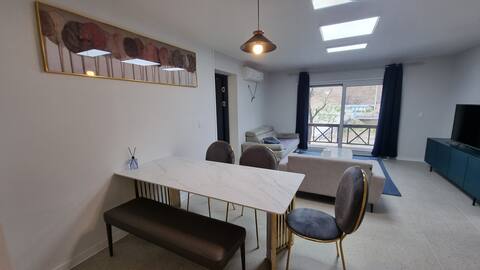
3. Mokhyang Pension Private Lodging 201
Entire Place • 2 bedrooms
Luxury interior room in front of a cool valley
Entire Place • 2 bedrooms

Luxury interior room in front of the cool valley
Entire Place • 1 bedroom
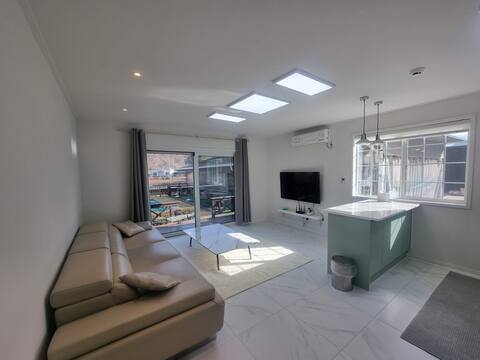
2. Mokhyang Pension (Room 102)
Entire Place • 2 bedrooms
시원한 계곡 앞에 위치한 고급인테리어 객실
Entire Place • 2 bedrooms
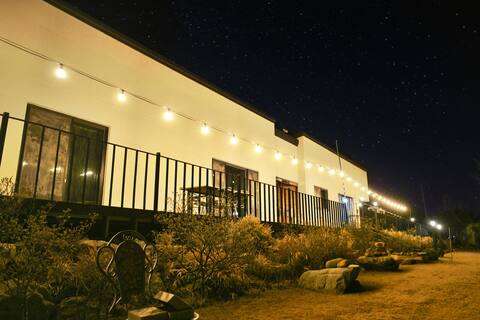
![Mananjae [Healing Center Full of Comfort]](https://a0.muscache.com/im/pictures/hosting/Hosting-U3RheVN1cHBseUxpc3Rpbmc6OTcyNTQ0MzM2MjE0NTE2Nzcx/original/0e18b568-0ad2-4e6e-af5e-25b79d24f236.jpeg?im_w=480&im_format=avif)
Mananjae [Healing Center Full of Comfort]
Entire Place • 2 bedrooms
Note: Performance varies based on location, size, amenities, seasonality, and management quality. Data reflects the past 12 months.
Who Are the Top Airbnb Hosts in Ha-ri?
Learn from the best! This table showcases top-performing Airbnb hosts in Ha-ri based on the number of properties managed and estimated total revenue over the past year. Analyze their scale and performance metrics.
| Host Name | Properties | Grossing Revenue | Stay Reviews | Avg Rating |
|---|---|---|---|---|
| Onda | 9 | $92,688 | 4 | 5.00/5.0 |
| Onda | 13 | $81,597 | 6 | 5.00/5.0 |
| 원돈 | 4 | $54,353 | 260 | 4.94/5.0 |
| 낙봉 | 3 | $25,536 | 163 | 4.96/5.0 |
Analyzing the strategies of top hosts, such as their property selection, pricing, and guest communication, can offer valuable lessons for optimizing your own Airbnb operations in Ha-ri.
How Does Ha-ri's Airbnb Market Compare to Nearby Cities?
How does the Ha-ri Airbnb market stack up against its neighbors? Compare key performance metrics like average monthly revenue, ADR, and occupancy rates in surrounding areas to understand the broader regional STR landscape.
Compared with Wondeok-ri, Ha-ri has 8 percentage points lower occupancy and about $96 lower ADR. That helps frame whether this market is winning more on demand, pricing, or both.
| Market | Active Properties | Monthly Revenue | Daily Rate | Avg. Occupancy |
|---|---|---|---|---|
| Wondeok-ri | 13 | $2,237 | $202.05 | 38% |
| Seorak-myeon | 11 | $1,842 | $185.73 | 34% |
| Homyeong-ri | 32 | $1,832 | $286.02 | 25% |
| Dojang-ri | 12 | $1,785 | $194.17 | 31% |
| Mugan-ri | 15 | $1,749 | $217.46 | 24% |
| Mitan-myeon | 15 | $1,713 | $232.93 | 27% |
| Seorak | 11 | $1,669 | $205.64 | 29% |
| Gapcheon-myeon | 11 | $1,548 | $145.79 | 37% |
| Yangpyeong-gun | 14 | $1,360 | $246.73 | 27% |
| Seojong | 19 | $1,350 | $193.83 | 25% |
Frequently Asked Questions About Airbnb in Ha-ri
These quick answers summarize the most common investor and operator questions using AirROI's latest market data for Ha-ri.
How much do Airbnb hosts make in Ha-ri?
Ha-ri hosts earn about $8,765 per year on average, with an average nightly rate of $106 and RevPAR of N/A. Those figures describe the typical revenue environment for active listings in Ha-ri, North Chungcheong, not the ceiling for the best operators. Source: AirROI 2025 data, Ha-ri market, June 2024 to May 2025.
What is the average Airbnb occupancy rate in Ha-ri?
The average Airbnb occupancy rate in Ha-ri is 29.6%. August is the strongest month and November is the softest, so hosts should expect demand to move meaningfully throughout the year rather than stay flat.
What is the average Airbnb daily rate in Ha-ri?
Listings in Ha-ri average $106 per night. The broader pricing spread also matters: lower-performing listings cluster closer to the lower quartiles, while premium homes can price materially above the city average when demand spikes or listing quality stands out.
How many Airbnb listings are active in Ha-ri?
Ha-ri currently has about 29 active Airbnb listings in AirROI's market dataset. That supply count helps explain how competitive the market is, how much depth there is for benchmarking, and whether the market behaves like a niche destination or a scaled urban market.
How strict are short-term rental regulations in Ha-ri?
AirROI currently classifies the short-term rental regulation level in Ha-ri as High. The dataset also shows about 37.9% of listings with registration evidence. That is a market signal, not legal advice, so hosts should still confirm current licensing and compliance rules locally before listing.
What is the RevPAR for Airbnb in Ha-ri?
RevPAR in Ha-ri is about N/A. That metric combines pricing and occupancy into one efficiency number, so it is often a better quick benchmark than ADR alone when investors want to compare how well listings convert nightly rates into realized revenue.
Is Airbnb profitable in Ha-ri?
Occupancy of 29.6% means Ha-ri is a more selective market. Profitability is achievable but requires careful cost management, premium positioning, or targeting longer stays to reduce turnover. Average annual revenue is $8,765, but individual returns depend on property type, location within the city, and the host's operating efficiency.
How far in advance do guests book Airbnb in Ha-ri?
The average booking lead time in Ha-ri is about 20 days — a relatively short booking window, meaning most guests decide within a few weeks of their trip — dynamic pricing can capture late demand. Hosts who understand their market's booking cadence can adjust minimum stays and pricing windows accordingly.
What are the best neighborhoods for Airbnb in Ha-ri?
Based on AirROI's analysis, some of the top neighborhoods for short-term rentals in Ha-ri include Cheongju, Daejeon, Jincheon. Each area attracts different guest profiles — from business travelers to leisure visitors — so the best location depends on the property type and target audience a host is aiming for. See the full neighborhood breakdown above.
What type of property performs best on Airbnb in Ha-ri?
entire_home listings make up 100.0% of the active supply in Ha-ri. The most common configuration does not always mean the most profitable — operators who identify underserved property types or bedroom counts can sometimes outperform the market average by filling a gap in local supply.
How does Ha-ri compare to nearby Airbnb markets?
Among neighboring markets, Wondeok-ri posts $26,841 in average annual revenue with 37.6% occupancy, compared to Ha-ri's $8,765 and 29.6%. Comparing nearby markets helps investors understand whether a destination's performance reflects local demand or broader regional trends.
When is the peak season for Airbnb in Ha-ri?
August is the highest-revenue month in Ha-ri, while November is the softest. The revenue spread between them indicates a highly seasonal market — revenue in the peak month is more than double the low month, so cash-flow planning and pricing automation are critical.
About AirROI Market Data
AirROI tracks over 20 million properties across 190+ countries and maintains 15+ years of historical performance data, making it one of the deepest Airbnb and STR intelligence platforms available. The analytics pipeline aggregates listing-level data monthly — revenue, occupancy, nightly rates, RevPAR, guest demographics, booking patterns, and competitive supply — so investors and operators can benchmark any market against its own history and against neighboring destinations.
Real estate investors, property managers, financial institutions, hedge funds, tourism boards, hospitality consultants, tech platforms, and academic researchers rely on AirROI data to underwrite acquisitions, optimize pricing, model macro trends, and conduct peer-reviewed research. Data is available through in-depth market reports like this one and the Airbnb API with 22 endpoints and an Airbnb MCP Server for AI agents.
AirROI proprietary analytics as of 2025-05-31. Metrics reflect trailing twelve-month aggregates from active listings. Revenue figures are market averages, not projections. Neighborhood descriptions are AI-generated and reviewed for accuracy. For full methodology, see the data methodology page.