Manacor, Balearic Islands Airbnb Market Data 2026: STR Report & Statistics
How much can you earn on Airbnb in Manacor, Balearic Islands? Based on AirROI's 2026 dataset (July 2025 – June 2026), the short answer is $41,911 per year — at a $524 nightly rate, 44.8% occupancy, and a $232 RevPAR that reflects moderate rate-to-revenue efficiency with room to optimize.
Manacor's 215 active listings and moderate demand with room for well-positioned listings to outperform position it as a midsize vacation rental market. Supply has held steady while nightly rates moved higher — a market where hosts who optimize for bookability can unlock the full value of rising rates. Balancing rate strategy with occupancy is the key lever, and hosts who get it right will outperform.
Regulation is high and 91% of listings show active registration — compliance is the cost of entry. For data-driven hosts, the opportunity lies in reading these signals and positioning accordingly.

Table of Contents [hide] [show]
What Are the Key Airbnb Metrics in Manacor?
In Manacor, the headline Airbnb metrics are $41,911 in average annual revenue,44.8% occupancy, $524 ADR, and $232 in RevPAR, and guests book about 108 days in advance.
How Much Do Airbnb Hosts Earn Monthly in Manacor?
Understanding the monthly revenue variations for Airbnb listings in Manacor is key to maximizing your short term rental income potential. Seasonality significantly impacts earnings. Our analysis, based on data from the past 12 months, shows that the peak revenue month for STRs in Manacor is typically July, while January often presents the lowest earnings, highlighting opportunities for strategic pricing adjustments during shoulder and low seasons. Explore the typical Airbnb income in Manacor across different performance tiers:
- Best-in-class properties (Top 10%) achieve $13,541+ monthly, often utilizing dynamic pricing and superior guest experiences.
- Strong performing properties (Top 25%) earn $6,943 or more, indicating effective management and desirable locations/amenities.
- Typical properties (Median) generate around $3,439 per month, representing the average market performance.
- Entry-level properties (Bottom 25%) see earnings around $1,794, often with potential for optimization.
Average Monthly Airbnb Earnings Trend in Manacor
What Is the Monthly Airbnb Occupancy Rate in Manacor?
Maximize your bookings by understanding the Manacor STR occupancy trends. Seasonal demand shifts significantly influence how often properties are booked. Typically, Augustsees the highest demand (peak season occupancy), while January experiences the lowest (low season). Effective strategies, like adjusting minimum stays or offering promotions, can boost occupancy during slower periods. Here's how different property tiers perform in Manacor:
- Best-in-class properties (Top 10%) achieve 78%+ occupancy, indicating high desirability and potentially optimized availability.
- Strong performing properties (Top 25%) maintain 60% or higher occupancy, suggesting good market fit and guest satisfaction.
- Typical properties (Median) have an occupancy rate around 40%.
- Entry-level properties (Bottom 25%) average 21% occupancy, potentially facing higher vacancy.
Average Monthly Occupancy Rate Trend in Manacor
What Is the Average Airbnb Nightly Rate in Manacor?
Effective short term rental pricing strategy in Manacor involves understanding monthly ADR fluctuations. The Average Daily Rate (ADR) for Airbnb in Manacor typically peaks in June and dips lowest during November. Leveraging Airbnb dynamic pricing tools or strategies based on this seasonality can significantly boost revenue. Here's a look at the typical nightly rates achieved:
- Best-in-class properties (Top 10%) command rates of $1,268+ per night, often due to premium features or locations.
- Strong performing properties (Top 25%) achieve nightly rates of $548 or more.
- Typical properties (Median) charge around $316 per night.
- Entry-level properties (Bottom 25%) earn around $189 per night.
Average Daily Rate (ADR) Trend by Month in Manacor
What Is the RevPAR for Airbnb in Manacor?
RevPAR in Manacor is currently $232. Because RevPAR combines nightly rates with realized occupancy, it is one of the cleanest ways to compare how efficiently listings turn demand into revenue across the market.
- Entry-level properties (Bottom 25%) see $80 RevPAR.
- Typical properties (Median) generate $156 RevPAR.
- Strong performers (Top 25%) earn $278 RevPAR.
- Best-in-class (Top 10%) achieve $529 RevPAR.
Average Monthly RevPAR Trend in Manacor
RevPAR Insights for Manacor
- The average RevPAR in Manacor is $232. This metric combines nightly rates with realized occupancy, making it one of the best single-number indicators of market efficiency.
- The gap between the top 10% ($529) and bottom 25% ($80) is $450, indicating significant performance disparity driven by property quality, pricing strategy, and location.
- RevPAR peaks in Jul and bottoms out in Jan, mirroring the broader seasonal demand pattern and suggesting opportunities for dynamic pricing.
Recommendations for Hosts
- Track your own RevPAR monthly against these Manacor benchmarks. If your RevPAR falls below the median of $156, examine whether low occupancy or low ADR is the primary drag.
- Top-quartile listings achieve $278+ RevPAR through a combination of competitive pricing, strong reviews, and strategic amenities. Target this tier through incremental improvements.
- Use RevPAR rather than revenue alone when comparing properties of different sizes — it normalizes for available nights and gives a more accurate picture of performance.
Get Live Manacor Market Intelligence 👇
Explore Real-time Analytics
When Is the Peak Season for Airbnb in Manacor?
Manacor's peak Airbnb season falls in July, August, September, while the softest stretch is January, February, November. Overall, the market shows highly seasonal trends requiring careful strategy, which should guide pricing, minimum stays, and cash-flow planning.
Peak Season (July, August, September)
- Revenue averages $10,396 per month
- Occupancy rates average 64.2%
- Daily rates average $612
Shoulder Season
- Revenue averages $5,474 per month
- Occupancy maintains around 37.7%
- Daily rates hold near $561
Low Season (January, February, November)
- Revenue drops to average $2,779 per month
- Occupancy decreases to average 29.8%
- Daily rates adjust to average $512
Seasonality Insights for Manacor
- Airbnb seasonality in Manacor is pronounced. Revenue swings sharply between peak and low months, which means pricing strategy, minimum-stay settings, and cash reserves all need to account for extended slower periods.
- During the high season, the absolute peak month showcases Manacor's highest earning potential, with monthly revenues climbing to $11,680, occupancy reaching 68.3%, and ADRs peaking at $656.
- Conversely, the slowest single month marks the market's lowest point — revenue may dip to $2,067, occupancy could drop to 19.5%, and ADRs may adjust to $500.
- Understanding both the seasonal averages and these monthly peaks and troughs in revenue, occupancy, and ADR is crucial for maximizing your Airbnb profit potential in Manacor.
Seasonal Strategies for Maximizing Profit
- Peak Season: Maximize revenue through premium pricing. In a high-regulation market like Manacor, ensure your permit covers the number of nights you plan to book — some jurisdictions cap annual rental days.
- Low Season: Offer competitive pricing, extended-stay discounts, and flexible cancellation policies. Target off-season travelers like remote workers, budget-conscious guests, and travelers with flexible schedules.
- Shoulder Seasons: Implement dynamic pricing that bridges peak and low rates. Target weekend travelers, local events, and business visitors. Slightly more flexible terms than peak season can help maintain occupancy without deep discounting.
- In a highly seasonal market like Manacor, building a cash reserve during the top months is essential for covering fixed costs during the slow period. Automated pricing tools can help capture demand shifts in real time.
Do You Need a License for Airbnb in Manacor?
Yes, Manacor, Balearic Islands, Spain enforces high STR regulations and 91% of active listings show registration evidence — indicating that enforcement is active and compliance is a prerequisite for operating legally. Hosts entering this market should budget for permit fees, inspections, and potential occupancy tax obligations as part of their startup costs. Always verify the latest short-term rental regulations and Airbnb license requirements directly with local government authorities for Manacor to ensure full compliance before hosting.
(Source: AirROI data, 2026, based on 91% licensed listings)
What Are the Best Neighborhoods for Airbnb in Manacor?
Location within Manacor matters. Even in a midsize market, the difference between neighborhoods can mean a material gap in occupancy, nightly rate, and overall Airbnb revenue. Below are 8 areas where short-term rental activity and guest interest are concentrated — along with the reasons each neighborhood appeals to travelers.
| Neighborhood / Area | Why Host Here? (Target Guests & Appeal) | Key Attractions & Landmarks |
|---|---|---|
| Porto Cristo | Famous for its stunning beaches and the nearby Cuevas del Drac, a set of impressive caves. A prime destination for families and beach lovers looking for a picturesque getaway. | Cuevas del Drac, Cala Pilota, Porto Cristo beach, Cala Egos, Esposende, Aquarium of Cap Rocat |
| Cala Millor | A popular tourist destination known for its long sandy beach and a lively promenade filled with shops and eateries. Ideal for attracting families and tourists seeking relaxation and entertainment. | Cala Millor Beach, Safari Zoo, Cala Bona marina, Punta de n'Amer, Sierra de Tramuntana, Golf Son Servera |
| Manacor city center | The cultural and historic heart of Manacor, known for its charming streets and local markets. Great for travelers interested in local cuisine and culture. | Manacor's town square, Church of Our Lady of Sorrows, Manacor's weekly market, Casa de Cultura, Ronda del Racó |
| Son Severa | A quieter area known for its rustic charm and beautiful countryside. Ideal for guests looking for a peaceful retreat while still being close to the attractions. | Son Severa's countryside, Local hiking trails, Traditional stone houses, Nearby vineyards |
| Sa Coma | A family-friendly beach resort known for its shallow waters and beach facilities, perfect for families with children and novice swimmers. | Sa Coma beach, Safari Zoo, Cala de Sa Coma, Hiking trails Encine, Minigolf Sa Coma |
| Sillot | Located near larger resorts, Sillot offers a more serene beach environment with easy access to nightlife and dining options in nearby locations. | Sillot beach, Cala Morlanda, Partida de n'Amer, Bar and restaurants nearby |
| Cala Ratjada | A picturesque fishing port and tourist resort with beautiful beaches and vibrant nightlife. Attracts a younger crowd looking to enjoy beach life and nightlife. | Cala Agulla, Cala Gat, Nightclubs and bars, Local seafood restaurants, Hiking trails |
| Costa de los Pinos | An upscale area known for its luxury villas and peaceful beaches. Appeals to those looking for a more exclusive vacation experience with stunning sea views. | Costa de los Pinos beach, Can Simó beach, Golf club nearby, Luxury restaurants |
Because Manacor has a high regulation profile, confirming that short-term rental permits are available in your target neighborhood is a critical first step before committing to a property purchase. Regulation can vary at the neighborhood or district level even within the same city.
What Types of Properties Are on Airbnb in Manacor?
Room Type Distribution
Property Type Distribution
Market Composition Insights for Manacor
- The Manacor Airbnb market composition is heavily skewed towards Entire Home/Apt listings, which make up 90.7% of the 215 active rentals. This indicates strong guest preference for privacy and space.
- Looking at the property type distribution in Manacor, House properties are the most common (79.5%), reflecting the local real estate landscape.
- Houses represent a significant 79.5% portion, catering likely to families or larger groups.
- Smaller segments like hotel/boutique, outdoor/unique, unique stays (combined 7.0%) offer potential for unique stay experiences.
Manacor Airbnb Room Capacity Analysis (2026): Bedroom Distribution
Distribution of Listings by Number of Bedrooms
Room Capacity Insights for Manacor
- The dominant room capacity in Manacor is 3 bedrooms listings, making up 29.8% of the market. This suggests a strong demand for properties suitable for families or small groups.
- Together, 3 bedrooms and 4 bedrooms properties represent 48.9% of the active Airbnb listings in Manacor, indicating a high concentration in these sizes.
- A significant 65.2% of listings offer 3+ bedrooms, catering to larger groups and families seeking more space in Manacor.
Manacor Vacation Rental Guest Capacity Trends (2026)
Distribution of Listings by Guest Capacity
Guest Capacity Insights for Manacor
- The most common guest capacity trend in Manacor vacation rentals is listings accommodating 8+ guests (30.7%). This suggests the primary traveler segment is likely larger groups.
- Properties designed for 8+ guests and 6 guests dominate the Manacor STR market, accounting for 57.7% of listings.
- 59.6% of properties accommodate 6+ guests, serving the market segment for larger families or group travel in Manacor.
- On average, properties in Manacor are equipped to host 5.3 guests.
How Do Listings in Manacor Compare on Quality?
Listing quality in Manacor can be approximated through presentation depth, bedroom count, and how often hosts disclose exact locations. These signals show how professionally the local supply base is merchandised.
Listing Quality Insights for Manacor
- At 34.9 photos per listing on average, Manacor hosts invest well in visual presentation. Listings with 20+ photos consistently outperform in search ranking and conversion.
- 22.8% of listings show their exact location. Lower disclosure rates can increase booking hesitation — guests want to know exactly where they are staying.
Recommendations for Hosts
- Enable exact location if possible — it removes a common source of guest uncertainty and can improve your listing's position in map-based searches.
- Use these quality indicators as a self-audit checklist. Listings that exceed the Manacor averages across all three metrics are better positioned for premium pricing.
What Amenities Do Airbnb Guests Expect in Manacor?
Amenity Prevalence
Amenity Insights for Manacor
- Essential amenities in Manacor that guests expect include: Wifi, Kitchen. Lacking these (any) could significantly impact bookings.
- Popular amenities like Washer, TV, Dishes and silverware are common but not universal. Offering these can provide a competitive edge.
Recommendations for Hosts
- Ensure your listing includes all essential amenities for Manacor: Wifi, Kitchen.
- Prioritize adding missing essentials: Wifi, Kitchen.
- Consider adding popular differentiators like Washer or TV to increase appeal.
- Highlight unique or less common amenities you offer (e.g., hot tub, dedicated workspace, EV charger) in your listing description and photos.
- Regularly check competitor amenities in Manacor to stay competitive.
Which Airbnb Amenities Boost Revenue in Manacor?
Not every amenity matters equally. This table focuses on the amenities most associated with higher revenue in Manacor, which makes it more useful for prioritizing upgrades than a simple popularity list alone.
| Amenity | Prevalence | Revenue With | Revenue Without | Revenue Uplift |
|---|---|---|---|---|
Washer | 91.2% | $44,522 | $14,977 | 197.3% |
Iron | 82.3% | $47,025 | $18,094 | 159.9% |
Blender | 26.5% | $74,478 | $30,163 | 146.9% |
Hair dryer | 84.7% | $45,842 | $20,236 | 126.5% |
Oven | 78.6% | $47,483 | $21,441 | 121.5% |
Dishwasher | 77.7% | $47,718 | $21,708 | 119.8% |
High chair | 63.7% | $52,119 | $23,982 | 117.3% |
Bed linens | 82.8% | $46,127 | $21,630 | 113.3% |
Coffee maker | 88.8% | $44,526 | $21,104 | 111.0% |
Portable fans | 29.8% | $64,745 | $32,234 | 100.9% |
Revenue Impact Insights for Manacor
- Washer tops the revenue impact list with a 197.3% uplift — listings with this amenity earn $44,522 vs. $14,977 without it.
- Washer, Iron, Hair dryer, Bed linens, Coffee maker — while widespread — still correlate with meaningful revenue gains, making them table stakes rather than true differentiators.
Recommendations for Hosts
- Focus your upgrade budget on amenities in the top half of this table. Below-median amenities may improve guest experience but contribute less to revenue growth.
- Highlight revenue-impacting amenities prominently in your listing title, photos, and description — guests can't value what they don't notice.
Dive Deeper: Advanced Manacor STR Market Data (2026)
Ready to unlock more insights? AirROI provides access to advanced metrics and comprehensive Airbnb data for Manacor. Explore detailed analytics beyond this report to refine your investment strategy, optimize pricing, and maximize your vacation rental profits.
Explore Advanced MetricsManacor Airbnb Guest Demographics & Profile Analysis (2026)
Guest Profile Summary for Manacor
- The typical guest profile for Airbnb in Manacor consists of predominantly international visitors (94%), with top international origins including France, typically belonging to the Post-2000s (Gen Z/Alpha) group (50%), primarily speaking English or German.
- Domestic travelers account for 5.9% of guests.
- Key international markets include Germany (42%) and France (12.1%).
- Top languages spoken are English (38.9%) followed by German (23.7%).
- A significant demographic segment is the Post-2000s (Gen Z/Alpha) group, representing 50% of guests.
Recommendations for Hosts
- Focus marketing internationally, particularly towards travelers from France.
- Tailor amenities and listing descriptions to appeal to the dominant Post-2000s (Gen Z/Alpha) demographic (e.g., highlight fast WiFi, smart home features, local guides).
- Highlight unique local experiences or amenities relevant to the primary guest profile.
- Consider seasonal promotions aligned with peak travel times for key origin markets.
What Are Airbnb Guest Ratings in Manacor?
Listings in Manacor average 4.76 out of 5 overall, with about 27 reviews per active listing and 23.3% of listings carrying the Guest Favorite badge.
Rating Breakdown by Category
Guest Rating Insights for Manacor
- An average rating of 4.76 places Manacor in solid territory. Most guests leave satisfied, though there is room for hosts to push toward the top tier.
- The strongest subcategory is Communication (4.83), while Value (4.65) trails behind — a useful signal for hosts looking to prioritize upgrades.
- 23.3% of listings carry the Guest Favorite badge, a strong trust signal that can meaningfully lift click-through and booking rates.
Recommendations for Hosts
- Focus improvement efforts on Value — even small gains in the weakest subcategory can lift overall ratings and search ranking.
- Encourage guests to leave reviews after checkout. Listings with more reviews rank higher in search results and convert browsers into bookers more effectively.
- With only 23.3% of listings earning Guest Favorite status, hosts who consistently exceed expectations have a clear competitive advantage.
Manacor Airbnb Booking Patterns (2026): Available vs. Booked Days
Available Days Distribution
Booked Days Distribution
Booking Pattern Insights for Manacor
- The most common availability pattern in Manacor falls within the 271-366 days range, representing 53% of listings. This suggests many properties have significant open periods on their calendars.
- Approximately 91.1% of listings show high availability (181+ days open annually), indicating potential for increased bookings or specific owner usage patterns.
- For booked days, the 91-180 days range is most frequent in Manacor (39.5%), reflecting common guest stay durations or potential owner blocking patterns.
- A notable 8.9% of properties secure long booking periods (181+ days booked per year), highlighting successful long-term rental strategies or significant owner usage.
How Far in Advance Do Guests Book Airbnb in Manacor?
Average Booking Lead Time by Month
Booking Lead Time Insights for Manacor
- The overall average booking lead time for vacation rentals in Manacor is 108 days.
- Guests book furthest in advance for stays during August (average 129 days), likely coinciding with peak travel demand or local events.
- The shortest booking windows occur for stays in January (average 47 days), indicating more last-minute travel plans during this time.
- Seasonally, Summer (119 days avg.) sees the longest lead times, while Winter (61 days avg.) has the shortest, reflecting typical travel planning cycles.
Recommendations for Hosts
- Use the overall average lead time (108 days) as a baseline for your pricing and availability strategy in Manacor.
- For August stays, consider implementing length-of-stay discounts or slightly higher rates for bookings made less than 129 days out to capitalize on advance planning.
- Target marketing efforts for the Summer season well in advance (at least 119 days) to capture early planners.
- Monitor your own booking lead times against these Manacor averages to identify opportunities for dynamic pricing adjustments.
What Is the Average Length of Stay for Airbnb in Manacor?
Guests in Manacor stay about 7.3 nights on average, generating roughly 2,886 reservations and 13.4 bookings per listing in the latest AirROI dataset. The most common check-in time is 4:00 PM and check-out is 10:00 AM.
Monthly Length of Stay in Manacor
Check-in Time Distribution
Check-out Time Distribution
Stay Pattern Insights for Manacor
- Longer stays mean fewer turnovers and lower cleaning costs per revenue dollar. This pattern also opens the door to monthly discount strategies that attract remote workers and extended-stay travelers.
- 13.4 bookings per listing is a manageable pace that balances revenue with operational overhead.
- Stay lengths peak in Jul (7.8 nights) and shorten in May (5.1 nights). Adjust minimum-night requirements seasonally to match.
Recommendations for Hosts
- Leverage the longer-stay pattern by offering weekly discounts — even 5-10% off can convert browsing into bookings for guests considering an extended stay.
- Set your check-in time to match or beat the market standard of 4:00 PM. Offering early check-in flexibility can be a low-cost differentiator.
- Monitor length-of-stay seasonality to adjust minimum-night requirements — longer minimums during peak periods maximize revenue while shorter minimums fill gaps in shoulder seasons.
Manacor Airbnb Minimum Stay Requirements Analysis
Distribution of Listings by Minimum Night Requirement
1 Night
25 listings
11.6% of total
2 Nights
7 listings
3.3% of total
3 Nights
3 listings
1.4% of total
4-6 Nights
50 listings
23.3% of total
7-29 Nights
34 listings
15.8% of total
30+ Nights
96 listings
44.7% of total
Key Insights
- The most prevalent minimum stay requirement in Manacor is 30+ Nights, adopted by 44.7% of listings. This highlights the market's preference for longer commitments.
- Very short stays (1-2 nights) are less common (14.9%), suggesting hosts prefer slightly longer bookings to optimize turnover.
- A significant segment (44.7%) caters to monthly stays (30+ nights) in Manacor, pointing to opportunities in the extended-stay market.
Recommendations
- Align with the market by considering a 30+ Nights minimum stay, as 44.7% of Manacor hosts use this setting.
- If feasible, allowing 1-night stays, especially midweek or during low season, could capture last-minute bookings, as only 11.6% currently do.
- Explore offering discounts for stays of 30+ nights to attract the 44.7% of the market seeking extended stays.
- Adjust minimum nights based on seasonality – potentially shorter during low season and longer during peak demand periods in Manacor.
Manacor Airbnb Cancellation Policy Trends Analysis (2026)
Limited
2 listings
0.9% of total
Super Strict 60 Days
4 listings
1.9% of total
Super Strict 30 Days
22 listings
10.2% of total
Flexible
17 listings
7.9% of total
Moderate
21 listings
9.8% of total
Firm
112 listings
52.1% of total
Strict
37 listings
17.2% of total
Cancellation Policy Insights for Manacor
- The prevailing Airbnb cancellation policy trend in Manacor is Firm, used by 52.1% of listings.
- A majority (69.3%) of hosts in Manacor utilize Firm or Strict policies, indicating a market where hosts prioritize booking security.
Recommendations for Hosts
- Consider adopting a Firm policy to align with the 52.1% market standard in Manacor.
- Regularly review your cancellation policy against competitors and market demand shifts in Manacor.
How Much Are Airbnb Cleaning Fees in Manacor?
Cleaning fees in Manacor are meaningful operating levers, not just pass-through charges. What matters most is how often hosts charge them, how high they run relative to market norms, and how large a share of gross revenue they consume.
Cleaning Fee Insights for Manacor
- 72.1% of listings charge a cleaning fee, making it standard practice in Manacor. Guests expect it and factor it into their booking decisions.
- The gap between the average ($749) and median ($174) cleaning fee indicates some high-end properties are pulling the average up considerably.
- Cleaning fees represent 7.1% of gross revenue on average — a modest component of the overall booking price.
Recommendations for Hosts
- Price your cleaning fee competitively against the Manacor median of $174. Fees significantly above market norms can deter bookings, especially for shorter stays.
- Monitor competitor cleaning fees regularly. Airbnb's search algorithm factors in total price, so a well-calibrated cleaning fee can improve your listing's ranking.
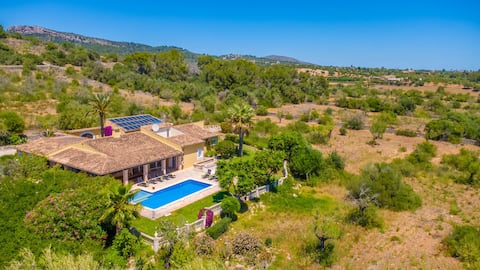
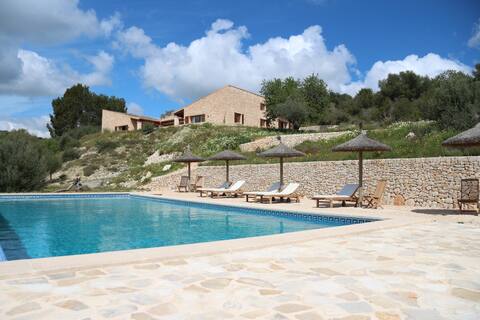
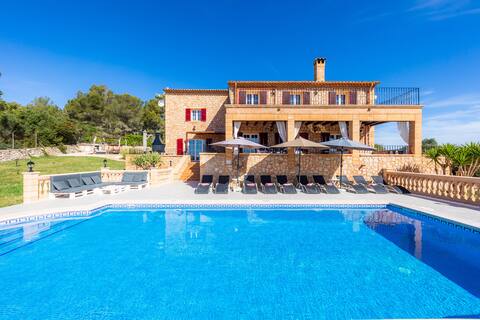
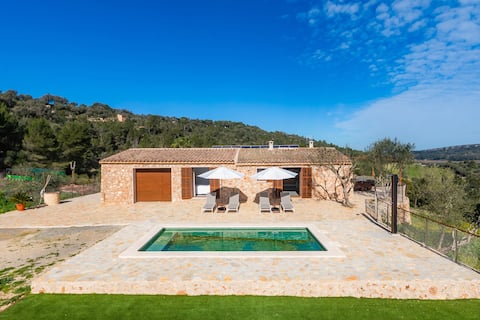
What Do the Top Airbnb Listings in Manacor Look Like?
Benchmark your potential! Explore examples of top-performing Airbnb properties in Manacorbased on Trailing Twelve Month (TTM) revenue. Analyze their characteristics, revenue, occupancy rate, and ADR to understand what drives success in this market.
Ca Na Margalida
Entire Place • 5 bedrooms
Son Pages Sea View Fincas with Pool & Air Conditioning
Entire Place • 12 bedrooms
Maria
Entire Place • 6 bedrooms

Can Pedro Ros
Entire Place • 3 bedrooms
Can Jaume
Entire Place • 2 bedrooms
Cala Rafalino
Entire Place • 3 bedrooms
Note: Performance varies based on location, size, amenities, seasonality, and management quality. Data reflects the past 12 months.
Who Are the Top Airbnb Hosts in Manacor?
Learn from the best! This table showcases top-performing Airbnb hosts in Manacor based on the number of properties managed and estimated total revenue over the past year. Analyze their scale and performance metrics.
| Host Name | Properties | Grossing Revenue | Stay Reviews | Avg Rating |
|---|---|---|---|---|
| Homerti | 17 | $1,878,615 | 218 | 4.63/5.0 |
| Holidu | 4 | $449,178 | 84 | 4.87/5.0 |
| Joan Crespi Morillas | 6 | $403,081 | 69 | 4.91/5.0 |
| Mallorca House Rent | 11 | $386,727 | 100 | 4.37/5.0 |
| Maria | 7 | $386,478 | 92 | 4.84/5.0 |
| Wilfried | 1 | $360,861 | 24 | 4.92/5.0 |
| Holidu | 2 | $317,103 | 18 | 4.94/5.0 |
| Holidu | 3 | $285,847 | 27 | 5.00/5.0 |
| Eucalyptus Home | 5 | $257,156 | 111 | 4.74/5.0 |
| Bel | 5 | $253,233 | 189 | 4.87/5.0 |
Analyzing the strategies of top hosts, such as their property selection, pricing, and guest communication, can offer valuable lessons for optimizing your own Airbnb operations in Manacor.
Who Are the Airbnb Hosts in Manacor?
Manacor leans more toward professional operations than casual hosting, which usually raises the competitive bar for new entrants.
Host Profile Insights for Manacor
- A 30.7% Superhost share is healthy — enough experienced operators to anchor quality without making the market impenetrable for newcomers.
- 33.0% of listings are professionally managed, indicating a mature, competitive market with institutional players.
- 25.6% of listings have Instant Book enabled. Lower Instant Book adoption means many guests must request approval, which can slow conversions.
- 74.4% of listings use Airbnb's simplified pricing (host-only fee), where the host pays the entire platform service fee and the guest sees one all-in price with no separate Airbnb service charge. High adoption signals a professional, PMS-connected host base — Airbnb mandates simplified pricing for software-connected listings.
Recommendations for Hosts
- Earning Superhost status can significantly improve search ranking and guest trust. Focus on maintaining high response rates, low cancellations, and strong reviews.
- Consider enabling Instant Book — it reduces booking friction and Airbnb's algorithm tends to favor Instant Book listings in search results.
- Benchmark your host metrics against these Manacor averages regularly and adjust your hosting strategy based on what top performers do differently.
Top Professional Management Companies in Manacor
These are the highest-grossing professional property management operations in Manacor, ranked by total revenue across their portfolio. Their performance metrics offer a benchmark for what institutional-level hosting looks like in this market.
| Company | Listings | Revenue | ADR | Occ. | Rating |
|---|---|---|---|---|---|
| Homerti | 17 | $1,878,615 | $1,402 | 40.9% | 4.63/5 |
| Holidu | 4 | $449,178 | $2,629 | 32.6% | 4.87/5 |
| Joan Crespi Morillas | 6 | $403,081 | $705 | 48.5% | 4.91/5 |
| Mallorca House Rent | 11 | $386,727 | $369 | 46.6% | 4.37/5 |
| Holidu | 2 | $317,103 | $2,014 | 20.6% | 4.94/5 |
| Holidu | 3 | $285,847 | $1,990 | 33.3% | 5.00/5 |
| Portic | 2 | $214,334 | $760 | 31.4% | 4.51/5 |
| Luis | 7 | $189,044 | $322 | 35.2% | 4.68/5 |
| Casamara Stays S.L. | 1 | $111,854 | $575 | 69.3% | 4.90/5 |
| Antonio | 2 | $96,928 | $514 | 45.0% | 4.52/5 |
Management Company Insights for Manacor
- The leading management company, Homerti, operates 17 listings with $1,878,615 in gross revenue — a useful benchmark for what scale looks like in Manacor.
- Top managers average 6 properties each, suggesting professional management in Manacor still operates at a relatively boutique scale.
- Professionally managed listings in the top tier average 4.73/5 in guest ratings — demonstrating that scale and quality can coexist.
Recommendations
- Study how top management companies price, position, and maintain their portfolios — their ADR and occupancy rates reflect strategies refined across dozens of listings.
- If you're considering hiring a property manager, compare their portfolio performance against these benchmarks before committing.
How Does Manacor's Airbnb Market Compare to Nearby Cities?
How does the Manacor Airbnb market stack up against its neighbors? Compare key performance metrics like average monthly revenue, ADR, and occupancy rates in surrounding areas to understand the broader regional STR landscape.
Compared with Deià, Manacor has 4 percentage points lower occupancy and about $128 lower ADR. That helps frame whether this market is winning more on demand, pricing, or both.
| Market | Active Properties | Monthly Revenue | Daily Rate | Avg. Occupancy |
|---|---|---|---|---|
| Badia Blava | 28 | $8,045 | $1151.46 | 42% |
| ses Illetes | 21 | $7,770 | $761.15 | 42% |
| Algaida | 79 | $6,522 | $869.62 | 45% |
| Deià | 59 | $6,287 | $652.23 | 49% |
| ses Palmeres | 10 | $6,268 | $720.62 | 47% |
| Marratxí | 73 | $6,224 | $761.33 | 45% |
| Bunyola | 56 | $6,009 | $677.36 | 46% |
| Lloseta | 47 | $5,475 | $717.51 | 48% |
| Mancor de la Vall | 36 | $5,363 | $831.72 | 45% |
| Ariany | 59 | $5,076 | $805.55 | 41% |
Frequently Asked Questions About Airbnb in Manacor
These quick answers summarize the most common investor and operator questions using AirROI's latest market data for Manacor.
How much do Airbnb hosts make in Manacor?
Manacor hosts earn about $41,911 per year on average, with an average nightly rate of $524 and RevPAR of $232. Those figures describe the typical revenue environment for active listings in Manacor, Balearic Islands, not the ceiling for the best operators. Source: AirROI 2026 data, Manacor market, July 2025 to June 2026.
What is the average Airbnb occupancy rate in Manacor?
The average Airbnb occupancy rate in Manacor is 44.8%. July is the strongest month and January is the softest, so hosts should expect demand to move meaningfully throughout the year rather than stay flat.
What is the average Airbnb daily rate in Manacor?
Listings in Manacor average $524 per night. The broader pricing spread also matters: lower-performing listings cluster closer to the lower quartiles, while premium homes can price materially above the city average when demand spikes or listing quality stands out.
How many Airbnb listings are active in Manacor?
Manacor currently has about 215 active Airbnb listings in AirROI's market dataset. That supply count helps explain how competitive the market is, how much depth there is for benchmarking, and whether the market behaves like a niche destination or a scaled urban market.
How strict are short-term rental regulations in Manacor?
AirROI currently classifies the short-term rental regulation level in Manacor as High. The dataset also shows about 90.7% of listings with registration evidence. That is a market signal, not legal advice, so hosts should still confirm current licensing and compliance rules locally before listing.
What is the RevPAR for Airbnb in Manacor?
RevPAR in Manacor is about $232. That metric combines pricing and occupancy into one efficiency number, so it is often a better quick benchmark than ADR alone when investors want to compare how well listings convert nightly rates into realized revenue.
Is Airbnb profitable in Manacor?
At 44.8% occupancy, Manacor can be profitable — but margins depend heavily on operating costs, property acquisition price, and how well hosts optimize pricing across seasons. Average annual revenue is $41,911, but individual returns depend on property type, location within the city, and the host's operating efficiency.
How far in advance do guests book Airbnb in Manacor?
The average booking lead time in Manacor is about 108 days — a longer planning horizon typical of destination or vacation markets where travelers book well in advance. Hosts who understand their market's booking cadence can adjust minimum stays and pricing windows accordingly.
What are the best neighborhoods for Airbnb in Manacor?
Based on AirROI's analysis, some of the top neighborhoods for short-term rentals in Manacor include Porto Cristo, Cala Millor, Manacor city center. Each area attracts different guest profiles — from business travelers to leisure visitors — so the best location depends on the property type and target audience a host is aiming for. See the full neighborhood breakdown above.
What type of property performs best on Airbnb in Manacor?
entire_home listings make up 90.7% of the active supply in Manacor. The most common configuration does not always mean the most profitable — operators who identify underserved property types or bedroom counts can sometimes outperform the market average by filling a gap in local supply.
How does Manacor compare to nearby Airbnb markets?
Among neighboring markets, Badia Blava posts $96,541 in average annual revenue with 42.0% occupancy, compared to Manacor's $41,911 and 44.8%. Comparing nearby markets helps investors understand whether a destination's performance reflects local demand or broader regional trends.
What is the average length of stay in Manacor?
The average Airbnb stay length in Manacor is about 7.3 nights. That matters for turnover, cleaning operations, and pricing strategy because shorter stays increase changeovers while longer stays can smooth occupancy and reduce operational friction.
What is the average Airbnb guest rating in Manacor?
Airbnb listings in Manacor average 4.76 out of 5 overall. About 23.3% of listings carry the guest favorite badge, which suggests a meaningful share of inventory is competing on review quality rather than price alone.
Which amenities boost Airbnb revenue in Manacor?
Washer and Iron are among the strongest revenue-linked amenities in Manacor. In AirROI's latest dataset, listings with these amenities outperform those without on average revenue, which makes amenities analysis useful for prioritizing investment and listing upgrades.
Do Airbnb hosts charge cleaning fees in Manacor?
Yes. About 72.1% of active Airbnb listings in Manacor charge a cleaning fee, and the average fee is $749. The more important operating benchmark is how much of gross revenue that fee consumes, not just the absolute dollar amount.
What percentage of Airbnb hosts are Superhosts in Manacor?
At 30.7%, there is a healthy mix of experienced and newer hosts — earning Superhost status can still provide a meaningful visibility boost.
About AirROI Market Data
AirROI tracks over 20 million properties across 190+ countries and maintains 15+ years of historical performance data, making it one of the deepest Airbnb and STR intelligence platforms available. The analytics pipeline aggregates listing-level data monthly — revenue, occupancy, nightly rates, RevPAR, guest demographics, booking patterns, and competitive supply — so investors and operators can benchmark any market against its own history and against neighboring destinations.
Real estate investors, property managers, financial institutions, hedge funds, tourism boards, hospitality consultants, tech platforms, and academic researchers rely on AirROI data to underwrite acquisitions, optimize pricing, model macro trends, and conduct peer-reviewed research. Data is available through in-depth market reports like this one and the Airbnb API with 22 endpoints and an Airbnb MCP Server for AI agents.
AirROI proprietary analytics as of 2026-06-30. Metrics reflect trailing twelve-month aggregates from active listings. Revenue figures are market averages, not projections. Neighborhood descriptions are AI-generated and reviewed for accuracy. For full methodology, see the data methodology page.