Cornellà del Terri, Catalonia Airbnb Market Data 2025: STR Report & Statistics
How much can you earn on Airbnb in Cornellà del Terri, Catalonia? Based on AirROI's 2025 dataset (May 2024 – April 2025), the short answer is $64,300 per year — at a $448 nightly rate, 42.3% occupancy, and a N/A RevPAR.
With just 16 active listings, Cornellà del Terri is a micro-market where moderate demand with room for well-positioned listings to outperform. Active supply contracted 23.8% year over year, yet revenue and nightly rates both rose — fewer listings are capturing more of the market. Remaining and incoming hosts benefit from reduced competition and stronger pricing.
Regulation is high and 88% of listings show active registration — compliance is the cost of entry. In a market this size, differentiated listings with strong reviews can capture outsized returns relative to the competition.

Table of Contents [hide] [show]
What Are the Key Airbnb Metrics in Cornellà del Terri?
In Cornellà del Terri, the headline Airbnb metrics are $64,300 in average annual revenue,42.3% occupancy, $448 ADR, and $0 in RevPAR, and guests book about 68 days in advance.
How Much Do Airbnb Hosts Earn Monthly in Cornellà del Terri?
Understanding the monthly revenue variations for Airbnb listings in Cornellà del Terri is key to maximizing your short term rental income potential. Seasonality significantly impacts earnings. Our analysis, based on data from the past 12 months, shows that the peak revenue month for STRs in Cornellà del Terri is typically August, while January often presents the lowest earnings, highlighting opportunities for strategic pricing adjustments during shoulder and low seasons. Explore the typical Airbnb income in Cornellà del Terri across different performance tiers:
- Best-in-class properties (Top 10%) achieve $17,229+ monthly, often utilizing dynamic pricing and superior guest experiences.
- Strong performing properties (Top 25%) earn $6,652 or more, indicating effective management and desirable locations/amenities.
- Typical properties (Median) generate around $2,549 per month, representing the average market performance.
- Entry-level properties (Bottom 25%) see earnings around $1,330, often with potential for optimization.
Average Monthly Airbnb Earnings Trend in Cornellà del Terri
What Is the Monthly Airbnb Occupancy Rate in Cornellà del Terri?
Maximize your bookings by understanding the Cornellà del Terri STR occupancy trends. Seasonal demand shifts significantly influence how often properties are booked. Typically, Augustsees the highest demand (peak season occupancy), while January experiences the lowest (low season). Effective strategies, like adjusting minimum stays or offering promotions, can boost occupancy during slower periods. Here's how different property tiers perform in Cornellà del Terri:
- Best-in-class properties (Top 10%) achieve 70%+ occupancy, indicating high desirability and potentially optimized availability.
- Strong performing properties (Top 25%) maintain 58% or higher occupancy, suggesting good market fit and guest satisfaction.
- Typical properties (Median) have an occupancy rate around 34%.
- Entry-level properties (Bottom 25%) average 18% occupancy, potentially facing higher vacancy.
Average Monthly Occupancy Rate Trend in Cornellà del Terri
What Is the Average Airbnb Nightly Rate in Cornellà del Terri?
Effective short term rental pricing strategy in Cornellà del Terri involves understanding monthly ADR fluctuations. The Average Daily Rate (ADR) for Airbnb in Cornellà del Terri typically peaks in April and dips lowest during November. Leveraging Airbnb dynamic pricing tools or strategies based on this seasonality can significantly boost revenue. Here's a look at the typical nightly rates achieved:
- Best-in-class properties (Top 10%) command rates of $1,086+ per night, often due to premium features or locations.
- Strong performing properties (Top 25%) achieve nightly rates of $398 or more.
- Typical properties (Median) charge around $200 per night.
- Entry-level properties (Bottom 25%) earn around $114 per night.
Average Daily Rate (ADR) Trend by Month in Cornellà del Terri
What Is the RevPAR for Airbnb in Cornellà del Terri?
RevPAR in Cornellà del Terri is currently N/A. Because RevPAR combines nightly rates with realized occupancy, it is one of the cleanest ways to compare how efficiently listings turn demand into revenue across the market.
- Entry-level properties (Bottom 25%) see N/A RevPAR.
- Typical properties (Median) generate N/A RevPAR.
- Strong performers (Top 25%) earn N/A RevPAR.
- Best-in-class (Top 10%) achieve N/A RevPAR.
Average Monthly RevPAR Trend in Cornellà del Terri
RevPAR Insights for Cornellà del Terri
- RevPAR peaks in Jan and bottoms out in Jan, mirroring the broader seasonal demand pattern and suggesting opportunities for dynamic pricing.
Recommendations for Hosts
- Track your own RevPAR monthly against these Cornellà del Terri benchmarks. If your RevPAR falls below the median of N/A, examine whether low occupancy or low ADR is the primary drag.
- Use RevPAR rather than revenue alone when comparing properties of different sizes — it normalizes for available nights and gives a more accurate picture of performance.
Get Live Cornellà del Terri Market Intelligence 👇
Explore Real-time Analytics
When Is the Peak Season for Airbnb in Cornellà del Terri?
Cornellà del Terri's peak Airbnb season falls in August, July, June, while the softest stretch is January, March, November. Overall, the market shows highly seasonal trends requiring careful strategy, which should guide pricing, minimum stays, and cash-flow planning.
Peak Season (August, July, June)
- Revenue averages $9,246 per month
- Occupancy rates average 52.4%
- Daily rates average $380
Shoulder Season
- Revenue averages $6,214 per month
- Occupancy maintains around 38.8%
- Daily rates hold near $402
Low Season (January, March, November)
- Revenue drops to average $3,404 per month
- Occupancy decreases to average 25.3%
- Daily rates adjust to average $407
Seasonality Insights for Cornellà del Terri
- Airbnb seasonality in Cornellà del Terri is pronounced. Revenue swings sharply between peak and low months, which means pricing strategy, minimum-stay settings, and cash reserves all need to account for extended slower periods.
- During the high season, the absolute peak month showcases Cornellà del Terri's highest earning potential, with monthly revenues climbing to $10,497, occupancy reaching 62.1%, and ADRs peaking at $452.
- Conversely, the slowest single month marks the market's lowest point — revenue may dip to $3,025, occupancy could drop to 20.0%, and ADRs may adjust to $351.
- Understanding both the seasonal averages and these monthly peaks and troughs in revenue, occupancy, and ADR is crucial for maximizing your Airbnb profit potential in Cornellà del Terri.
Seasonal Strategies for Maximizing Profit
- Peak Season: Maximize revenue through premium pricing. In a high-regulation market like Cornellà del Terri, ensure your permit covers the number of nights you plan to book — some jurisdictions cap annual rental days.
- Low Season: Offer competitive pricing, extended-stay discounts, and flexible cancellation policies. Target off-season travelers like remote workers, budget-conscious guests, and travelers with flexible schedules.
- Shoulder Seasons: Implement dynamic pricing that bridges peak and low rates. Target weekend travelers, local events, and business visitors. Slightly more flexible terms than peak season can help maintain occupancy without deep discounting.
- In a highly seasonal market like Cornellà del Terri, building a cash reserve during the top months is essential for covering fixed costs during the slow period. Automated pricing tools can help capture demand shifts in real time.
Do You Need a License for Airbnb in Cornellà del Terri?
Yes, Cornellà del Terri, Catalonia, Spain enforces high STR regulations and 88% of active listings show registration evidence — indicating that enforcement is active and compliance is a prerequisite for operating legally. Hosts entering this market should budget for permit fees, inspections, and potential occupancy tax obligations as part of their startup costs. Always verify the latest short-term rental regulations and Airbnb license requirements directly with local government authorities for Cornellà del Terri to ensure full compliance before hosting.
(Source: AirROI data, 2026, based on 88% licensed listings)
What Are the Best Neighborhoods for Airbnb in Cornellà del Terri?
With a compact short-term rental market, Cornellà del Terri gives early-mover hosts an advantage in the right neighborhoods. The areas listed below are where guest demand and local attractions converge — a useful lens for investors evaluating whether to enter this market and where to position their listing.
| Neighborhood / Area | Why Host Here? (Target Guests & Appeal) | Key Attractions & Landmarks |
|---|---|---|
| Centro de Cornellà | The heart of the town, with a variety of shops, cafes, and restaurants. This area attracts local tourists and offers cultural experiences, making it ideal for short stays. | Plaza de Catalunya, Can Cuyàs, Teatre de Cornellà, Museo Agbar de les Aigües, Parc de la Infanta Elena |
| Parc del Nord | A popular residential area with green spaces and recreational areas, perfect for families and those seeking a quieter stay close to nature and amenities. | Parc del Nord, Gimnasio Municipal, Cafeterías locales |
| La Bastida | An emerging neighborhood with a blend of modern conveniences and traditional charm. Attracts a diverse group of visitors looking for an authentic experience. | Pueblo de Cornellà, Mercado Municipal, Cafés y restaurantes típicos |
| Sant Ildefons | A suburban area with strong transport links to Barcelona, appealing to business travelers and visitors looking for easy access to the city. | Estación de Sant Ildefons, Parques y zonas verdes, Comercios locales |
| Setmanes | A developing area known for its proximity to major transport routes. Great for guests needing easy access to different parts of Catalonia. | Accesos a la autovía, Comercios locales |
| Cornellà de Llobregat | This broader area encompasses various neighborhoods with cultural landmarks, making it convenient for tourists exploring greater Barcelona. | Museo de la Ciencia, Cerro de Montjuïc, Ferias locales |
| Cerdanyola del Vallès | Located a bit further out, this residential area is great for longer stays and attracts families looking for a peaceful environment with access to the city. | Naturaleza cercania, Parc Natural de Collserola |
| Molins de Rei | Another outskirt but with a charming town center, perfect for those wanting to escape the hustle and bustle of Barcelona while still being close. | Centro histórico, Mercados locales, Parques |
Because Cornellà del Terri has a high regulation profile, confirming that short-term rental permits are available in your target neighborhood is a critical first step before committing to a property purchase. Regulation can vary at the neighborhood or district level even within the same city.
What Types of Properties Are on Airbnb in Cornellà del Terri?
Room Type Distribution
Property Type Distribution
Market Composition Insights for Cornellà del Terri
- The Cornellà del Terri Airbnb market composition is heavily skewed towards Entire Home/Apt listings, which make up 93.8% of the 16 active rentals. This indicates strong guest preference for privacy and space.
- Looking at the property type distribution in Cornellà del Terri, House properties are the most common (68.8%), reflecting the local real estate landscape.
- Houses represent a significant 68.8% portion, catering likely to families or larger groups.
- The presence of 12.5% Hotel/Boutique listings indicates integration with traditional hospitality.
Cornellà del Terri Airbnb Room Capacity Analysis (2026): Bedroom Distribution
Distribution of Listings by Number of Bedrooms
Room Capacity Insights for Cornellà del Terri
- The dominant room capacity in Cornellà del Terri is 5+ bedrooms listings, making up 31.3% of the market. This suggests a strong demand for properties suitable for families or small groups.
- Together, 5+ bedrooms and 4 bedrooms properties represent 50.1% of the active Airbnb listings in Cornellà del Terri, indicating a high concentration in these sizes.
- A significant 62.6% of listings offer 3+ bedrooms, catering to larger groups and families seeking more space in Cornellà del Terri.
Cornellà del Terri Vacation Rental Guest Capacity Trends (2026)
Distribution of Listings by Guest Capacity
Guest Capacity Insights for Cornellà del Terri
- The most common guest capacity trend in Cornellà del Terri vacation rentals is listings accommodating 8+ guests (43.8%). This suggests the primary traveler segment is likely larger groups.
- Properties designed for 8+ guests and 5 guests dominate the Cornellà del Terri STR market, accounting for 56.3% of listings.
- 62.6% of properties accommodate 6+ guests, serving the market segment for larger families or group travel in Cornellà del Terri.
- On average, properties in Cornellà del Terri are equipped to host 5.9 guests.
What Amenities Do Airbnb Guests Expect in Cornellà del Terri?
Amenity Prevalence
Amenity Insights for Cornellà del Terri
- Essential amenities in Cornellà del Terri that guests expect include: Heating, Wifi. Lacking these (any) could significantly impact bookings.
- Popular amenities like Kitchen, Essentials, Dishes and silverware are common but not universal. Offering these can provide a competitive edge.
Recommendations for Hosts
- Ensure your listing includes all essential amenities for Cornellà del Terri: Heating, Wifi.
- Consider adding popular differentiators like Kitchen or Essentials to increase appeal.
- Highlight unique or less common amenities you offer (e.g., hot tub, dedicated workspace, EV charger) in your listing description and photos.
- Regularly check competitor amenities in Cornellà del Terri to stay competitive.
Dive Deeper: Advanced Cornellà del Terri STR Market Data (2026)
Ready to unlock more insights? AirROI provides access to advanced metrics and comprehensive Airbnb data for Cornellà del Terri. Explore detailed analytics beyond this report to refine your investment strategy, optimize pricing, and maximize your vacation rental profits.
Explore Advanced MetricsCornellà del Terri Airbnb Guest Demographics & Profile Analysis (2026)
Guest Profile Summary for Cornellà del Terri
- The typical guest profile for Airbnb in Cornellà del Terri consists of predominantly international visitors (74%), with top international origins including Spain, typically belonging to the Post-2000s (Gen Z/Alpha) group (50%), primarily speaking English or Spanish.
- Domestic travelers account for 25.7% of guests.
- Key international markets include France (31%) and Spain (25.7%).
- Top languages spoken are English (33.3%) followed by Spanish (21.6%).
- A significant demographic segment is the Post-2000s (Gen Z/Alpha) group, representing 50% of guests.
Recommendations for Hosts
- Focus marketing internationally, particularly towards travelers from Spain.
- Tailor amenities and listing descriptions to appeal to the dominant Post-2000s (Gen Z/Alpha) demographic (e.g., highlight fast WiFi, smart home features, local guides).
- Highlight unique local experiences or amenities relevant to the primary guest profile.
- Consider seasonal promotions aligned with peak travel times for key origin markets.
Cornellà del Terri Airbnb Booking Patterns (2026): Available vs. Booked Days
Available Days Distribution
Booked Days Distribution
Booking Pattern Insights for Cornellà del Terri
- The most common availability pattern in Cornellà del Terri falls within the 181-270 days range, representing 43.8% of listings. This suggests many properties have significant open periods on their calendars.
- Approximately 81.3% of listings show high availability (181+ days open annually), indicating potential for increased bookings or specific owner usage patterns.
- For booked days, the 91-180 days range is most frequent in Cornellà del Terri (43.8%), reflecting common guest stay durations or potential owner blocking patterns.
- A notable 18.8% of properties secure long booking periods (181+ days booked per year), highlighting successful long-term rental strategies or significant owner usage.
How Far in Advance Do Guests Book Airbnb in Cornellà del Terri?
Average Booking Lead Time by Month
Booking Lead Time Insights for Cornellà del Terri
- The overall average booking lead time for vacation rentals in Cornellà del Terri is 68 days.
- Guests book furthest in advance for stays during August (average 116 days), likely coinciding with peak travel demand or local events.
- The shortest booking windows occur for stays in March (average 53 days), indicating more last-minute travel plans during this time.
- Seasonally, Summer (105 days avg.) sees the longest lead times, while Winter (62 days avg.) has the shortest, reflecting typical travel planning cycles.
Recommendations for Hosts
- Use the overall average lead time (68 days) as a baseline for your pricing and availability strategy in Cornellà del Terri.
- For August stays, consider implementing length-of-stay discounts or slightly higher rates for bookings made less than 116 days out to capitalize on advance planning.
- Target marketing efforts for the Summer season well in advance (at least 105 days) to capture early planners.
- Monitor your own booking lead times against these Cornellà del Terri averages to identify opportunities for dynamic pricing adjustments.
Cornellà del Terri Airbnb Minimum Stay Requirements Analysis
Distribution of Listings by Minimum Night Requirement
1 Night
1 listings
6.7% of total
2 Nights
7 listings
46.7% of total
3 Nights
1 listings
6.7% of total
4-6 Nights
2 listings
13.3% of total
30+ Nights
4 listings
26.7% of total
Key Insights
- The most prevalent minimum stay requirement in Cornellà del Terri is 2 Nights, adopted by 46.7% of listings. This highlights the market's preference for shorter, flexible bookings.
- A significant segment (26.7%) caters to monthly stays (30+ nights) in Cornellà del Terri, pointing to opportunities in the extended-stay market.
Recommendations
- Align with the market by considering a 2 Nights minimum stay, as 46.7% of Cornellà del Terri hosts use this setting.
- If feasible, allowing 1-night stays, especially midweek or during low season, could capture last-minute bookings, as only 6.7% currently do.
- A 2-night minimum appears standard (46.7%). Consider this for weekends or peak periods.
- Explore offering discounts for stays of 30+ nights to attract the 26.7% of the market seeking extended stays.
- Adjust minimum nights based on seasonality – potentially shorter during low season and longer during peak demand periods in Cornellà del Terri.
Cornellà del Terri Airbnb Cancellation Policy Trends Analysis (2026)
Super Strict 30 Days
1 listings
7.1% of total
Flexible
2 listings
14.3% of total
Moderate
4 listings
28.6% of total
Firm
1 listings
7.1% of total
Strict
6 listings
42.9% of total
Cancellation Policy Insights for Cornellà del Terri
- The prevailing Airbnb cancellation policy trend in Cornellà del Terri is Strict, used by 42.9% of listings.
- There's a relatively balanced mix between guest-friendly (42.9%) and stricter (50.0%) policies, offering choices for different guest needs.
Recommendations for Hosts
- Consider adopting a Strict policy to align with the 42.9% market standard in Cornellà del Terri.
- With 42.9% using Strict terms, this is a viable option in Cornellà del Terri, particularly for high-value properties or during peak demand periods.
- Regularly review your cancellation policy against competitors and market demand shifts in Cornellà del Terri.
What Do the Top Airbnb Listings in Cornellà del Terri Look Like?
Benchmark your potential! Explore examples of top-performing Airbnb properties in Cornellà del Terribased on Trailing Twelve Month (TTM) revenue. Analyze their characteristics, revenue, occupancy rate, and ADR to understand what drives success in this market.
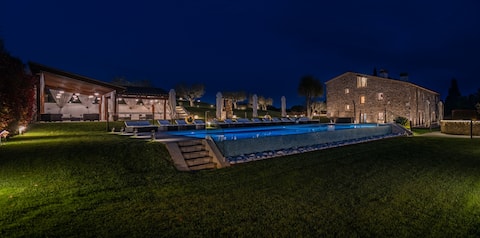
More Rosset - Luxury Villa Girona - Costa Brava
Entire Place • 8 bedrooms
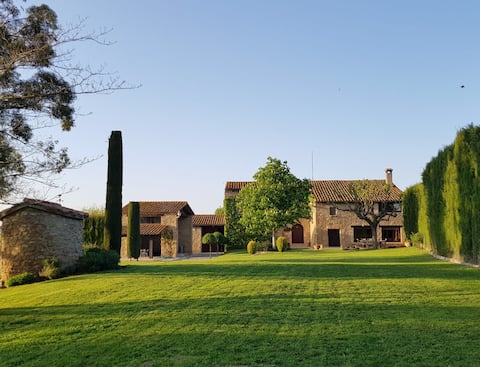
Private Luxury Villa Can Riera
Entire Place • 4 bedrooms
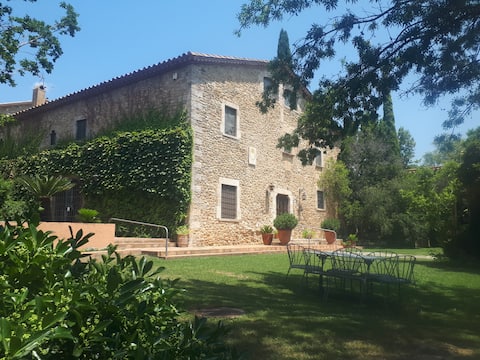
Can Sagnari between Girona and Banyoles: Pool and BBQ
Entire Place • 8 bedrooms
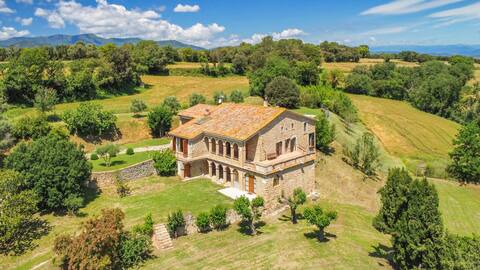
Majordoms - Maria Carmen Dalmau, Girona
Entire Place • 5 bedrooms

Nature House . Girona
Entire Place • 8 bedrooms

Lujosa Villa con Vistas y Piscina infinita
Entire Place • 7 bedrooms
Note: Performance varies based on location, size, amenities, seasonality, and management quality. Data reflects the past 12 months.
Who Are the Top Airbnb Hosts in Cornellà del Terri?
Learn from the best! This table showcases top-performing Airbnb hosts in Cornellà del Terri based on the number of properties managed and estimated total revenue over the past year. Analyze their scale and performance metrics.
| Host Name | Properties | Grossing Revenue | Stay Reviews | Avg Rating |
|---|---|---|---|---|
| Mas Rosset | 1 | $394,940 | 35 | 5.00/5.0 |
| Anna | 1 | $153,379 | 33 | 4.97/5.0 |
| Can Sagnari | 1 | $116,782 | 47 | 4.94/5.0 |
| Sílvia | 2 | $74,418 | 213 | 4.83/5.0 |
| Els Majordoms | 1 | $66,225 | 5 | 4.80/5.0 |
| Host #579168535 | 1 | $59,483 | 0 | 0.00/5.0 |
| Gemma | 1 | $51,919 | 35 | 4.94/5.0 |
| Moises | 1 | $23,390 | 18 | 4.61/5.0 |
| Josep-Maria | 1 | $20,499 | 21 | 4.81/5.0 |
| Lourdes | 1 | $18,358 | 126 | 4.97/5.0 |
Analyzing the strategies of top hosts, such as their property selection, pricing, and guest communication, can offer valuable lessons for optimizing your own Airbnb operations in Cornellà del Terri.
How Does Cornellà del Terri's Airbnb Market Compare to Nearby Cities?
How does the Cornellà del Terri Airbnb market stack up against its neighbors? Compare key performance metrics like average monthly revenue, ADR, and occupancy rates in surrounding areas to understand the broader regional STR landscape.
Compared with Tiana, Cornellà del Terri has 5 percentage points lower occupancy and about $141 higher ADR. That helps frame whether this market is winning more on demand, pricing, or both.
| Market | Active Properties | Monthly Revenue | Daily Rate | Avg. Occupancy |
|---|---|---|---|---|
| Vall-llobrega | 15 | $9,315 | $798.78 | 44% |
| Canyelles | 47 | $6,340 | $1051.73 | 37% |
| Bescanó | 11 | $5,156 | $460.49 | 43% |
| Tiana | 12 | $5,019 | $307.51 | 47% |
| Porqueres | 12 | $4,767 | $467.68 | 37% |
| Amer | 11 | $4,414 | $367.21 | 39% |
| la Baronia de Rialb | 14 | $4,385 | $402.56 | 44% |
| Sant Vicenç de Montalt | 42 | $4,168 | $411.98 | 41% |
| Premià de Dalt | 28 | $4,103 | $342.03 | 47% |
| Bàscara | 11 | $4,070 | $441.18 | 38% |
Frequently Asked Questions About Airbnb in Cornellà del Terri
These quick answers summarize the most common investor and operator questions using AirROI's latest market data for Cornellà del Terri.
How much do Airbnb hosts make in Cornellà del Terri?
Cornellà del Terri hosts earn about $64,300 per year on average, with an average nightly rate of $448 and RevPAR of N/A. Those figures describe the typical revenue environment for active listings in Cornellà del Terri, Catalonia, not the ceiling for the best operators. Source: AirROI 2025 data, Cornellà del Terri market, May 2024 to April 2025.
What is the average Airbnb occupancy rate in Cornellà del Terri?
The average Airbnb occupancy rate in Cornellà del Terri is 42.3%. August is the strongest month and January is the softest, so hosts should expect demand to move meaningfully throughout the year rather than stay flat.
What is the average Airbnb daily rate in Cornellà del Terri?
Listings in Cornellà del Terri average $448 per night. The broader pricing spread also matters: lower-performing listings cluster closer to the lower quartiles, while premium homes can price materially above the city average when demand spikes or listing quality stands out.
How many Airbnb listings are active in Cornellà del Terri?
Cornellà del Terri currently has about 16 active Airbnb listings in AirROI's market dataset. That supply count helps explain how competitive the market is, how much depth there is for benchmarking, and whether the market behaves like a niche destination or a scaled urban market.
How strict are short-term rental regulations in Cornellà del Terri?
AirROI currently classifies the short-term rental regulation level in Cornellà del Terri as High. The dataset also shows about 87.5% of listings with registration evidence. That is a market signal, not legal advice, so hosts should still confirm current licensing and compliance rules locally before listing.
What is the RevPAR for Airbnb in Cornellà del Terri?
RevPAR in Cornellà del Terri is about N/A. That metric combines pricing and occupancy into one efficiency number, so it is often a better quick benchmark than ADR alone when investors want to compare how well listings convert nightly rates into realized revenue.
Is Airbnb profitable in Cornellà del Terri?
At 42.3% occupancy, Cornellà del Terri can be profitable — but margins depend heavily on operating costs, property acquisition price, and how well hosts optimize pricing across seasons. Average annual revenue is $64,300, but individual returns depend on property type, location within the city, and the host's operating efficiency.
How far in advance do guests book Airbnb in Cornellà del Terri?
The average booking lead time in Cornellà del Terri is about 68 days — a longer planning horizon typical of destination or vacation markets where travelers book well in advance. Hosts who understand their market's booking cadence can adjust minimum stays and pricing windows accordingly.
What are the best neighborhoods for Airbnb in Cornellà del Terri?
Based on AirROI's analysis, some of the top neighborhoods for short-term rentals in Cornellà del Terri include Centro de Cornellà, Parc del Nord, La Bastida. Each area attracts different guest profiles — from business travelers to leisure visitors — so the best location depends on the property type and target audience a host is aiming for. See the full neighborhood breakdown above.
What type of property performs best on Airbnb in Cornellà del Terri?
entire_home listings make up 93.8% of the active supply in Cornellà del Terri. The most common configuration does not always mean the most profitable — operators who identify underserved property types or bedroom counts can sometimes outperform the market average by filling a gap in local supply.
How does Cornellà del Terri compare to nearby Airbnb markets?
Among neighboring markets, Vall-llobrega posts $111,780 in average annual revenue with 44.4% occupancy, compared to Cornellà del Terri's $64,300 and 42.3%. Comparing nearby markets helps investors understand whether a destination's performance reflects local demand or broader regional trends.
When is the peak season for Airbnb in Cornellà del Terri?
August is the highest-revenue month in Cornellà del Terri, while January is the softest. The revenue spread between them indicates a highly seasonal market — revenue in the peak month is more than double the low month, so cash-flow planning and pricing automation are critical.
About AirROI Market Data
AirROI tracks over 20 million properties across 190+ countries and maintains 15+ years of historical performance data, making it one of the deepest Airbnb and STR intelligence platforms available. The analytics pipeline aggregates listing-level data monthly — revenue, occupancy, nightly rates, RevPAR, guest demographics, booking patterns, and competitive supply — so investors and operators can benchmark any market against its own history and against neighboring destinations.
Real estate investors, property managers, financial institutions, hedge funds, tourism boards, hospitality consultants, tech platforms, and academic researchers rely on AirROI data to underwrite acquisitions, optimize pricing, model macro trends, and conduct peer-reviewed research. Data is available through in-depth market reports like this one and the Airbnb API with 22 endpoints and an Airbnb MCP Server for AI agents.
AirROI proprietary analytics as of 2025-04-30. Metrics reflect trailing twelve-month aggregates from active listings. Revenue figures are market averages, not projections. Neighborhood descriptions are AI-generated and reviewed for accuracy. For full methodology, see the data methodology page.