O Barco de Valdeorras, Galicia Airbnb Market Data 2025: STR Report & Statistics
How much can you earn on Airbnb in O Barco de Valdeorras, Galicia? Based on AirROI's 2025 dataset (May 2024 – April 2025), the short answer is $9,240 per year — at a $107 nightly rate, 31.8% occupancy, and a N/A RevPAR.
With just 18 active listings, O Barco de Valdeorras is a micro-market where selective demand that rewards strong listing quality and pricing strategy. Supply expanded 28.6% as revenue climbed even while nightly rates softened — occupancy gains are outrunning rate pressure. For hosts entering now, strengthening demand means there is still room to build a profitable listing.
Regulation is high, and hosts should factor licensing costs and compliance timelines into their launch plan. In a market this size, differentiated listings with strong reviews can capture outsized returns relative to the competition.

Table of Contents [hide] [show]
What Are the Key Airbnb Metrics in O Barco de Valdeorras?
In O Barco de Valdeorras, the headline Airbnb metrics are $9,240 in average annual revenue,31.8% occupancy, $107 ADR, and $0 in RevPAR, and guests book about 23 days in advance.
How Much Do Airbnb Hosts Earn Monthly in O Barco de Valdeorras?
Understanding the monthly revenue variations for Airbnb listings in O Barco de Valdeorras is key to maximizing your short term rental income potential. Seasonality significantly impacts earnings. Our analysis, based on data from the past 12 months, shows that the peak revenue month for STRs in O Barco de Valdeorras is typically August, while February often presents the lowest earnings, highlighting opportunities for strategic pricing adjustments during shoulder and low seasons. Explore the typical Airbnb income in O Barco de Valdeorras across different performance tiers:
- Best-in-class properties (Top 10%) achieve $2,331+ monthly, often utilizing dynamic pricing and superior guest experiences.
- Strong performing properties (Top 25%) earn $1,256 or more, indicating effective management and desirable locations/amenities.
- Typical properties (Median) generate around $786 per month, representing the average market performance.
- Entry-level properties (Bottom 25%) see earnings around $438, often with potential for optimization.
Average Monthly Airbnb Earnings Trend in O Barco de Valdeorras
What Is the Monthly Airbnb Occupancy Rate in O Barco de Valdeorras?
Maximize your bookings by understanding the O Barco de Valdeorras STR occupancy trends. Seasonal demand shifts significantly influence how often properties are booked. Typically, Augustsees the highest demand (peak season occupancy), while February experiences the lowest (low season). Effective strategies, like adjusting minimum stays or offering promotions, can boost occupancy during slower periods. Here's how different property tiers perform in O Barco de Valdeorras:
- Best-in-class properties (Top 10%) achieve 57%+ occupancy, indicating high desirability and potentially optimized availability.
- Strong performing properties (Top 25%) maintain 43% or higher occupancy, suggesting good market fit and guest satisfaction.
- Typical properties (Median) have an occupancy rate around 26%.
- Entry-level properties (Bottom 25%) average 16% occupancy, potentially facing higher vacancy.
Average Monthly Occupancy Rate Trend in O Barco de Valdeorras
What Is the Average Airbnb Nightly Rate in O Barco de Valdeorras?
Effective short term rental pricing strategy in O Barco de Valdeorras involves understanding monthly ADR fluctuations. The Average Daily Rate (ADR) for Airbnb in O Barco de Valdeorras typically peaks in December and dips lowest during November. Leveraging Airbnb dynamic pricing tools or strategies based on this seasonality can significantly boost revenue. Here's a look at the typical nightly rates achieved:
- Best-in-class properties (Top 10%) command rates of $186+ per night, often due to premium features or locations.
- Strong performing properties (Top 25%) achieve nightly rates of $107 or more.
- Typical properties (Median) charge around $81 per night.
- Entry-level properties (Bottom 25%) earn around $61 per night.
Average Daily Rate (ADR) Trend by Month in O Barco de Valdeorras
What Is the RevPAR for Airbnb in O Barco de Valdeorras?
RevPAR in O Barco de Valdeorras is currently N/A. Because RevPAR combines nightly rates with realized occupancy, it is one of the cleanest ways to compare how efficiently listings turn demand into revenue across the market.
- Entry-level properties (Bottom 25%) see N/A RevPAR.
- Typical properties (Median) generate N/A RevPAR.
- Strong performers (Top 25%) earn N/A RevPAR.
- Best-in-class (Top 10%) achieve N/A RevPAR.
Average Monthly RevPAR Trend in O Barco de Valdeorras
RevPAR Insights for O Barco de Valdeorras
- RevPAR peaks in Jan and bottoms out in Jan, mirroring the broader seasonal demand pattern and suggesting opportunities for dynamic pricing.
Recommendations for Hosts
- Track your own RevPAR monthly against these O Barco de Valdeorras benchmarks. If your RevPAR falls below the median of N/A, examine whether low occupancy or low ADR is the primary drag.
- Use RevPAR rather than revenue alone when comparing properties of different sizes — it normalizes for available nights and gives a more accurate picture of performance.
Get Live O Barco de Valdeorras Market Intelligence 👇
Explore Real-time Analytics
When Is the Peak Season for Airbnb in O Barco de Valdeorras?
O Barco de Valdeorras's peak Airbnb season falls in August, May, September, while the softest stretch is February, March, June. Overall, the market shows highly seasonal trends requiring careful strategy, which should guide pricing, minimum stays, and cash-flow planning.
Peak Season (August, May, September)
- Revenue averages $1,647 per month
- Occupancy rates average 38.7%
- Daily rates average $158
Shoulder Season
- Revenue averages $1,145 per month
- Occupancy maintains around 32.1%
- Daily rates hold near $182
Low Season (February, March, June)
- Revenue drops to average $624 per month
- Occupancy decreases to average 20.3%
- Daily rates adjust to average $185
Seasonality Insights for O Barco de Valdeorras
- Airbnb seasonality in O Barco de Valdeorras is pronounced. Revenue swings sharply between peak and low months, which means pricing strategy, minimum-stay settings, and cash reserves all need to account for extended slower periods.
- During the high season, the absolute peak month showcases O Barco de Valdeorras's highest earning potential, with monthly revenues climbing to $2,156, occupancy reaching 60.4%, and ADRs peaking at $209.
- Conversely, the slowest single month marks the market's lowest point — revenue may dip to $603, occupancy could drop to 15.5%, and ADRs may adjust to $158.
- Lower occupancy paired with meaningful seasonality means hosts in O Barco de Valdeorras need to maximize every peak-season booking and seriously consider whether off-season pricing adjustments or minimum-stay changes can capture incremental revenue.
Seasonal Strategies for Maximizing Profit
- Peak Season: Maximize revenue through premium pricing. In a high-regulation market like O Barco de Valdeorras, ensure your permit covers the number of nights you plan to book — some jurisdictions cap annual rental days.
- Low Season: Offer competitive pricing, extended-stay discounts, and flexible cancellation policies. Target off-season travelers like remote workers, budget-conscious guests, and travelers with flexible schedules.
- Shoulder Seasons: Implement dynamic pricing that bridges peak and low rates. Target weekend travelers, local events, and business visitors. Slightly more flexible terms than peak season can help maintain occupancy without deep discounting.
- In a highly seasonal market like O Barco de Valdeorras, building a cash reserve during the top months is essential for covering fixed costs during the slow period. Automated pricing tools can help capture demand shifts in real time.
Do You Need a License for Airbnb in O Barco de Valdeorras?
O Barco de Valdeorras, Galicia, Spain has a high regulation classification, yet only 44% of listings show registration evidence. That gap between regulation on the books and compliance on the ground can shift quickly — municipalities often tighten enforcement in waves, putting unregistered operators at risk of fines or delisting. Always verify the latest short-term rental regulations and Airbnb license requirements directly with local government authorities for O Barco de Valdeorras to ensure full compliance before hosting.
(Source: AirROI data, 2026, based on 44% licensed listings)
What Are the Best Neighborhoods for Airbnb in O Barco de Valdeorras?
With a compact short-term rental market, O Barco de Valdeorras gives early-mover hosts an advantage in the right neighborhoods. The areas listed below are where guest demand and local attractions converge — a useful lens for investors evaluating whether to enter this market and where to position their listing.
| Neighborhood / Area | Why Host Here? (Target Guests & Appeal) | Key Attractions & Landmarks |
|---|---|---|
| O Barco de Valdeorras Center | The heart of the town, ideal for guests looking for convenience to shops, restaurants, and public transportation. It's a great base for exploring the region and attracts both tourists and business travelers. | Valdeorras Wine Route, Castro de San Pedro, Parque Natural de las Cuevas de Algueira, Sierra de O Courel, Monumento Natural dos Moinhos de Rañadoiro |
| Ribeira Sacra | A stunning region known for its scenic beauty, wine cultivation, and historic monasteries. It attracts nature lovers and wine tourists, making it an appealing spot for Airbnb hosting. | Monasterio de Santo Estevo, Cañones del Sil, Cata de vinos en Adegas, Rutas de senderismo, Miradores de la Ribeira Sacra |
| Villamartín de Valdeorras | A charming village nearby that offers a tranquil experience. Attracts those looking for peace, nature, and local culture away from the bustle of the city. | Local hiking trails, Cultural festivals, Historic architecture, Natural parks, Local gastronomy |
| Las Médulas | A UNESCO World Heritage site known for its stunning landscapes created by ancient gold mining. A perfect location for tourists interested in history and nature. | Las Médulas Roman Gold Mines, Numismatic Museum, Hiking routes, Scenic viewpoints, Cultural heritage sites |
| Valdeorras Wine Region | Famous for its rich wine heritage, particularly the Godello and Mencia grapes. Wine enthusiasts flock here, offering a great opportunity for wine-related tourism. | Wine tastings, Visiting wineries, Wine festivals, Agritourism experiences, Gastronomy events |
| Aquila | A peaceful community that serves as a gateway to the surrounding nature and adventure activities. It's ideal for families and groups looking for outdoor experiences. | Hiking, Cycling routes, Fishing spots, Canoeing on the river, Family-friendly activities |
| Cabo do Mundo | Known for its breathtaking views and hiking trails, this area attracts outdoor enthusiasts and those looking for a retreat in nature. | Mirador de Cabo do Mundo, Hiking trails, Bird watching, Scenic photography spots, Local flora and fauna |
| Celorico de Basto | A small town known for its traditional architecture and peaceful environment. It appeals to tourists wanting an authentic Galician experience. | Historic churches, Traditional markets, Local craft fairs, Scenic parks, Cultural events |
Because O Barco de Valdeorras has a high regulation profile, confirming that short-term rental permits are available in your target neighborhood is a critical first step before committing to a property purchase. Regulation can vary at the neighborhood or district level even within the same city.
What Types of Properties Are on Airbnb in O Barco de Valdeorras?
Room Type Distribution
Property Type Distribution
Market Composition Insights for O Barco de Valdeorras
- The O Barco de Valdeorras Airbnb market composition is heavily skewed towards Entire Home/Apt listings, which make up 94.4% of the 18 active rentals. This indicates strong guest preference for privacy and space.
- Looking at the property type distribution in O Barco de Valdeorras, Apartment/Condo properties are the most common (66.7%), reflecting the local real estate landscape.
- Houses represent a significant 27.8% portion, catering likely to families or larger groups.
- The presence of 5.6% Hotel/Boutique listings indicates integration with traditional hospitality.
O Barco de Valdeorras Airbnb Room Capacity Analysis (2026): Bedroom Distribution
Distribution of Listings by Number of Bedrooms
Room Capacity Insights for O Barco de Valdeorras
- The dominant room capacity in O Barco de Valdeorras is 1 bedroom listings, making up 33.3% of the market. This suggests a strong demand for properties suitable for couples or solo travelers.
- Together, 1 bedroom and 3 bedrooms properties represent 61.1% of the active Airbnb listings in O Barco de Valdeorras, indicating a high concentration in these sizes.
- A significant 39.0% of listings offer 3+ bedrooms, catering to larger groups and families seeking more space in O Barco de Valdeorras.
O Barco de Valdeorras Vacation Rental Guest Capacity Trends (2026)
Distribution of Listings by Guest Capacity
Guest Capacity Insights for O Barco de Valdeorras
- The most common guest capacity trend in O Barco de Valdeorras vacation rentals is listings accommodating 2 guests (27.8%). This suggests the primary traveler segment is likely couples or solo travelers.
- Properties designed for 2 guests and 4 guests dominate the O Barco de Valdeorras STR market, accounting for 55.6% of listings.
- 27.8% of properties accommodate 6+ guests, serving the market segment for larger families or group travel in O Barco de Valdeorras.
- On average, properties in O Barco de Valdeorras are equipped to host 4.3 guests.
What Amenities Do Airbnb Guests Expect in O Barco de Valdeorras?
Amenity Prevalence
Amenity Insights for O Barco de Valdeorras
- Essential amenities in O Barco de Valdeorras that guests expect include: TV, Kitchen. Lacking these (any) could significantly impact bookings.
- Popular amenities like Washer, Heating, Essentials are common but not universal. Offering these can provide a competitive edge.
Recommendations for Hosts
- Ensure your listing includes all essential amenities for O Barco de Valdeorras: TV, Kitchen.
- Consider adding popular differentiators like Washer or Heating to increase appeal.
- Highlight unique or less common amenities you offer (e.g., hot tub, dedicated workspace, EV charger) in your listing description and photos.
- Regularly check competitor amenities in O Barco de Valdeorras to stay competitive.
Dive Deeper: Advanced O Barco de Valdeorras STR Market Data (2026)
Ready to unlock more insights? AirROI provides access to advanced metrics and comprehensive Airbnb data for O Barco de Valdeorras. Explore detailed analytics beyond this report to refine your investment strategy, optimize pricing, and maximize your vacation rental profits.
Explore Advanced MetricsO Barco de Valdeorras Airbnb Guest Demographics & Profile Analysis (2026)
Guest Profile Summary for O Barco de Valdeorras
- The typical guest profile for Airbnb in O Barco de Valdeorras consists of primarily domestic travelers (85%), often arriving from nearby Madrid, typically belonging to the Post-2000s (Gen Z/Alpha) group (50%), primarily speaking Spanish or English.
- Domestic travelers account for 85.1% of guests.
- Key international markets include Spain (85.1%) and France (5.7%).
- Top languages spoken are Spanish (45.5%) followed by English (20.8%).
- A significant demographic segment is the Post-2000s (Gen Z/Alpha) group, representing 50% of guests.
Recommendations for Hosts
- Target domestic marketing efforts towards travelers from Madrid and A Coruña.
- Tailor amenities and listing descriptions to appeal to the dominant Post-2000s (Gen Z/Alpha) demographic (e.g., highlight fast WiFi, smart home features, local guides).
- Highlight unique local experiences or amenities relevant to the primary guest profile.
- Consider seasonal promotions aligned with peak travel times for key origin markets.
O Barco de Valdeorras Airbnb Booking Patterns (2026): Available vs. Booked Days
Available Days Distribution
Booked Days Distribution
Booking Pattern Insights for O Barco de Valdeorras
- The most common availability pattern in O Barco de Valdeorras falls within the 271-366 days range, representing 72.2% of listings. This suggests many properties have significant open periods on their calendars.
- Approximately 94.4% of listings show high availability (181+ days open annually), indicating potential for increased bookings or specific owner usage patterns.
- For booked days, the 31-90 days range is most frequent in O Barco de Valdeorras (50%), reflecting common guest stay durations or potential owner blocking patterns.
- A notable 5.6% of properties secure long booking periods (181+ days booked per year), highlighting successful long-term rental strategies or significant owner usage.
How Far in Advance Do Guests Book Airbnb in O Barco de Valdeorras?
Average Booking Lead Time by Month
Booking Lead Time Insights for O Barco de Valdeorras
- The overall average booking lead time for vacation rentals in O Barco de Valdeorras is 23 days.
- Guests book furthest in advance for stays during May (average 52 days), likely coinciding with peak travel demand or local events.
- The shortest booking windows occur for stays in March (average 9 days), indicating more last-minute travel plans during this time.
- Seasonally, Spring (32 days avg.) sees the longest lead times, while Summer (21 days avg.) has the shortest, reflecting typical travel planning cycles.
Recommendations for Hosts
- Use the overall average lead time (23 days) as a baseline for your pricing and availability strategy in O Barco de Valdeorras.
- For May stays, consider implementing length-of-stay discounts or slightly higher rates for bookings made less than 52 days out to capitalize on advance planning.
- During March, focus on last-minute booking availability and promotions, as guests book with very short notice (9 days avg.).
- Target marketing efforts for the Spring season well in advance (at least 32 days) to capture early planners.
- Monitor your own booking lead times against these O Barco de Valdeorras averages to identify opportunities for dynamic pricing adjustments.
O Barco de Valdeorras Airbnb Minimum Stay Requirements Analysis
Distribution of Listings by Minimum Night Requirement
1 Night
7 listings
50% of total
2 Nights
7 listings
50% of total
Key Insights
- The most prevalent minimum stay requirement in O Barco de Valdeorras is 1 Night, adopted by 50% of listings. This highlights the market's preference for shorter, flexible bookings.
- A strong majority (100.0%) of the O Barco de Valdeorras Airbnb data shows acceptance of very short stays (1-2 nights), indicating a dynamic, high-turnover market.
Recommendations
- Align with the market by considering a 1 Night minimum stay, as 50% of O Barco de Valdeorras hosts use this setting.
- Adjust minimum nights based on seasonality – potentially shorter during low season and longer during peak demand periods in O Barco de Valdeorras.
O Barco de Valdeorras Airbnb Cancellation Policy Trends Analysis (2026)
Flexible
10 listings
76.9% of total
Moderate
1 listings
7.7% of total
Firm
2 listings
15.4% of total
Cancellation Policy Insights for O Barco de Valdeorras
- The prevailing Airbnb cancellation policy trend in O Barco de Valdeorras is Flexible, used by 76.9% of listings.
- The market strongly favors guest-friendly terms, with 84.6% of listings offering Flexible or Moderate policies. This suggests guests in O Barco de Valdeorras may expect booking flexibility.
Recommendations for Hosts
- Consider adopting a Flexible policy to align with the 76.9% market standard in O Barco de Valdeorras.
- Given the high prevalence of Flexible policies (76.9%), offering this can enhance booking appeal, especially during shoulder seasons.
- Regularly review your cancellation policy against competitors and market demand shifts in O Barco de Valdeorras.
What Do the Top Airbnb Listings in O Barco de Valdeorras Look Like?
Benchmark your potential! Explore examples of top-performing Airbnb properties in O Barco de Valdeorrasbased on Trailing Twelve Month (TTM) revenue. Analyze their characteristics, revenue, occupancy rate, and ADR to understand what drives success in this market.
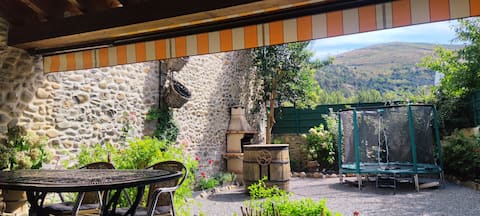
"A Casona do Barco" Casa grande with patio and garden
Entire Place • 6 bedrooms
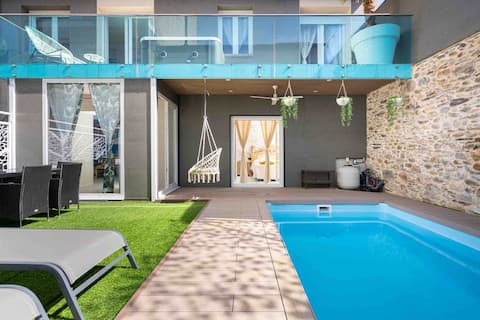
Luxury Barco de Valdeorras
Entire Place • 1 bedroom
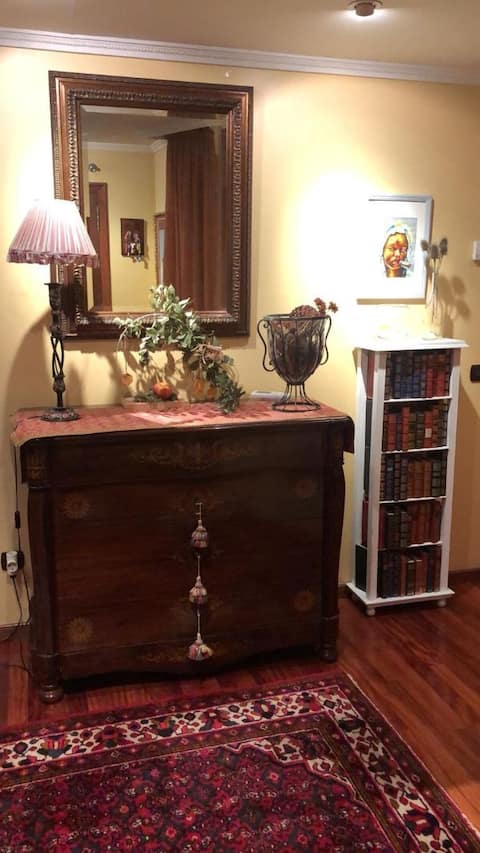
O Barco de Valdeorras: Luz y Alegría
Entire Place • 4 bedrooms

Alojamiento Jacuzzy Barco
Entire Place • 2 bedrooms

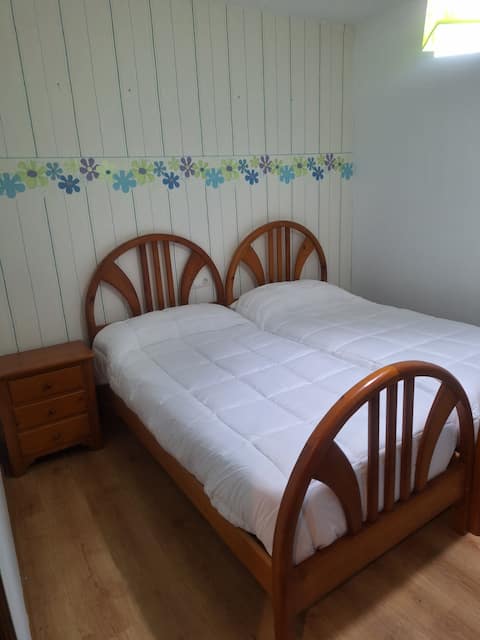
Beautiful 1 Bedroom Apartment
Entire Place • 1 bedroom
The gardens
Entire Place • 3 bedrooms
Note: Performance varies based on location, size, amenities, seasonality, and management quality. Data reflects the past 12 months.
Who Are the Top Airbnb Hosts in O Barco de Valdeorras?
Learn from the best! This table showcases top-performing Airbnb hosts in O Barco de Valdeorras based on the number of properties managed and estimated total revenue over the past year. Analyze their scale and performance metrics.
| Host Name | Properties | Grossing Revenue | Stay Reviews | Avg Rating |
|---|---|---|---|---|
| Fernando | 1 | $46,244 | 25 | 4.92/5.0 |
| Juan Francisco | 3 | $27,827 | 78 | 4.85/5.0 |
| Daniel | 3 | $27,110 | 63 | 4.92/5.0 |
| Katia | 2 | $14,510 | 88 | 4.93/5.0 |
| Host #21229900 | 1 | $11,929 | 2 | 0.00/5.0 |
| Jennifer | 1 | $10,238 | 5 | 4.40/5.0 |
| Adrian | 1 | $10,023 | 3 | 4.67/5.0 |
| Ana Maria | 2 | $8,924 | 39 | 2.46/5.0 |
| Manolo | 1 | $4,984 | 22 | 4.77/5.0 |
| Host #412530081 | 1 | $1,946 | 0 | 0.00/5.0 |
Analyzing the strategies of top hosts, such as their property selection, pricing, and guest communication, can offer valuable lessons for optimizing your own Airbnb operations in O Barco de Valdeorras.
How Does O Barco de Valdeorras's Airbnb Market Compare to Nearby Cities?
How does the O Barco de Valdeorras Airbnb market stack up against its neighbors? Compare key performance metrics like average monthly revenue, ADR, and occupancy rates in surrounding areas to understand the broader regional STR landscape.
Compared with Portomarín, O Barco de Valdeorras has 16 percentage points lower occupancy and about $46 lower ADR. That helps frame whether this market is winning more on demand, pricing, or both.
| Market | Active Properties | Monthly Revenue | Daily Rate | Avg. Occupancy |
|---|---|---|---|---|
| Armamar | 59 | $2,233 | $252.51 | 39% |
| Alijó | 63 | $1,908 | $273.49 | 32% |
| Anreade e São Romão de Arego | 14 | $1,759 | $184.24 | 41% |
| Mesão Frio | 53 | $1,708 | $197.07 | 43% |
| Tabuaço | 26 | $1,579 | $183.97 | 35% |
| Sabrosa | 49 | $1,520 | $204.78 | 34% |
| Portomarín | 13 | $1,354 | $152.30 | 48% |
| A Fonsagrada | 16 | $1,353 | $154.57 | 40% |
| Peso da Régua | 115 | $1,315 | $188.29 | 32% |
| Llanera | 13 | $1,306 | $198.16 | 39% |
Frequently Asked Questions About Airbnb in O Barco de Valdeorras
These quick answers summarize the most common investor and operator questions using AirROI's latest market data for O Barco de Valdeorras.
How much do Airbnb hosts make in O Barco de Valdeorras?
O Barco de Valdeorras hosts earn about $9,240 per year on average, with an average nightly rate of $107 and RevPAR of N/A. Those figures describe the typical revenue environment for active listings in O Barco de Valdeorras, Galicia, not the ceiling for the best operators. Source: AirROI 2025 data, O Barco de Valdeorras market, May 2024 to April 2025.
What is the average Airbnb occupancy rate in O Barco de Valdeorras?
The average Airbnb occupancy rate in O Barco de Valdeorras is 31.8%. August is the strongest month and February is the softest, so hosts should expect demand to move meaningfully throughout the year rather than stay flat.
What is the average Airbnb daily rate in O Barco de Valdeorras?
Listings in O Barco de Valdeorras average $107 per night. The broader pricing spread also matters: lower-performing listings cluster closer to the lower quartiles, while premium homes can price materially above the city average when demand spikes or listing quality stands out.
How many Airbnb listings are active in O Barco de Valdeorras?
O Barco de Valdeorras currently has about 18 active Airbnb listings in AirROI's market dataset. That supply count helps explain how competitive the market is, how much depth there is for benchmarking, and whether the market behaves like a niche destination or a scaled urban market.
How strict are short-term rental regulations in O Barco de Valdeorras?
AirROI currently classifies the short-term rental regulation level in O Barco de Valdeorras as High. The dataset also shows about 44.4% of listings with registration evidence. That is a market signal, not legal advice, so hosts should still confirm current licensing and compliance rules locally before listing.
What is the RevPAR for Airbnb in O Barco de Valdeorras?
RevPAR in O Barco de Valdeorras is about N/A. That metric combines pricing and occupancy into one efficiency number, so it is often a better quick benchmark than ADR alone when investors want to compare how well listings convert nightly rates into realized revenue.
Is Airbnb profitable in O Barco de Valdeorras?
Occupancy of 31.8% means O Barco de Valdeorras is a more selective market. Profitability is achievable but requires careful cost management, premium positioning, or targeting longer stays to reduce turnover. Average annual revenue is $9,240, but individual returns depend on property type, location within the city, and the host's operating efficiency.
How far in advance do guests book Airbnb in O Barco de Valdeorras?
The average booking lead time in O Barco de Valdeorras is about 23 days — a moderate lead time that gives hosts planning visibility while still benefiting from last-minute bookings. Hosts who understand their market's booking cadence can adjust minimum stays and pricing windows accordingly.
What are the best neighborhoods for Airbnb in O Barco de Valdeorras?
Based on AirROI's analysis, some of the top neighborhoods for short-term rentals in O Barco de Valdeorras include O Barco de Valdeorras Center, Ribeira Sacra, Villamartín de Valdeorras. Each area attracts different guest profiles — from business travelers to leisure visitors — so the best location depends on the property type and target audience a host is aiming for. See the full neighborhood breakdown above.
What type of property performs best on Airbnb in O Barco de Valdeorras?
entire_home listings make up 94.4% of the active supply in O Barco de Valdeorras. The most common configuration does not always mean the most profitable — operators who identify underserved property types or bedroom counts can sometimes outperform the market average by filling a gap in local supply.
How does O Barco de Valdeorras compare to nearby Airbnb markets?
Among neighboring markets, Armamar posts $26,794 in average annual revenue with 39.1% occupancy, compared to O Barco de Valdeorras's $9,240 and 31.8%. Comparing nearby markets helps investors understand whether a destination's performance reflects local demand or broader regional trends.
When is the peak season for Airbnb in O Barco de Valdeorras?
August is the highest-revenue month in O Barco de Valdeorras, while February is the softest. The revenue spread between them indicates a highly seasonal market — revenue in the peak month is more than double the low month, so cash-flow planning and pricing automation are critical.
About AirROI Market Data
AirROI tracks over 20 million properties across 190+ countries and maintains 15+ years of historical performance data, making it one of the deepest Airbnb and STR intelligence platforms available. The analytics pipeline aggregates listing-level data monthly — revenue, occupancy, nightly rates, RevPAR, guest demographics, booking patterns, and competitive supply — so investors and operators can benchmark any market against its own history and against neighboring destinations.
Real estate investors, property managers, financial institutions, hedge funds, tourism boards, hospitality consultants, tech platforms, and academic researchers rely on AirROI data to underwrite acquisitions, optimize pricing, model macro trends, and conduct peer-reviewed research. Data is available through in-depth market reports like this one and the Airbnb API with 22 endpoints and an Airbnb MCP Server for AI agents.
AirROI proprietary analytics as of 2025-04-30. Metrics reflect trailing twelve-month aggregates from active listings. Revenue figures are market averages, not projections. Neighborhood descriptions are AI-generated and reviewed for accuracy. For full methodology, see the data methodology page.