Entebbe, Central Region Airbnb Market Data 2026: STR Report & Statistics
How much can you earn on Airbnb in Entebbe, Central Region? Based on AirROI's 2026 dataset (July 2025 – June 2026), the short answer is $1,729 per year — at a $47 nightly rate, 27.6% occupancy, and a $13 RevPAR that reflects a wider gap between nightly rates and realized revenue that rewards occupancy-focused strategies.
At 72 active listings, Entebbe is a boutique market where selective demand that rewards strong listing quality and pricing strategy.
Regulation is low with minimal registration requirements, pointing to an operator-friendly environment. In a market this size, differentiated listings with strong reviews can capture outsized returns relative to the competition.
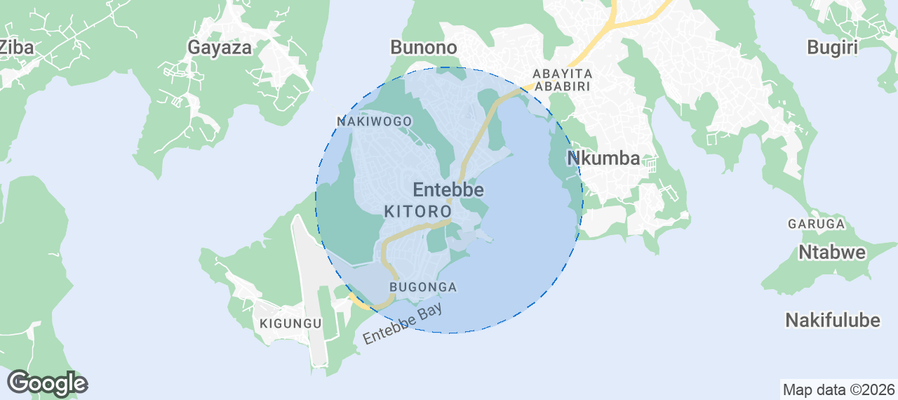
Table of Contents [hide] [show]
What Are the Key Airbnb Metrics in Entebbe?
In Entebbe, the headline Airbnb metrics are $1,729 in average annual revenue,27.6% occupancy, $47 ADR, and $13 in RevPAR, and guests book about 13 days in advance.
How Much Do Airbnb Hosts Earn Monthly in Entebbe?
Understanding the monthly revenue variations for Airbnb listings in Entebbe is key to maximizing your short term rental income potential. Seasonality significantly impacts earnings. Our analysis, based on data from the past 12 months, shows that the peak revenue month for STRs in Entebbe is typically December, while August often presents the lowest earnings, highlighting opportunities for strategic pricing adjustments during shoulder and low seasons. Explore the typical Airbnb income in Entebbe across different performance tiers:
- Best-in-class properties (Top 10%) achieve $829+ monthly, often utilizing dynamic pricing and superior guest experiences.
- Strong performing properties (Top 25%) earn $520 or more, indicating effective management and desirable locations/amenities.
- Typical properties (Median) generate around $241 per month, representing the average market performance.
- Entry-level properties (Bottom 25%) see earnings around $132, often with potential for optimization.
Average Monthly Airbnb Earnings Trend in Entebbe
What Is the Monthly Airbnb Occupancy Rate in Entebbe?
Maximize your bookings by understanding the Entebbe STR occupancy trends. Seasonal demand shifts significantly influence how often properties are booked. Typically, Decembersees the highest demand (peak season occupancy), while June experiences the lowest (low season). Effective strategies, like adjusting minimum stays or offering promotions, can boost occupancy during slower periods. Here's how different property tiers perform in Entebbe:
- Best-in-class properties (Top 10%) achieve 60%+ occupancy, indicating high desirability and potentially optimized availability.
- Strong performing properties (Top 25%) maintain 44% or higher occupancy, suggesting good market fit and guest satisfaction.
- Typical properties (Median) have an occupancy rate around 20%.
- Entry-level properties (Bottom 25%) average 10% occupancy, potentially facing higher vacancy.
Average Monthly Occupancy Rate Trend in Entebbe
What Is the Average Airbnb Nightly Rate in Entebbe?
Effective short term rental pricing strategy in Entebbe involves understanding monthly ADR fluctuations. The Average Daily Rate (ADR) for Airbnb in Entebbe typically peaks in June and dips lowest during January. Leveraging Airbnb dynamic pricing tools or strategies based on this seasonality can significantly boost revenue. Here's a look at the typical nightly rates achieved:
- Best-in-class properties (Top 10%) command rates of $82+ per night, often due to premium features or locations.
- Strong performing properties (Top 25%) achieve nightly rates of $61 or more.
- Typical properties (Median) charge around $37 per night.
- Entry-level properties (Bottom 25%) earn around $29 per night.
Average Daily Rate (ADR) Trend by Month in Entebbe
What Is the RevPAR for Airbnb in Entebbe?
RevPAR in Entebbe is currently $13. Because RevPAR combines nightly rates with realized occupancy, it is one of the cleanest ways to compare how efficiently listings turn demand into revenue across the market.
- Entry-level properties (Bottom 25%) see $7 RevPAR.
- Typical properties (Median) generate $11 RevPAR.
- Strong performers (Top 25%) earn $16 RevPAR.
- Best-in-class (Top 10%) achieve $21 RevPAR.
Average Monthly RevPAR Trend in Entebbe
RevPAR Insights for Entebbe
- The average RevPAR in Entebbe is $13. This metric combines nightly rates with realized occupancy, making it one of the best single-number indicators of market efficiency.
- The gap between the top 10% ($21) and bottom 25% ($7) is $14, suggesting a relatively compressed market where operational differences yield moderate returns.
- RevPAR peaks in Apr and bottoms out in Aug, mirroring the broader seasonal demand pattern and suggesting opportunities for dynamic pricing.
Recommendations for Hosts
- Track your own RevPAR monthly against these Entebbe benchmarks. If your RevPAR falls below the median of $11, examine whether low occupancy or low ADR is the primary drag.
- Top-quartile listings achieve $16+ RevPAR through a combination of competitive pricing, strong reviews, and strategic amenities. Target this tier through incremental improvements.
- Use RevPAR rather than revenue alone when comparing properties of different sizes — it normalizes for available nights and gives a more accurate picture of performance.
Get Live Entebbe Market Intelligence 👇
Explore Real-time Analytics
When Is the Peak Season for Airbnb in Entebbe?
Entebbe's peak Airbnb season falls in December, April, March, while the softest stretch is January, August, September. Overall, the market shows moderate seasonality with distinct peak and low periods, which should guide pricing, minimum stays, and cash-flow planning.
Peak Season (December, April, March)
- Revenue averages $487 per month
- Occupancy rates average 33.4%
- Daily rates average $50
Shoulder Season
- Revenue averages $369 per month
- Occupancy maintains around 27.8%
- Daily rates hold near $49
Low Season (January, August, September)
- Revenue drops to average $261 per month
- Occupancy decreases to average 23.1%
- Daily rates adjust to average $45
Seasonality Insights for Entebbe
- The Airbnb seasonality pattern in Entebbe shows moderate seasonality with distinct peak and low periods. While the sections above show seasonal averages, it is also insightful to look at the extremes:
- During the high season, the absolute peak month showcases Entebbe's highest earning potential, with monthly revenues climbing to $504, occupancy reaching 35.7%, and ADRs peaking at $55.
- Conversely, the slowest single month marks the market's lowest point — revenue may dip to $246, occupancy could drop to 20.5%, and ADRs may adjust to $44.
- Lower occupancy paired with meaningful seasonality means hosts in Entebbe need to maximize every peak-season booking and seriously consider whether off-season pricing adjustments or minimum-stay changes can capture incremental revenue.
Seasonal Strategies for Maximizing Profit
- Peak Season: Maximize revenue through premium pricing and potentially longer minimum stays. Ensure high availability and consider tightening cancellation policies to reduce last-minute gaps.
- Low Season: Offer competitive pricing, extended-stay discounts, and flexible cancellation policies. Target off-season travelers like remote workers, budget-conscious guests, and travelers with flexible schedules.
- Shoulder Seasons: Implement dynamic pricing that bridges peak and low rates. Target weekend travelers, local events, and business visitors. Slightly more flexible terms than peak season can help maintain occupancy without deep discounting.
- Regularly analyze your own performance against these Entebbe seasonality benchmarks and adjust your pricing and availability strategy accordingly.
Do You Need a License for Airbnb in Entebbe?
Low regulation and minimal registration activity in Entebbe, Central Region, Uganda point to an operator-friendly environment. That said, even low-regulation markets may have tax collection requirements, safety standards, or HOA rules that affect short-term rental operations. Always verify the latest short-term rental regulations and Airbnb license requirements directly with local government authorities for Entebbe to ensure full compliance before hosting.
(Source: AirROI data, 2026, finding no licensed listings among those analyzed)
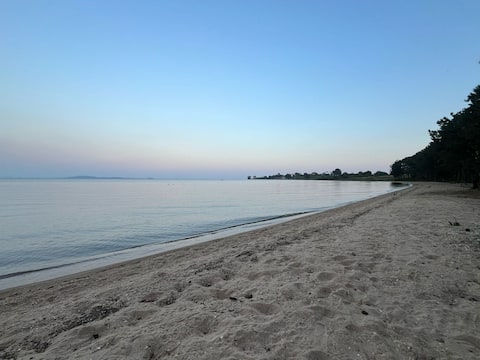
What Are the Best Neighborhoods for Airbnb in Entebbe?
Entebbe is a smaller vacation rental market where a handful of neighborhoods drive most of the booking activity. Choosing the right area is especially important in boutique markets — there is less room for a mediocre location to succeed on volume alone. The areas below highlight where short-term rental demand is strongest and why.
| Neighborhood / Area | Why Host Here? (Target Guests & Appeal) | Key Attractions & Landmarks |
|---|---|---|
| Entebbe Town | The central hub of Entebbe, known for its proximity to the airport and various amenities. It attracts both business travelers and tourists looking to explore Lake Victoria and it's relaxing beaches. | Entebbe Botanical Gardens, Lake Victoria, Victoria Mall, Ngambo Beach, Entebbe Wildlife Sanctuary |
| Kampala Road | A key route in Entebbe that allows easy access to the city while still being close to the airport. It offers shopping, dining, and local culture, making it appealing to visitors. | Shoprite Entebbe, Entebbe Golf Club, Pope Paul Memorial, Imperial Mall |
| Airport Road | Directly connects guests to Entebbe International Airport. It's ideal for those looking for convenience and quick access to flights, making it great for short stays. | Entebbe International Airport, Sky Beach, Munyonyo Beach, Kampala Lookout |
| Banga Beach | A popular spot for domestic tourists, Banga Beach offers relaxation areas and water sports. It provides a more local experience that's sought after during weekends and holidays. | Banga Beach, Lake Victoria water sports, Beachfront dining |
| Malaika Beach | Known for its serene environment and charming sunsets, Malaika Beach is a tranquil destination ideal for vacationers looking for relaxation away from the city life. | Malaika Beach, Sunset views, Beach lounges |
| Lutembe Beach | A favorite among locals and visitors for its clean sandy shores and recreational activities. It attracts nature lovers and beachgoers looking for a peaceful retreat. | Lutembe Beach, Bird watching, Picnic areas |
| Kisubi Beach | A charming beach that is popular with families and groups looking for a fun outing. It offers a variety of activities, including swimming and local food. | Kisubi Beach, Local restaurants, Beach games |
| Nyanza Golf Club | Combines leisure with recreational activities. Attractive for tourists who enjoy golf and outdoor activities, while also being close to other attractions. | Nyanza Golf Club, Entebbe wildlife walks, Bird watching |
With 8 distinct neighborhoods showing meaningful short-term rental activity, Entebbe offers diversification within a single market. Investors can tailor their strategy — from high-turnover tourist zones to quieter residential areas that attract longer stays and remote workers.
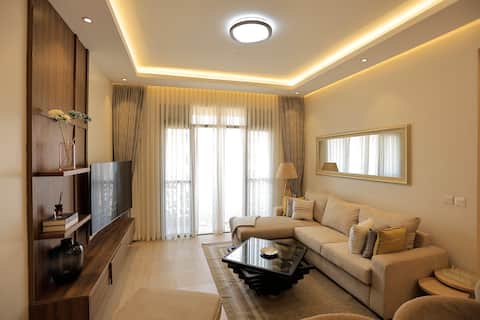
What Types of Properties Are on Airbnb in Entebbe?
Room Type Distribution
Property Type Distribution
Market Composition Insights for Entebbe
- The Entebbe Airbnb market composition is heavily skewed towards Entire Home/Apt listings, which make up 90.3% of the 72 active rentals. This indicates strong guest preference for privacy and space.
- Looking at the property type distribution in Entebbe, Apartment/Condo properties are the most common (65.3%), reflecting the local real estate landscape.
- Houses represent a significant 29.2% portion, catering likely to families or larger groups.
- Smaller segments like hotel/boutique, others (combined 5.6%) offer potential for unique stay experiences.
Entebbe Airbnb Room Capacity Analysis (2026): Bedroom Distribution
Distribution of Listings by Number of Bedrooms
Room Capacity Insights for Entebbe
- The dominant room capacity in Entebbe is 1 bedroom listings, making up 43.1% of the market. This suggests a strong demand for properties suitable for couples or solo travelers.
- Together, 1 bedroom and 2 bedrooms properties represent 75.0% of the active Airbnb listings in Entebbe, indicating a high concentration in these sizes.
Entebbe Vacation Rental Guest Capacity Trends (2026)
Distribution of Listings by Guest Capacity
Guest Capacity Insights for Entebbe
- The most common guest capacity trend in Entebbe vacation rentals is listings accommodating 2 guests (43.1%). This suggests the primary traveler segment is likely couples or solo travelers.
- Properties designed for 2 guests and 4 guests dominate the Entebbe STR market, accounting for 70.9% of listings.
- A significant 45.9% of listings cater specifically to 1-2 guests, highlighting strong demand from couples and solo travelers in Entebbe.
- 15.3% of properties accommodate 6+ guests, serving the market segment for larger families or group travel in Entebbe.
- On average, properties in Entebbe are equipped to host 3.3 guests.
How Do Listings in Entebbe Compare on Quality?
Listing quality in Entebbe can be approximated through presentation depth, bedroom count, and how often hosts disclose exact locations. These signals show how professionally the local supply base is merchandised.
Listing Quality Insights for Entebbe
- At 32.6 photos per listing on average, Entebbe hosts invest well in visual presentation. Listings with 20+ photos consistently outperform in search ranking and conversion.
- 47.2% of listings show their exact location. Lower disclosure rates can increase booking hesitation — guests want to know exactly where they are staying.
Recommendations for Hosts
- Enable exact location if possible — it removes a common source of guest uncertainty and can improve your listing's position in map-based searches.
- Use these quality indicators as a self-audit checklist. Listings that exceed the Entebbe averages across all three metrics are better positioned for premium pricing.
What Amenities Do Airbnb Guests Expect in Entebbe?
Amenity Prevalence
Amenity Insights for Entebbe
- Essential amenities in Entebbe that guests expect include: Free parking on premises, Wifi. Lacking these (any) could significantly impact bookings.
- Popular amenities like TV, Kitchen, Iron are common but not universal. Offering these can provide a competitive edge.
Recommendations for Hosts
- Ensure your listing includes all essential amenities for Entebbe: Free parking on premises, Wifi.
- Prioritize adding missing essentials: Free parking on premises, Wifi.
- Consider adding popular differentiators like TV or Kitchen to increase appeal.
- Highlight unique or less common amenities you offer (e.g., hot tub, dedicated workspace, EV charger) in your listing description and photos.
- Regularly check competitor amenities in Entebbe to stay competitive.
Which Airbnb Amenities Boost Revenue in Entebbe?
Not every amenity matters equally. This table focuses on the amenities most associated with higher revenue in Entebbe, which makes it more useful for prioritizing upgrades than a simple popularity list alone.
| Amenity | Prevalence | Revenue With | Revenue Without | Revenue Uplift |
|---|---|---|---|---|
Iron | 73.6% | $2,039 | $866 | 135.4% |
Self check-in | 61.1% | $2,209 | $975 | 126.6% |
Kitchen | 93.1% | $1,795 | $857 | 109.3% |
Resort accessHigh opportunity | 6.9% | $3,259 | $1,615 | 101.7% |
Washer | 69.4% | $2,037 | $1,032 | 97.4% |
Toaster | 27.8% | $2,598 | $1,395 | 86.2% |
Carbon monoxide alarm | 15.3% | $2,809 | $1,535 | 83.0% |
Coffee | 18.1% | $2,724 | $1,510 | 80.4% |
Extra pillows and blankets | 45.8% | $2,278 | $1,265 | 80.1% |
Bed linens | 63.9% | $2,055 | $1,153 | 78.2% |
Revenue Impact Insights for Entebbe
- Iron tops the revenue impact list with a 135.4% uplift — listings with this amenity earn $2,039 vs. $866 without it.
- High-opportunity amenities — Resort access — combine revenue uplift above 100% with prevalence under 10%, meaning most competitors haven't adopted them yet.
- Kitchen — while widespread — still correlate with meaningful revenue gains, making it table stakes rather than true differentiators.
Recommendations for Hosts
- Prioritize adding Resort access — it has the best combination of high revenue impact and low market saturation in Entebbe.
- Focus your upgrade budget on amenities in the top half of this table. Below-median amenities may improve guest experience but contribute less to revenue growth.
- Highlight revenue-impacting amenities prominently in your listing title, photos, and description — guests can't value what they don't notice.
Dive Deeper: Advanced Entebbe STR Market Data (2026)
Ready to unlock more insights? AirROI provides access to advanced metrics and comprehensive Airbnb data for Entebbe. Explore detailed analytics beyond this report to refine your investment strategy, optimize pricing, and maximize your vacation rental profits.
Explore Advanced MetricsEntebbe Airbnb Guest Demographics & Profile Analysis (2026)
Guest Profile Summary for Entebbe
- The typical guest profile for Airbnb in Entebbe consists of predominantly international visitors (85%), with top international origins including Uganda, typically belonging to the Post-2000s (Gen Z/Alpha) group (50%), primarily speaking English or French.
- Domestic travelers account for 15.3% of guests.
- Key international markets include United States (15.8%) and Uganda (15.3%).
- Top languages spoken are English (48%) followed by French (13.5%).
- A significant demographic segment is the Post-2000s (Gen Z/Alpha) group, representing 50% of guests.
Recommendations for Hosts
- Focus marketing internationally, particularly towards travelers from Uganda.
- Tailor amenities and listing descriptions to appeal to the dominant Post-2000s (Gen Z/Alpha) demographic (e.g., highlight fast WiFi, smart home features, local guides).
- Highlight unique local experiences or amenities relevant to the primary guest profile.
- Consider seasonal promotions aligned with peak travel times for key origin markets.
What Are Airbnb Guest Ratings in Entebbe?
Listings in Entebbe average 4.64 out of 5 overall, with about 9.3 reviews per active listing and 19.4% of listings carrying the Guest Favorite badge.
Rating Breakdown by Category
Guest Rating Insights for Entebbe
- An average rating of 4.64 places Entebbe in solid territory. Most guests leave satisfied, though there is room for hosts to push toward the top tier.
- The strongest subcategory is Communication (4.78), while Location (4.59) trails behind — a useful signal for hosts looking to prioritize upgrades.
- 19.4% of listings carry the Guest Favorite badge, a strong trust signal that can meaningfully lift click-through and booking rates.
Recommendations for Hosts
- Focus improvement efforts on Location — even small gains in the weakest subcategory can lift overall ratings and search ranking.
- Encourage guests to leave reviews after checkout. Listings with more reviews rank higher in search results and convert browsers into bookers more effectively.
- With only 19.4% of listings earning Guest Favorite status, hosts who consistently exceed expectations have a clear competitive advantage.
Entebbe Airbnb Booking Patterns (2026): Available vs. Booked Days
Available Days Distribution
Booked Days Distribution
Booking Pattern Insights for Entebbe
- The most common availability pattern in Entebbe falls within the 271-366 days range, representing 91.7% of listings. This suggests many properties have significant open periods on their calendars.
- Approximately 100.0% of listings show high availability (181+ days open annually), indicating potential for increased bookings or specific owner usage patterns.
- For booked days, the 31-90 days range is most frequent in Entebbe (45.8%), reflecting common guest stay durations or potential owner blocking patterns.
How Far in Advance Do Guests Book Airbnb in Entebbe?
Average Booking Lead Time by Month
Booking Lead Time Insights for Entebbe
- The overall average booking lead time for vacation rentals in Entebbe is 13 days.
- Guests book furthest in advance for stays during April (average 21 days), likely coinciding with peak travel demand or local events.
- The shortest booking windows occur for stays in December (average 7 days), indicating more last-minute travel plans during this time.
- Seasonally, Spring (16 days avg.) sees the longest lead times, while Winter (13 days avg.) has the shortest, reflecting typical travel planning cycles.
Recommendations for Hosts
- Use the overall average lead time (13 days) as a baseline for your pricing and availability strategy in Entebbe.
- Target marketing efforts for the Spring season well in advance (at least 16 days) to capture early planners.
- Monitor your own booking lead times against these Entebbe averages to identify opportunities for dynamic pricing adjustments.
What Is the Average Length of Stay for Airbnb in Entebbe?
Guests in Entebbe stay about 5.9 nights on average, generating roughly 430 reservations and 6 bookings per listing in the latest AirROI dataset. The most common check-in time is 3:00 PM and check-out is 11:00 AM.
Monthly Length of Stay in Entebbe
Check-in Time Distribution
Check-out Time Distribution
Stay Pattern Insights for Entebbe
- A mid-range stay length points to leisure-driven demand — weekend getaways and short vacations. Hosts should optimize for quick turnover efficiency while keeping the guest experience smooth.
- Stay lengths peak in Oct (7.9 nights) and shorten in Nov (1.8 nights). Adjust minimum-night requirements seasonally to match.
Recommendations for Hosts
- Leverage the longer-stay pattern by offering weekly discounts — even 5-10% off can convert browsing into bookings for guests considering an extended stay.
- Set your check-in time to match or beat the market standard of 3:00 PM. Offering early check-in flexibility can be a low-cost differentiator.
- Monitor length-of-stay seasonality to adjust minimum-night requirements — longer minimums during peak periods maximize revenue while shorter minimums fill gaps in shoulder seasons.
Entebbe Airbnb Minimum Stay Requirements Analysis
Distribution of Listings by Minimum Night Requirement
1 Night
54 listings
75% of total
2 Nights
9 listings
12.5% of total
4-6 Nights
2 listings
2.8% of total
30+ Nights
7 listings
9.7% of total
Key Insights
- The most prevalent minimum stay requirement in Entebbe is 1 Night, adopted by 75% of listings. This highlights the market's preference for shorter, flexible bookings.
- A strong majority (87.5%) of the Entebbe Airbnb data shows acceptance of very short stays (1-2 nights), indicating a dynamic, high-turnover market.
Recommendations
- Align with the market by considering a 1 Night minimum stay, as 75% of Entebbe hosts use this setting.
- Explore offering discounts for stays of 30+ nights to attract the 9.7% of the market seeking extended stays.
- Adjust minimum nights based on seasonality – potentially shorter during low season and longer during peak demand periods in Entebbe.
Entebbe Airbnb Cancellation Policy Trends Analysis (2026)
Limited
2 listings
2.8% of total
Flexible
53 listings
73.6% of total
Moderate
9 listings
12.5% of total
Firm
7 listings
9.7% of total
Strict
1 listings
1.4% of total
Cancellation Policy Insights for Entebbe
- The prevailing Airbnb cancellation policy trend in Entebbe is Flexible, used by 73.6% of listings.
- The market strongly favors guest-friendly terms, with 86.1% of listings offering Flexible or Moderate policies. This suggests guests in Entebbe may expect booking flexibility.
- Strict cancellation policies are quite rare (1.4%), potentially making listings with this policy less competitive unless justified by high demand or property type.
Recommendations for Hosts
- Consider adopting a Flexible policy to align with the 73.6% market standard in Entebbe.
- Given the high prevalence of Flexible policies (73.6%), offering this can enhance booking appeal, especially during shoulder seasons.
- Using a Strict policy might deter some guests, as only 1.4% of listings use it. Evaluate if potential revenue protection outweighs possible lower booking rates.
- Regularly review your cancellation policy against competitors and market demand shifts in Entebbe.
How Much Are Airbnb Cleaning Fees in Entebbe?
Cleaning fees in Entebbe are meaningful operating levers, not just pass-through charges. What matters most is how often hosts charge them, how high they run relative to market norms, and how large a share of gross revenue they consume.
Cleaning Fee Insights for Entebbe
- Only 25.0% of listings charge a cleaning fee, suggesting that most hosts in Entebbe bundle cleaning costs into the nightly rate.
- The average cleaning fee of $8 is close to the median ($5), suggesting a relatively consistent fee structure across the market.
- Cleaning fees represent 2.8% of gross revenue on average — a modest component of the overall booking price.
Recommendations for Hosts
- Price your cleaning fee competitively against the Entebbe median of $5. Fees significantly above market norms can deter bookings, especially for shorter stays.
- Monitor competitor cleaning fees regularly. Airbnb's search algorithm factors in total price, so a well-calibrated cleaning fee can improve your listing's ranking.
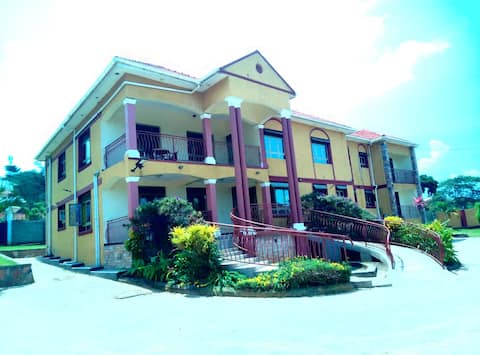
What Do the Top Airbnb Listings in Entebbe Look Like?
Benchmark your potential! Explore examples of top-performing Airbnb properties in Entebbebased on Trailing Twelve Month (TTM) revenue. Analyze their characteristics, revenue, occupancy rate, and ADR to understand what drives success in this market.
Scenic Serenity at Pearl Marina, Entebbe
Entire Place • 3 bedrooms
Luxe by the Lake |Pearl Marina | Family Vacation
Entire Place • 3 bedrooms
MsgrLakeview villa
Entire Place • 10 bedrooms
Spacious 2BR Apt | 9 mins to Airport & UN Base
Entire Place • 2 bedrooms

ImelaHomes(Ntorana) Near Airport
Entire Place • 2 bedrooms

A modern 3 bedroom stand alone
Entire Place • 3 bedrooms
Note: Performance varies based on location, size, amenities, seasonality, and management quality. Data reflects the past 12 months.
Who Are the Top Airbnb Hosts in Entebbe?
Learn from the best! This table showcases top-performing Airbnb hosts in Entebbe based on the number of properties managed and estimated total revenue over the past year. Analyze their scale and performance metrics.
| Host Name | Properties | Grossing Revenue | Stay Reviews | Avg Rating |
|---|---|---|---|---|
| Paul | 4 | $12,640 | 22 | 4.84/5.0 |
| Ruth Pamella | 5 | $10,087 | 87 | 4.46/5.0 |
| Namirembe Majorine | 4 | $7,109 | 46 | 4.77/5.0 |
| Kasande | 2 | $6,639 | 18 | 4.67/5.0 |
| Sharon | 2 | $6,566 | 8 | 4.00/5.0 |
| Julius | 1 | $6,265 | 9 | 4.78/5.0 |
| Joy | 1 | $6,061 | 5 | 5.00/5.0 |
| Rebecca | 2 | $4,330 | 18 | 4.96/5.0 |
| Proscovia | 1 | $4,180 | 5 | 5.00/5.0 |
| Yvonne | 3 | $3,982 | 40 | 4.66/5.0 |
Analyzing the strategies of top hosts, such as their property selection, pricing, and guest communication, can offer valuable lessons for optimizing your own Airbnb operations in Entebbe.
Who Are the Airbnb Hosts in Entebbe?
Entebbe has a relatively balanced host base.
Host Profile Insights for Entebbe
- Only 27.8% of hosts hold Superhost status, suggesting a relatively young or casual market where quality improvements can pay outsized dividends.
- 15.3% of listings have Instant Book enabled. Lower Instant Book adoption means many guests must request approval, which can slow conversions.
- 73.6% of listings use Airbnb's simplified pricing (host-only fee), where the host pays the entire platform service fee and the guest sees one all-in price with no separate Airbnb service charge. High adoption signals a professional, PMS-connected host base — Airbnb mandates simplified pricing for software-connected listings.
Recommendations for Hosts
- Earning Superhost status can significantly improve search ranking and guest trust. Focus on maintaining high response rates, low cancellations, and strong reviews.
- Consider enabling Instant Book — it reduces booking friction and Airbnb's algorithm tends to favor Instant Book listings in search results.
- With 20.8% cohosted listings, there may be a growing local market for property management services.
- Benchmark your host metrics against these Entebbe averages regularly and adjust your hosting strategy based on what top performers do differently.
How Does Entebbe's Airbnb Market Compare to Nearby Cities?
How does the Entebbe Airbnb market stack up against its neighbors? Compare key performance metrics like average monthly revenue, ADR, and occupancy rates in surrounding areas to understand the broader regional STR landscape.
Compared with Naalya Estate, Entebbe has 7 percentage points lower occupancy and about $5 higher ADR. That helps frame whether this market is winning more on demand, pricing, or both.
| Market | Active Properties | Monthly Revenue | Daily Rate | Avg. Occupancy |
|---|---|---|---|---|
| Naalya Estate Village | 13 | $280 | $58.71 | 31% |
| Jinja | 74 | $274 | $78.53 | 23% |
| Entebbe City | 132 | $235 | $51.35 | 28% |
| Jinja City | 14 | $229 | $63.65 | 20% |
| Kampala | 1,081 | $190 | $49.06 | 30% |
| Kira | 38 | $188 | $38.88 | 28% |
| Naalya Estate | 11 | $184 | $41.54 | 35% |
| Wakiso | 11 | $129 | $74.43 | 27% |
| Najeera Bulabira | 11 | $79 | $31.62 | 23% |
| Kira Town | 12 | $56 | $30.13 | 27% |
Frequently Asked Questions About Airbnb in Entebbe
These quick answers summarize the most common investor and operator questions using AirROI's latest market data for Entebbe.
How much do Airbnb hosts make in Entebbe?
Entebbe hosts earn about $1,729 per year on average, with an average nightly rate of $47 and RevPAR of $13. Those figures describe the typical revenue environment for active listings in Entebbe, Central Region, not the ceiling for the best operators. Source: AirROI 2026 data, Entebbe market, July 2025 to June 2026.
What is the average Airbnb occupancy rate in Entebbe?
The average Airbnb occupancy rate in Entebbe is 27.6%. December is the strongest month and August is the softest, so hosts should expect demand to move meaningfully throughout the year rather than stay flat.
What is the average Airbnb daily rate in Entebbe?
Listings in Entebbe average $47 per night. The broader pricing spread also matters: lower-performing listings cluster closer to the lower quartiles, while premium homes can price materially above the city average when demand spikes or listing quality stands out.
How many Airbnb listings are active in Entebbe?
Entebbe currently has about 72 active Airbnb listings in AirROI's market dataset. That supply count helps explain how competitive the market is, how much depth there is for benchmarking, and whether the market behaves like a niche destination or a scaled urban market.
How strict are short-term rental regulations in Entebbe?
AirROI currently classifies the short-term rental regulation level in Entebbe as Low. The dataset also shows about 0.0% of listings with registration evidence. That is a market signal, not legal advice, so hosts should still confirm current licensing and compliance rules locally before listing.
What is the RevPAR for Airbnb in Entebbe?
RevPAR in Entebbe is about $13. That metric combines pricing and occupancy into one efficiency number, so it is often a better quick benchmark than ADR alone when investors want to compare how well listings convert nightly rates into realized revenue.
Is Airbnb profitable in Entebbe?
Occupancy of 27.6% means Entebbe is a more selective market. Profitability is achievable but requires careful cost management, premium positioning, or targeting longer stays to reduce turnover. Average annual revenue is $1,729, but individual returns depend on property type, location within the city, and the host's operating efficiency.
How far in advance do guests book Airbnb in Entebbe?
The average booking lead time in Entebbe is about 13 days — a relatively short booking window, meaning most guests decide within a few weeks of their trip — dynamic pricing can capture late demand. Hosts who understand their market's booking cadence can adjust minimum stays and pricing windows accordingly.
What are the best neighborhoods for Airbnb in Entebbe?
Based on AirROI's analysis, some of the top neighborhoods for short-term rentals in Entebbe include Entebbe Town, Kampala Road, Airport Road. Each area attracts different guest profiles — from business travelers to leisure visitors — so the best location depends on the property type and target audience a host is aiming for. See the full neighborhood breakdown above.
What type of property performs best on Airbnb in Entebbe?
entire_home listings make up 90.3% of the active supply in Entebbe. The most common configuration does not always mean the most profitable — operators who identify underserved property types or bedroom counts can sometimes outperform the market average by filling a gap in local supply.
How does Entebbe compare to nearby Airbnb markets?
Among neighboring markets, Naalya Estate Village posts $3,362 in average annual revenue with 31.1% occupancy, compared to Entebbe's $1,729 and 27.6%. Comparing nearby markets helps investors understand whether a destination's performance reflects local demand or broader regional trends.
What is the average length of stay in Entebbe?
The average Airbnb stay length in Entebbe is about 5.9 nights. That matters for turnover, cleaning operations, and pricing strategy because shorter stays increase changeovers while longer stays can smooth occupancy and reduce operational friction.
What is the average Airbnb guest rating in Entebbe?
Airbnb listings in Entebbe average 4.64 out of 5 overall. About 19.4% of listings carry the guest favorite badge, which suggests a meaningful share of inventory is competing on review quality rather than price alone.
Which amenities boost Airbnb revenue in Entebbe?
Iron and Self check-in are among the strongest revenue-linked amenities in Entebbe. In AirROI's latest dataset, listings with these amenities outperform those without on average revenue, which makes amenities analysis useful for prioritizing investment and listing upgrades.
Do Airbnb hosts charge cleaning fees in Entebbe?
Yes. About 25.0% of active Airbnb listings in Entebbe charge a cleaning fee, and the average fee is $8. The more important operating benchmark is how much of gross revenue that fee consumes, not just the absolute dollar amount.
What percentage of Airbnb hosts are Superhosts in Entebbe?
At 27.8%, there is a healthy mix of experienced and newer hosts — earning Superhost status can still provide a meaningful visibility boost.
About AirROI Market Data
AirROI tracks over 20 million properties across 190+ countries and maintains 15+ years of historical performance data, making it one of the deepest Airbnb and STR intelligence platforms available. The analytics pipeline aggregates listing-level data monthly — revenue, occupancy, nightly rates, RevPAR, guest demographics, booking patterns, and competitive supply — so investors and operators can benchmark any market against its own history and against neighboring destinations.
Real estate investors, property managers, financial institutions, hedge funds, tourism boards, hospitality consultants, tech platforms, and academic researchers rely on AirROI data to underwrite acquisitions, optimize pricing, model macro trends, and conduct peer-reviewed research. Data is available through in-depth market reports like this one and the Airbnb API with 22 endpoints and an Airbnb MCP Server for AI agents.
AirROI proprietary analytics as of 2026-06-30. Metrics reflect trailing twelve-month aggregates from active listings. Revenue figures are market averages, not projections. Neighborhood descriptions are AI-generated and reviewed for accuracy. For full methodology, see the data methodology page.