
Airbnb Lead Time Data 2026: Why Guests Book 17 Days Out in Austin but 65 Days Out in Destin
The Airbnb booking window -- the number of days between when a guest reserves and when they check in -- is contracting across the industry in 2026. AirROI's analysis of airbnb lead time data across 10 major US markets reveals a 1.8x gap between the shortest and longest booking windows, with urban markets compressing to median lead times of just 17-20 days in January. The national average has dropped to 29 days according to PriceLabs, and the shift is structural, not seasonal.
Yet most hosts still price their calendars as if bookings arrive 60-90 days out. That mismatch between assumption and reality is where revenue leaks happen -- not from weaker demand, but from mistimed pricing. Here is what the data actually shows across 10 US markets, and what to do about it.
The Booking Window Shift: What the 2026 Data Shows
Booking lead times have declined 10-15% globally, with the compression most pronounced in stays rather than flights. According to PriceLabs' 2026 revenue management analysis, the gap between book date and stay date has narrowed consistently since 2023. Lighthouse data confirms the trend: the share of US travelers who finalized bookings within two weeks of travel rose from 29% in Q3 2024 to 34% in Q3 2025, while searches made within 28 days of stay increased 9% from Q1 2023 to Q4 2025.
AirROI's dataset provides the first granular, market-level view of this shift. Using 24 months of booking lead time data across 10 major US markets -- four urban, two coastal, and four leisure -- we quantified exactly how far in advance guests book in each market and how that window changes by season.
| Market | Type | Avg Lead Time | Median Lead Time (Jan '26) | Avg LOS | ADR | Occupancy | Active Listings |
|---|---|---|---|---|---|---|---|
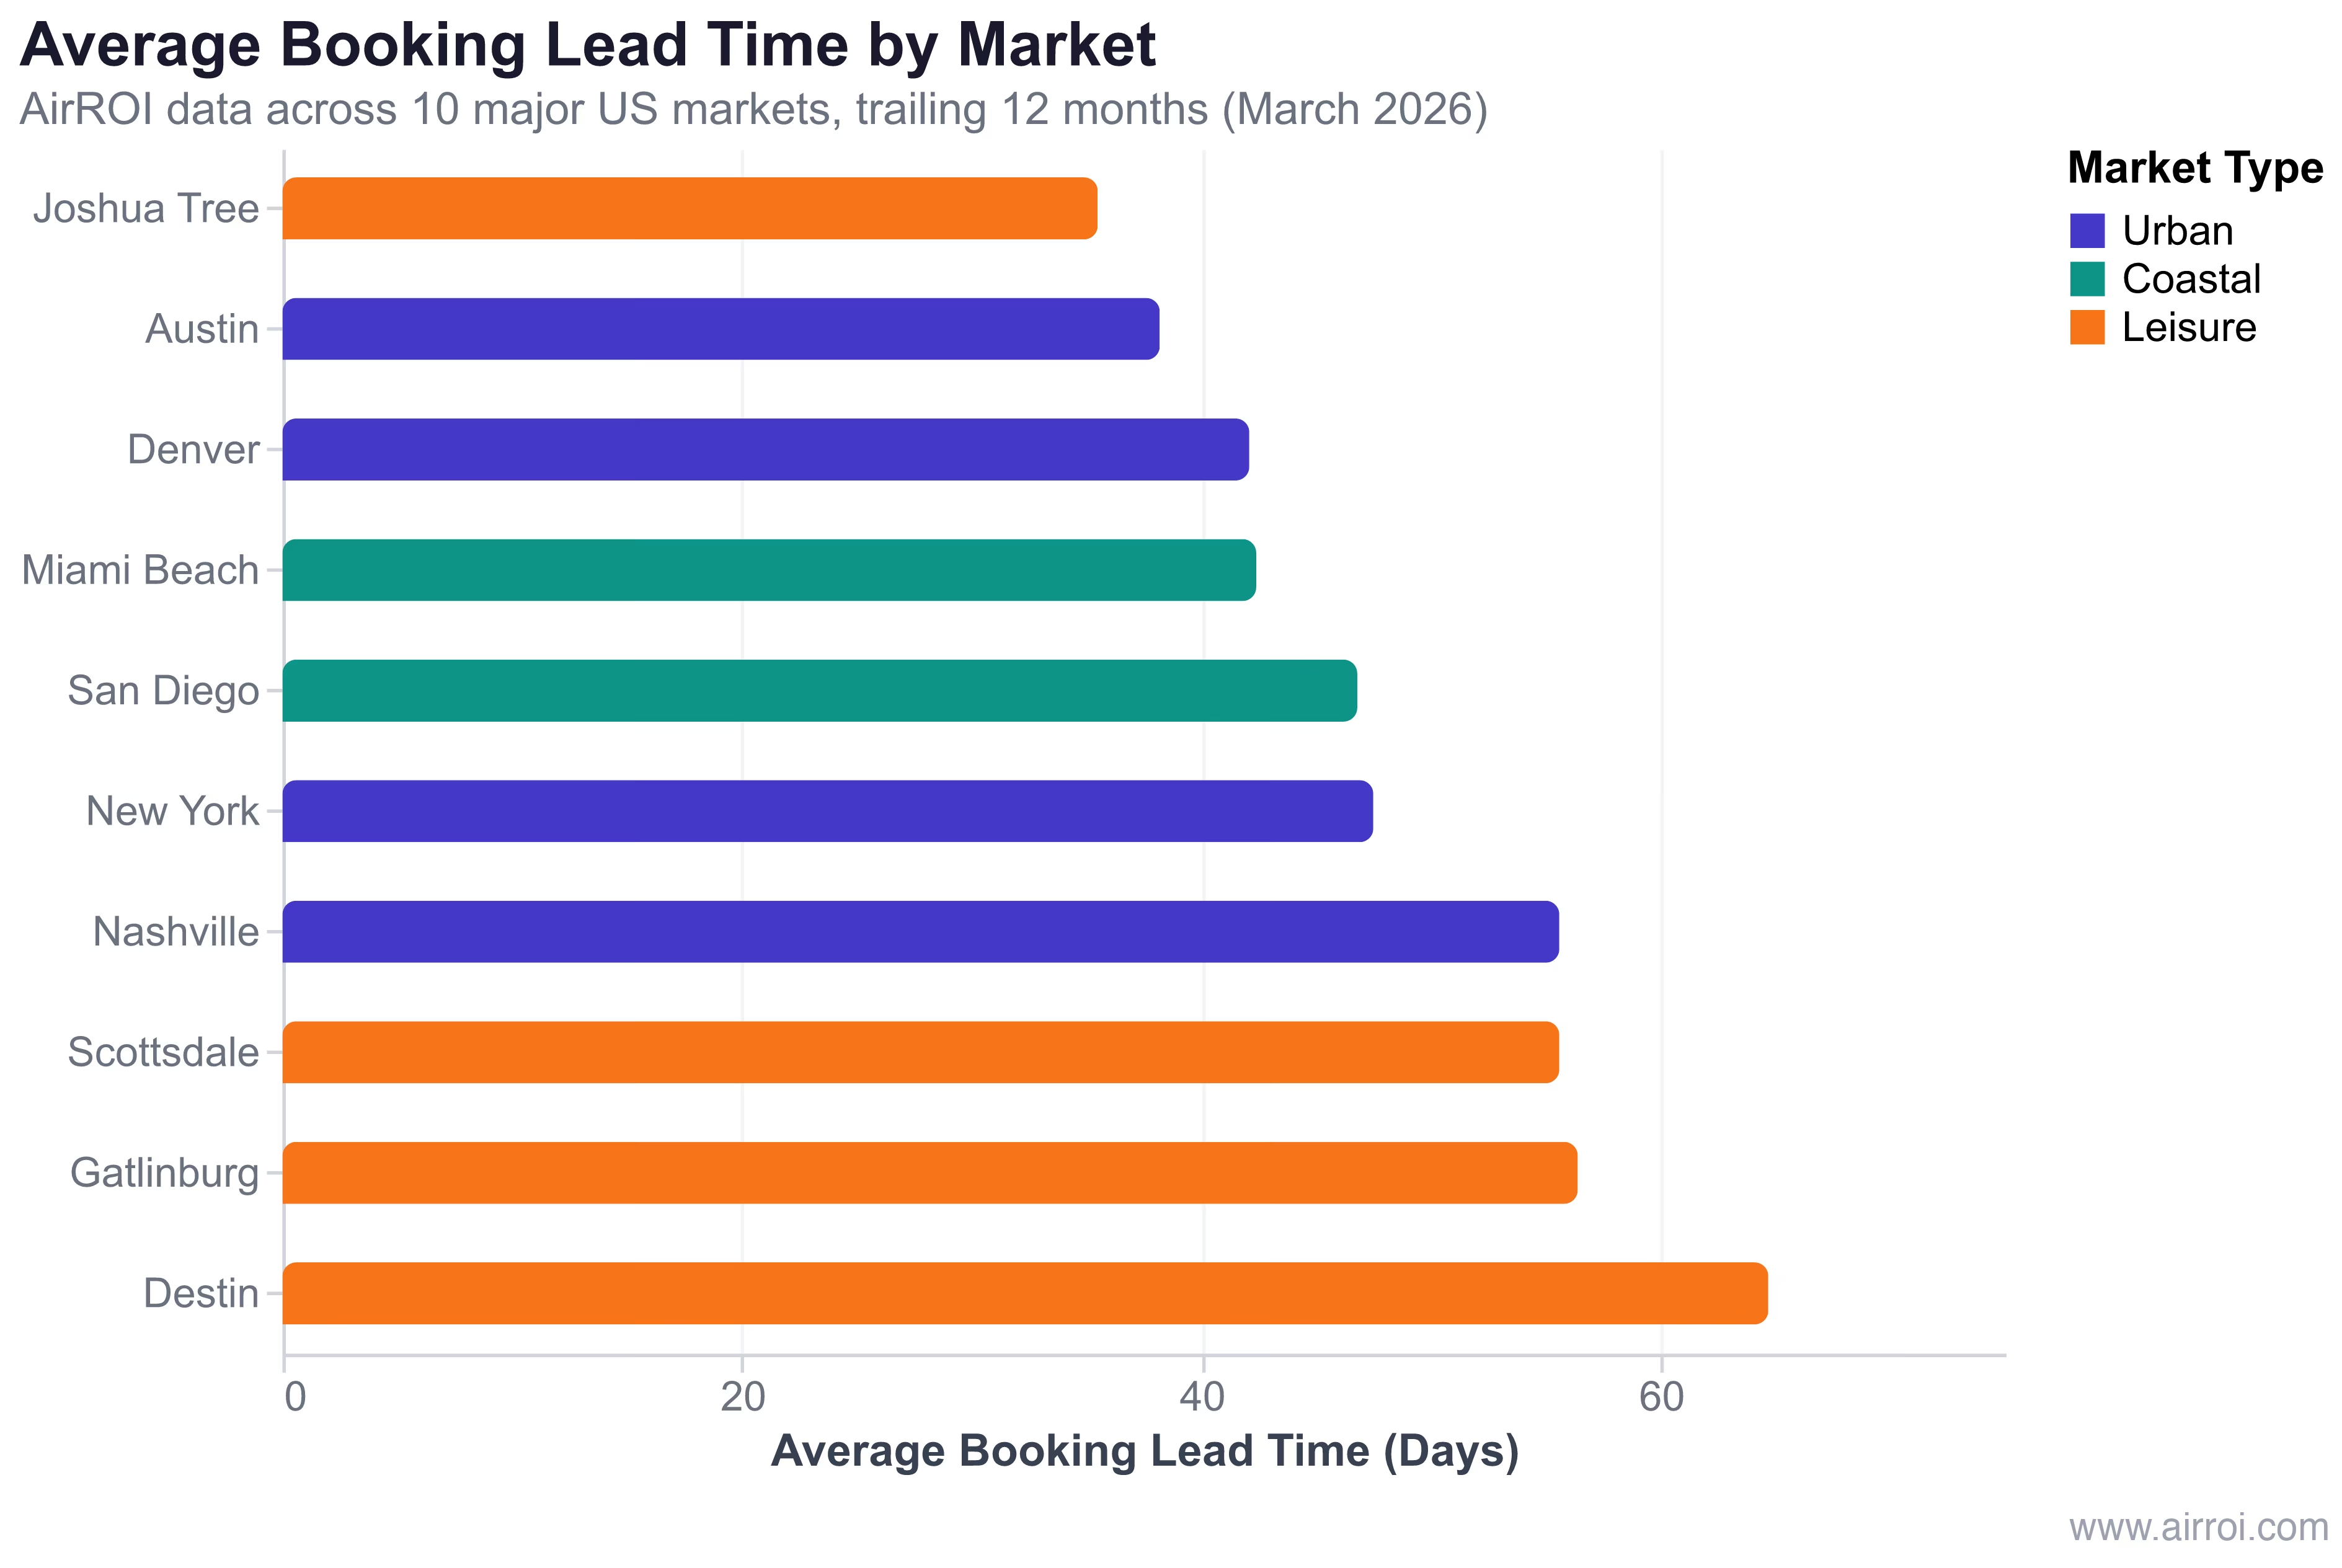
| Joshua Tree | Leisure | 35.5 days | 22 days | 2.9 nights | $336 | 48% | 1,276 |
| Austin | Urban | 38.2 days | 17 days | 5.7 nights | $294 | 45% | 9,964 |
| Denver | Urban | 42.1 days | 19 days | 6.8 nights | $218 | 54% | 4,132 |
| Miami Beach | Coastal | 42.4 days | 28 days | 4.3 nights | $361 | 46% | 4,528 |
| San Diego | Coastal | 46.8 days | 23 days | 5.6 nights | $392 | 53% | 10,449 |
| New York | Urban | 47.5 days | 17 days | 10.5 nights | $225 | 51% | 12,475 |
| Nashville | Urban | 55.6 days | 20 days | 3.8 nights | $347 | 47% | 6,845 |
| Scottsdale | Leisure | 55.6 days | 38 days | 5.9 nights | $413 | 49% | 4,689 |
| Gatlinburg | Leisure | 56.4 days | 27 days | 3.4 nights | $367 | 48% | 3,787 |
| Destin | Leisure | 64.7 days | 22 days* | 4.9 nights | $462 | 44% | 3,985 |
*Destin's January median is low due to off-season; peak-season median exceeds 57 days.
The spread is stark: Joshua Tree's 35.5-day average sits nearly half of Destin's 64.7 days. But the averages mask an even more important signal -- the percentile distribution. In Austin during January 2026, 25% of bookings arrived within just 4 days of check-in.
"Booking windows are compressing across the industry. This is a structural shift, not a temporary pattern." -- PriceLabs, 2026 Short-Term Rental Trends Guide
Market-by-Market Breakdown: The Urban vs. Leisure Divide
Urban markets book the fastest, with median January 2026 lead times of 17-20 days, while planned vacation destinations maintain booking windows 2-3x longer. The division maps to traveler behavior: urban trips are spontaneous weekend decisions; leisure market trips are family vacations planned months ahead.
Urban markets (Nashville, Austin, Denver, New York) share a pattern: short booking windows (38-56 day averages), heavy weekend concentration, and event-driven demand spikes. Austin's 38.2-day average is the lowest among urban markets, reflecting its year-round event calendar -- SXSW, ACL, and Formula 1 create predictable spikes but don't extend the baseline booking window. Denver follows at 42.1 days, driven by business and weekend traveler mix.
Coastal markets (Miami Beach, San Diego) occupy the middle ground at 42-47 days. These markets blend spontaneous weekend traffic with planned vacation demand. San Diego's 46.8-day average reflects its dual role as a local weekend escape and a national vacation destination.
Leisure markets (Gatlinburg, Scottsdale, Destin, Joshua Tree) range widely from 35.5 to 64.7 days. Destin leads with the longest windows because Gulf Coast beach vacations are planned family trips -- summer bookings arrive 60-80 days ahead. Scottsdale's 55.6-day average reflects its winter-season snowbird demand, booked months in advance.
Joshua Tree is the outlier: a leisure market with the dataset's shortest booking window. At 35.5 days, it behaves like an urban market because its demand is drive-to weekend traffic from Los Angeles and San Diego, not planned family vacations. This underscores that booking window is determined by traveler behavior, not property location.
The January Test: When Markets Show Their True Colors
January strips away seasonal demand and reveals each market's baseline booking behavior. The January 2026 median lead times tell the story:
- Austin: 17 days -- a quarter of bookings arrived within 4 days
- New York: 17 days -- driven by extended-stay and last-minute business travelers
- Denver: 19 days -- midwinter compression before ski season bookings
- Nashville: 20 days -- post-holiday lull in a weekend-driven market
- Scottsdale: 38 days -- the exception, with snowbird season maintaining advance bookings
If your market's January median is under 21 days, your pricing tool must react in real time, not weekly.
Seasonal Lead Time Swings: A 4.2x Range in Scottsdale
Scottsdale's booking window ranges from 18.9 days in July to 79.3 days in March -- a 4.2x seasonal swing that demands entirely different pricing strategies by season. Every market in the dataset shows seasonal variation, but the magnitude differs dramatically.
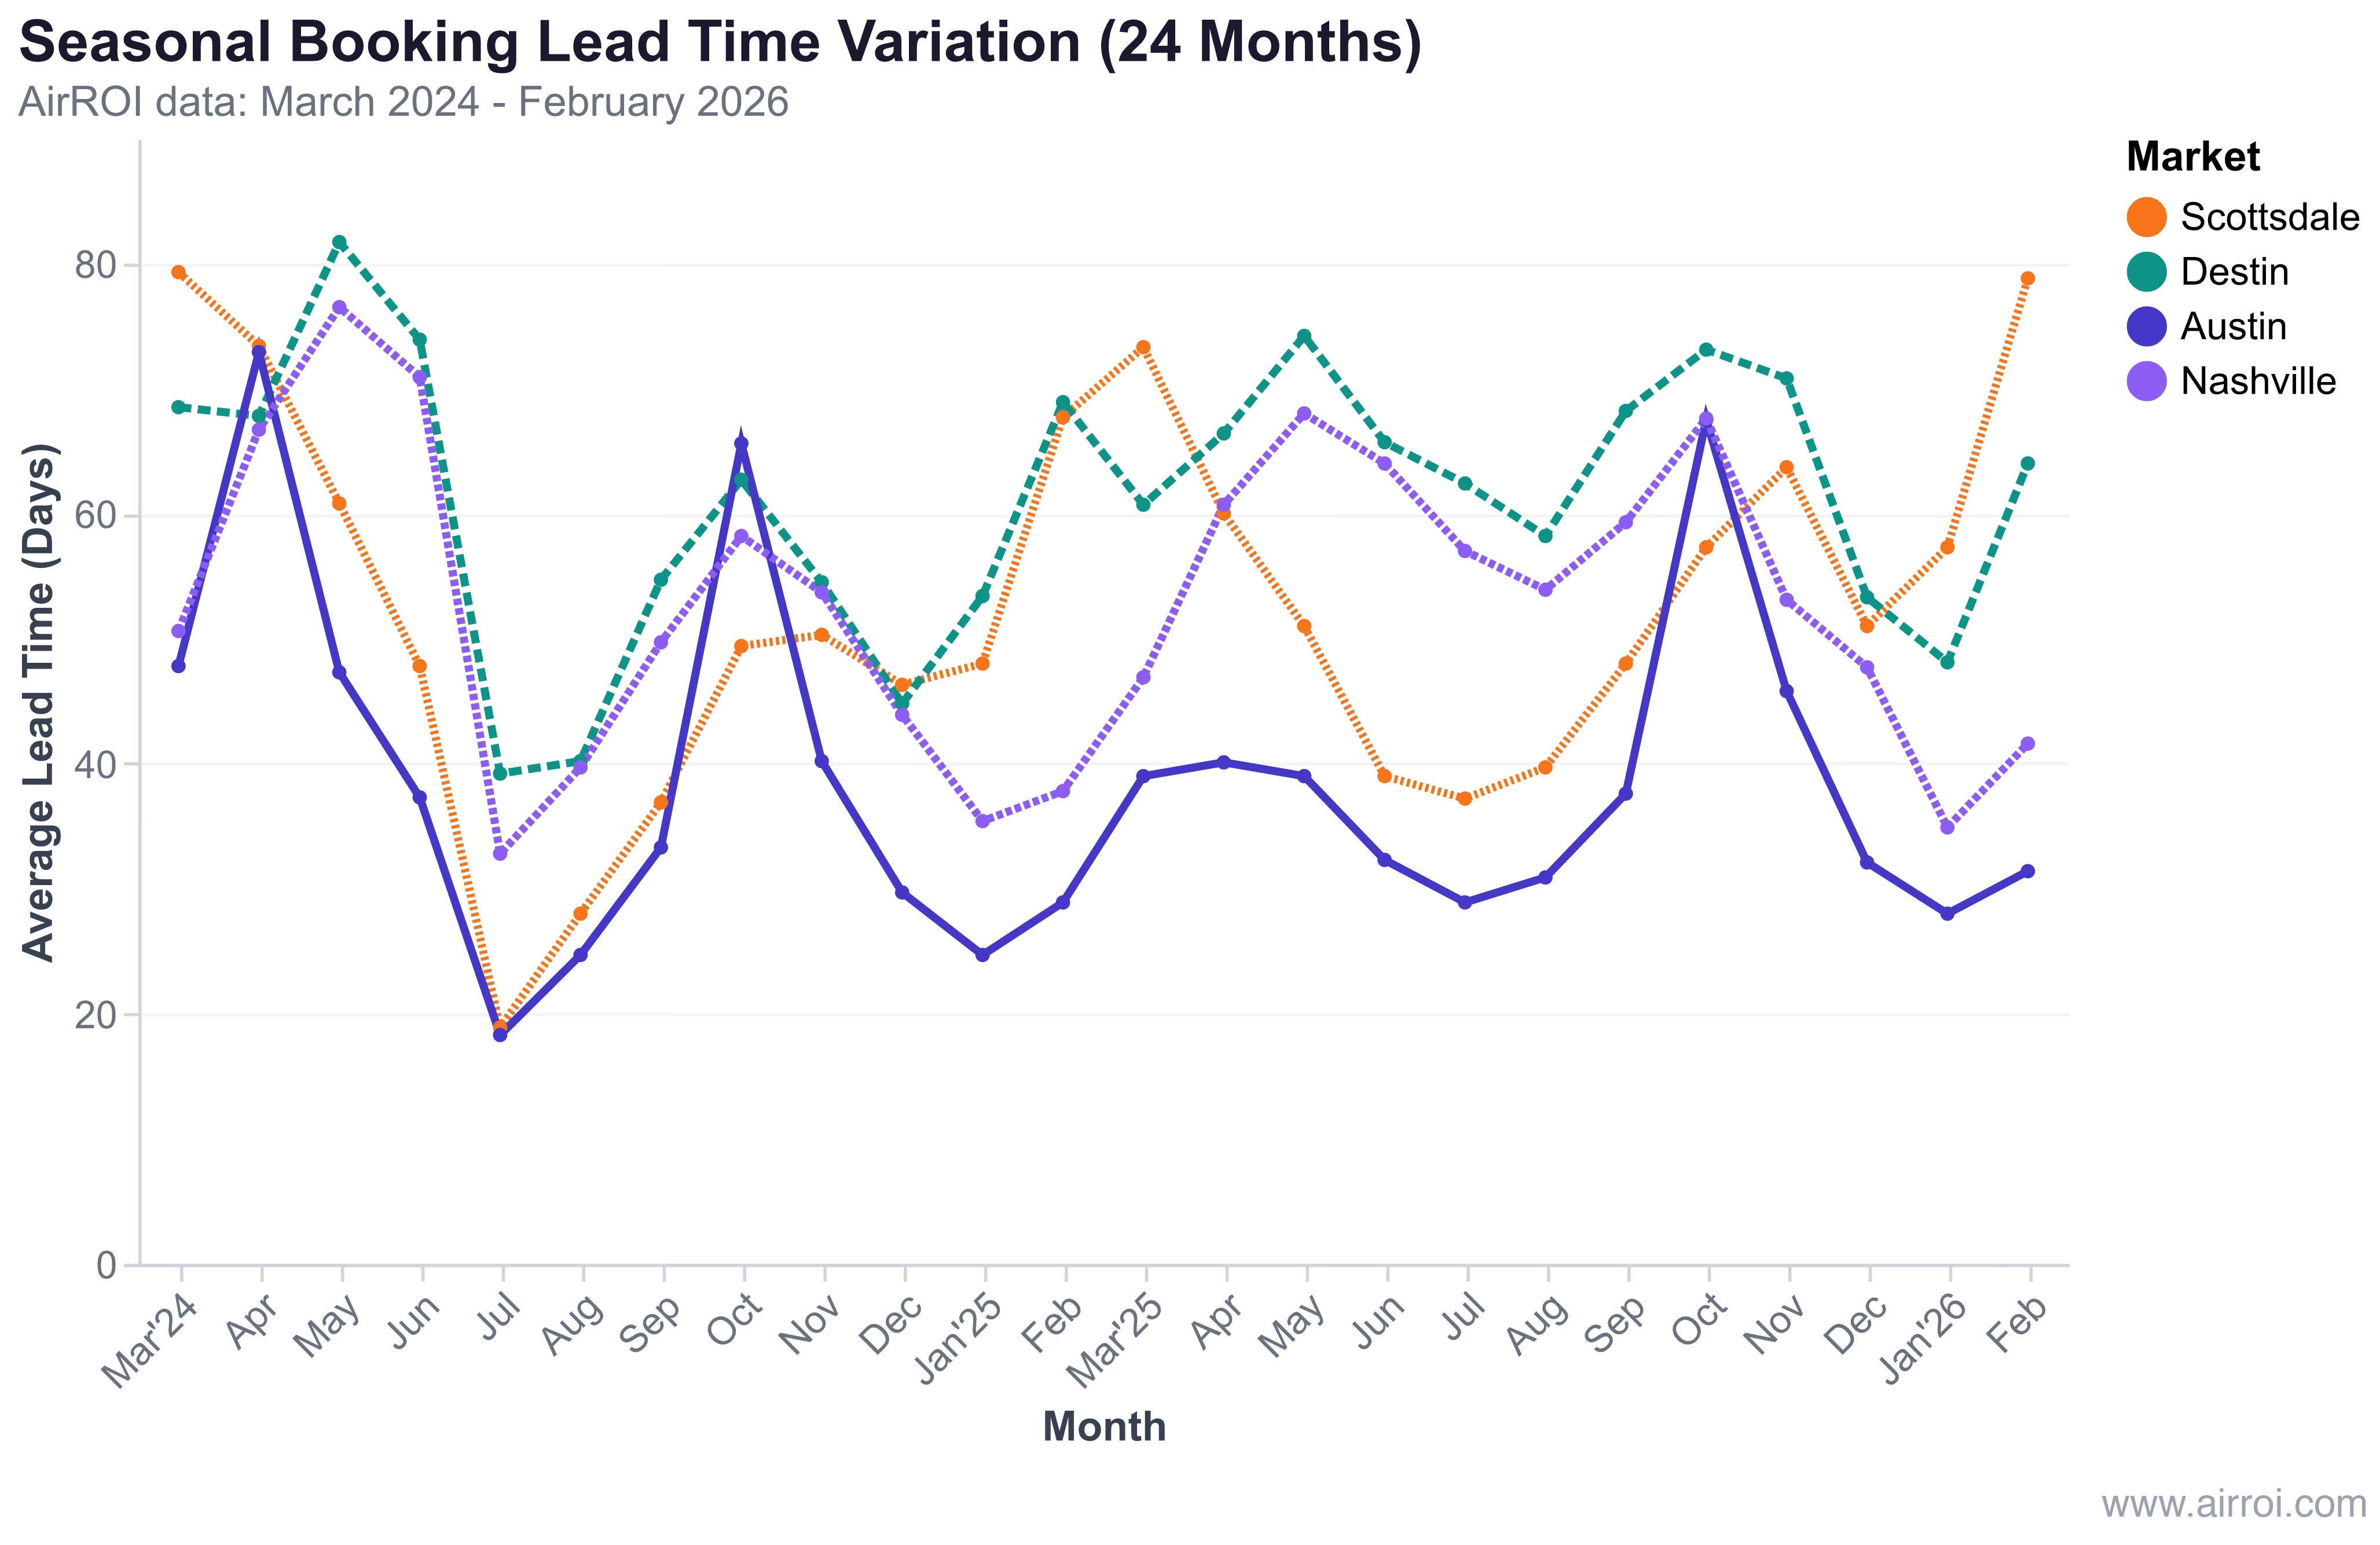
Destin shows a similarly pronounced pattern: May 2024 bookings averaged 81.7 days of lead time (summer beach trips planned in March), while January 2026 bookings averaged just 48.1 days. Austin's seasonal swing is event-driven rather than weather-driven -- October lead times spike to 65-68 days around ACL and Formula 1, while summer months drop to 28-33 days.
"These trends are not slowing down. Shorter stays, tighter booking windows, and a consumer who shops harder before committing; this is the baseline you are working with in 2026." -- Jonathan Gough, Lighthouse Hotel Booking Trends Report
The implication is clear: a single pricing strategy cannot serve all twelve months. Hosts in markets with high seasonal swing need season-specific pricing timelines -- holding firm rates far longer during high-demand months and discounting more aggressively in shoulder periods.
Shorter Windows, Shorter Stays: The Length-of-Stay Connection
Markets with shorter booking windows tend toward shorter stays, creating a compounding operational challenge. AirROI data shows Joshua Tree (35.5-day lead time) averages just 2.9 nights per stay, while Destin (64.7-day lead time) averages 4.9 nights. Nashville at 3.4-3.8 nights and Gatlinburg at 3.4 nights reinforce the pattern among short-to-medium window markets.
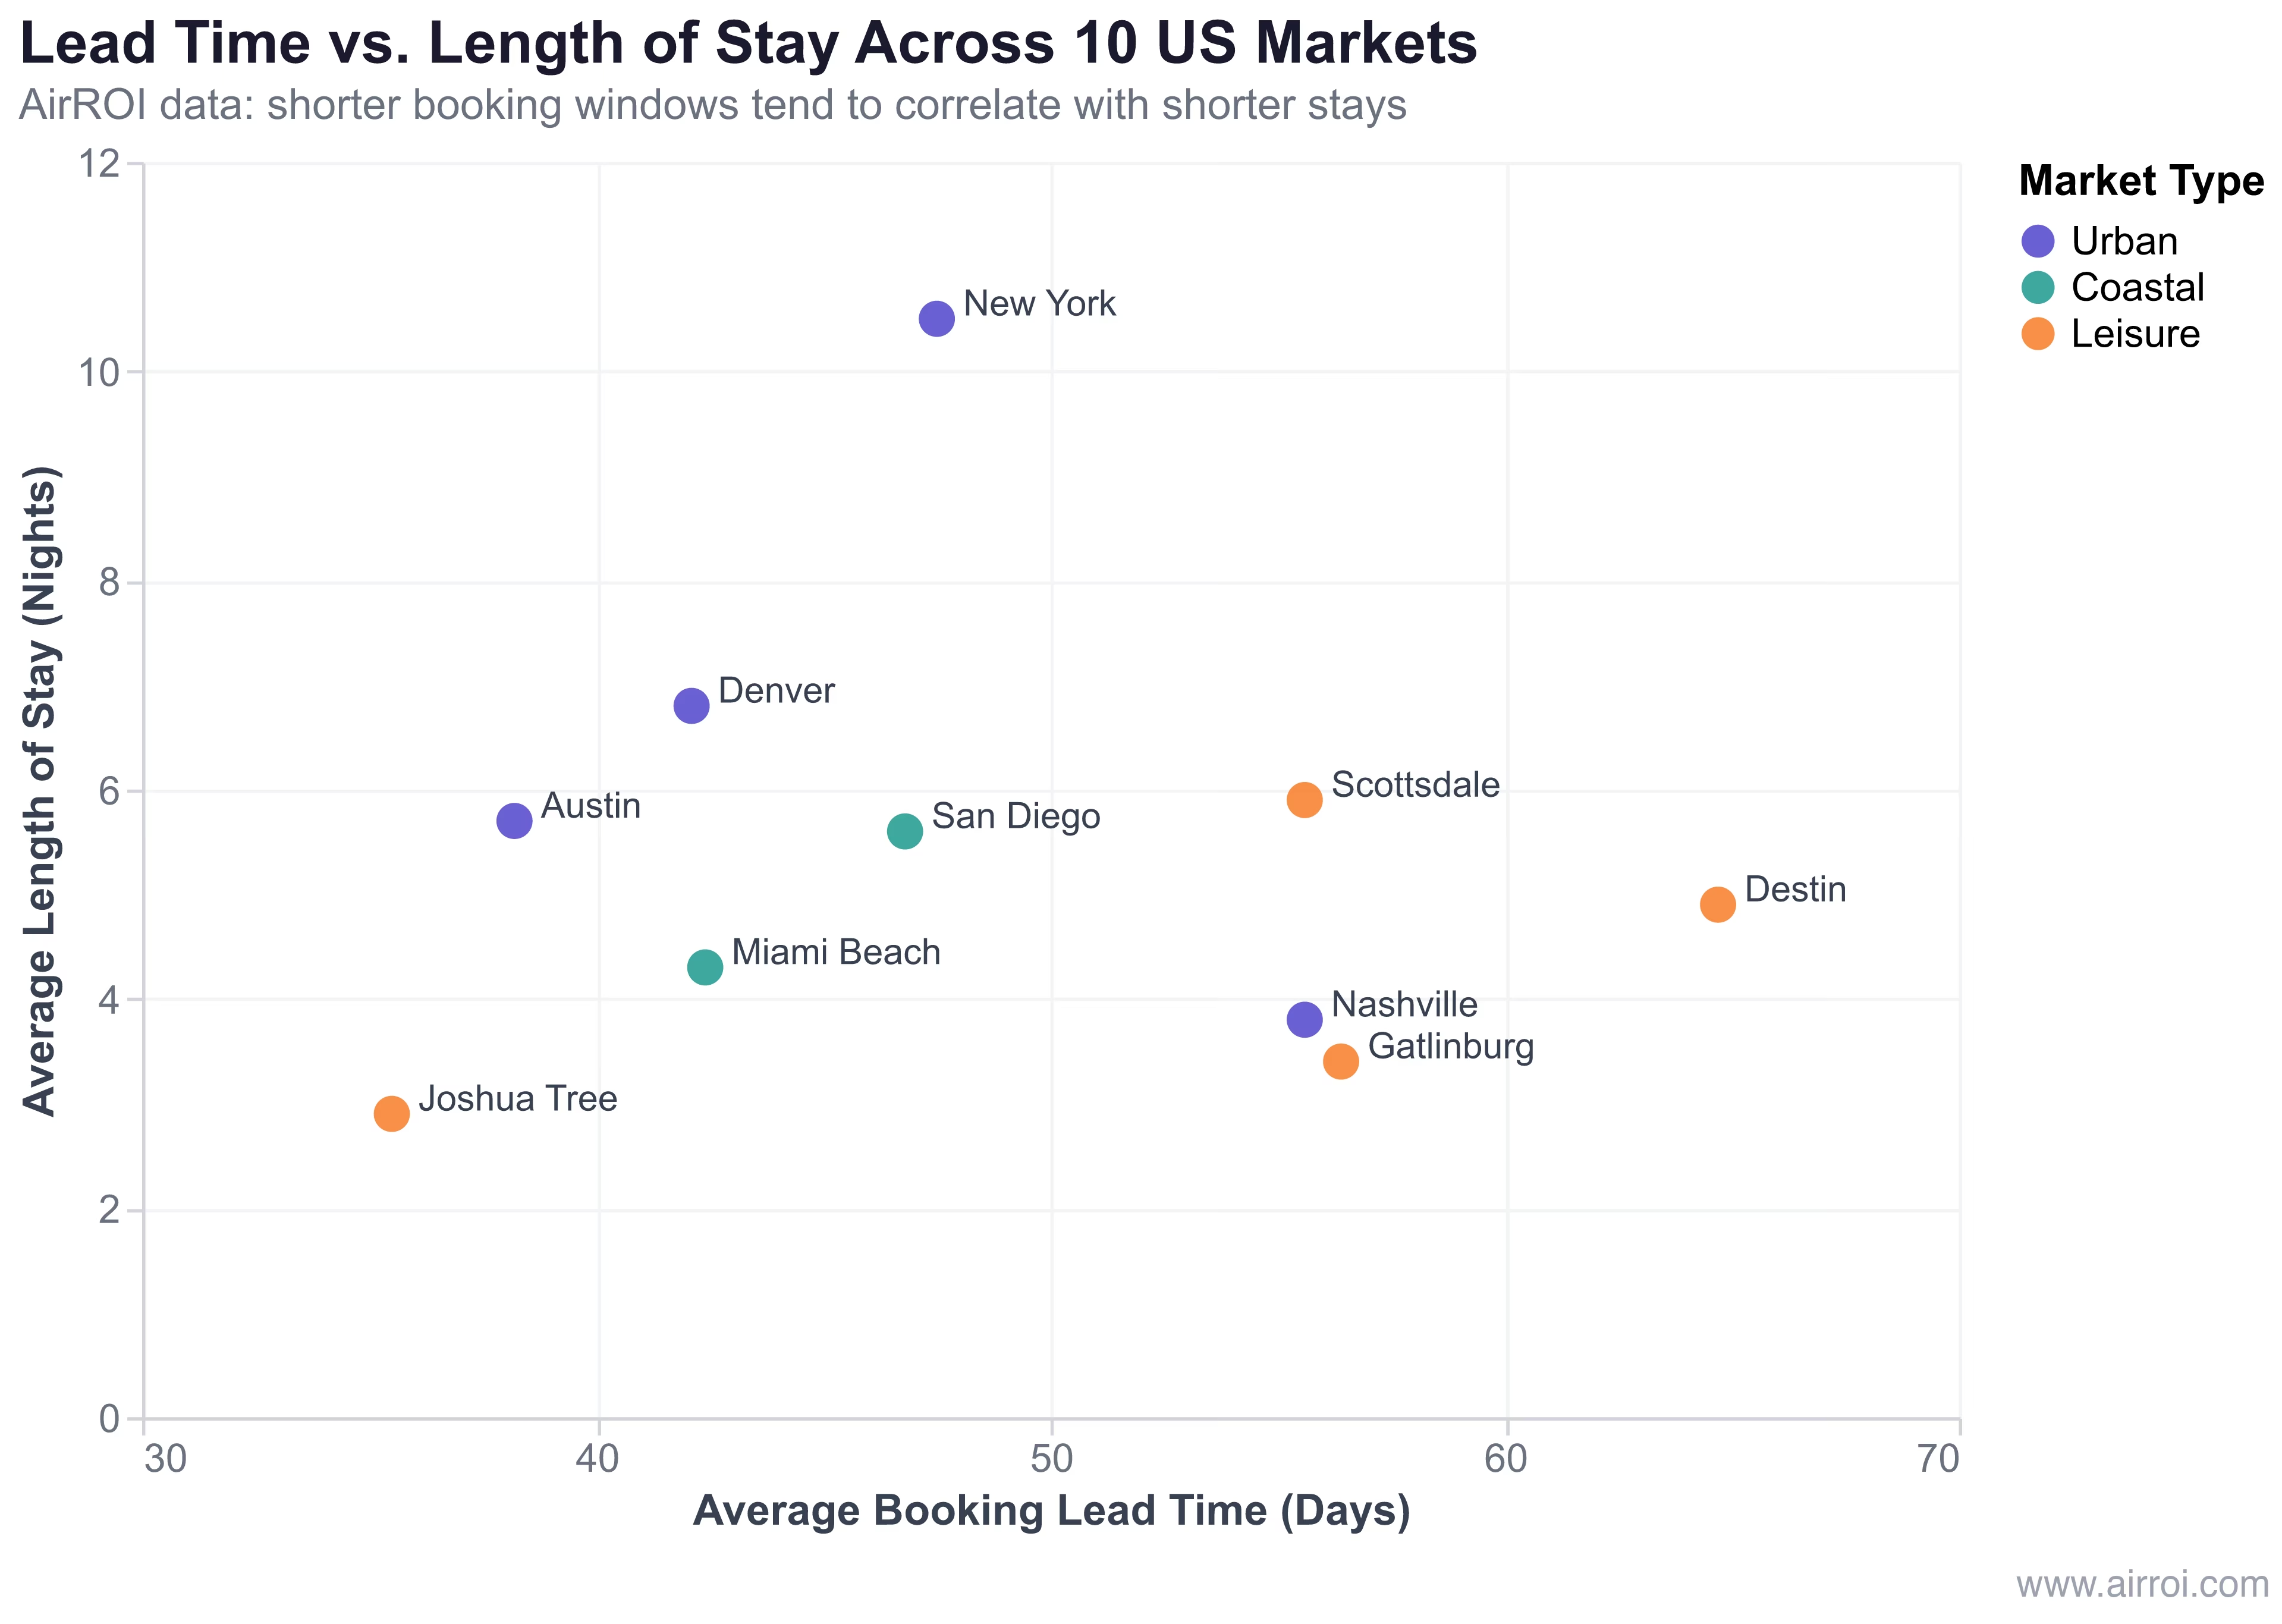
Two markets break the pattern. New York averages 10.5 nights despite a 47.5-day lead time -- a function of its regulatory environment that pushes listings toward 30-day minimum stays, inflating the average LOS. Austin averages 5.7 nights at 38.2 days, reflecting its corporate travel and remote-worker extended-stay segment.
| Lead Time Tier | Markets | Avg LOS | Implication |
|---|---|---|---|
| Short (<40 days) | Joshua Tree, Austin | 2.9-5.7 nights | Higher turnover, more cleaning costs, gap-night risk |
| Medium (40-50 days) | Denver, Miami Beach, San Diego, NYC | 4.3-10.5 nights | Mixed turnover, moderate gap risk |
| Long (>55 days) | Nashville, Scottsdale, Gatlinburg, Destin | 3.4-5.9 nights | Lower turnover but seasonal compression |
The combination of shorter booking windows and shorter stays means more turnovers per year, higher cleaning costs, and more 1-2 night gap nights between reservations. Hosts in short-window markets need to factor these operational costs into their ADR to maintain profitability.
The Pricing Implication: Hold Rates or Discount Early?
The costliest pricing mistake in a compressed booking window market is discounting too early. When your market's median lead time is 20 days but you start dropping rates at 45 days out, you are giving away revenue on bookings that would have arrived at full price.
According to Beyond Pricing's 2026 analysis, "booking lead times continue to shrink across most markets, and that trend shows no signs of reversing. Guests are booking closer to arrival, valuing flexibility over predictability." The response is not to panic-discount but to align your pricing timeline with your market's actual booking curve.
The framework:
- Hold firm rates until your market's p50 (median) lead time
- Implement tiered discounting in 7-day increments after the median
- Aggressive last-minute pricing for dates within 3-5 days if still vacant
For a short-window market like Austin (median 17-20 days in winter), hold rates until 14 days out, offer 10% off at 7-10 days, and 15-20% off for same-week bookings. For a long-window market like Destin during summer (median 57+ days), hold rates until 45 days out with no discount needed during peak weeks -- the demand will fill.
The Gap Night Problem: $2,500-$7,500 in Lost Revenue
Gap nights -- the 1-2 night orphan holes between reservations -- cost property managers 5-15% of their potential annual revenue, according to Hostaway's analysis. For a property earning $50,000 per year, that translates to $2,500-$7,500 in lost income. Shorter booking windows make this worse: more last-minute, shorter stays create more unpredictable gaps.
Consider a Joshua Tree host with a 2-night minimum. When a guest books Thursday-Saturday at 10 days' notice and another books the following Wednesday-Friday at 5 days' notice, Sunday through Tuesday sits empty -- three nights at $336 ADR gone, totaling over $1,000 in a single week.
Three strategies to recapture gap-night revenue:
-
Dynamic minimum stay: Maintain your preferred minimum (2-3 nights) for dates 14+ days out. Automatically drop to 1 night for dates within 7 days. Airbnb's custom trip length feature supports this directly.
-
Gap-night pricing: Use PriceLabs or similar tools to auto-detect orphan nights and apply a 10-15% discount. Even a discounted night generates revenue; an empty night generates zero.
-
Platform diversification: List on last-minute booking platforms that attract spontaneous travelers actively searching for tonight or tomorrow night stays.
An internal PriceLabs survey found that 30% of vacation rental operators now adjust their minimum-stay restrictions based on guest lead time -- up from negligible adoption just two years ago. The practice is becoming standard because the math is straightforward: at a $336 ADR, filling 10 extra gap nights per year adds $3,360 in revenue with minimal incremental cost.
Your Market's Lead Time Playbook
Your pricing strategy should match your market's booking window profile, not a generic best practice. AirROI data suggests three distinct strategy tiers:
| Strategy Tier | Avg Lead Time | Markets | Pricing Cadence | Min-Stay Approach | Key Tactic |
|---|---|---|---|---|---|
| Fast React | <40 days | Joshua Tree, Austin | Daily price updates | 1-night min within 7 days | Aggressive gap fills, last-minute promotions |
| Balanced | 40-55 days | Denver, Miami Beach, San Diego, NYC, Nashville | 2-3x weekly updates | 2-night min, drop within 10 days | Season-specific discount timelines |
| Protect & Hold | >55 days | Scottsdale, Gatlinburg, Destin | Weekly updates (daily in shoulder) | 3-5 night min peak, 2-night shoulder | Hold peak rates, discount only shoulder season |
For Protect & Hold markets: Your long booking window is an asset -- use it. Summer bookings in Destin arrive 60-80 days out; there is no reason to discount 45 days ahead. The risk in these markets is not filling peak season; it is leaving shoulder-season revenue on the table because the shorter winter windows require a completely different tactic.
Regardless of your tier, track one metric above all others: your market's p25 lead time. This tells you when the last quarter of bookings arrive. If your p25 is 7 days, a significant share of your revenue depends on your last-week pricing and availability settings. If your p25 is 30 days, you have more pricing runway -- but still less than you probably assume.
"The short-term rental market is not shrinking in 2026. It is sharpening." -- PriceLabs, 2026 Trends Guide
The booking window shift is not a demand problem. Booking.com's survey of 29,000 travelers found that 67% do not need a specific reason to book a trip -- spontaneity itself has become the motivation. The demand is there. The question is whether your pricing, minimum stays, and calendar management are calibrated to capture it on the timeline guests actually use.
Frequently Asked Questions
The national average booking window shrank to 29 days in 2026 according to PriceLabs. AirROI data across 10 major US markets shows the average ranges from 35.5 days in Joshua Tree to 64.7 days in Destin, with urban markets like Austin (38.2 days) and Denver (42.1 days) trending toward the short end. January 2026 median lead times dropped as low as 17 days in Austin and New York.
Three converging forces drive the compression. Booking.com's 2026 survey of 29,000 travelers found 67% say spontaneity alone is reason enough to book a trip. Mobile-first booking makes same-week reservations frictionless -- Expedia Group reports more than half of hotel bookings now happen on mobile devices. Rising travel costs also push guests to shop harder and commit later, compressing decision timelines across all demographics.
Not necessarily. AirROI data shows Joshua Tree, with the shortest average lead time at 35.5 days, generates $38,970 in annual revenue -- nearly identical to Destin's $39,186 despite Destin's 64.7-day average window. The key is adapting pricing cadence and minimum-stay strategy to match your market's actual booking pattern rather than assuming demand has declined.
A gap night (or orphan night) is an unbooked night between two reservations that is too short to attract a new booking under existing minimum-stay rules. Shorter booking windows create more gap nights because last-minute bookings tend to be shorter and less predictable, leaving 1-2 night holes in the calendar. Hostaway estimates gap nights cost property managers 5-15% of potential annual revenue -- $2,500 to $7,500 on a $50,000 property.
Hold firm rates until your market's median lead time, then implement tiered discounting. For a short-window market like Austin (median 20 days in January), hold rates until 14 days out, offer 10% off at 7-10 days, and 15-20% off for same-week bookings. For long-window markets like Destin, maintain summer rates 60+ days out and only discount shoulder season within 21 days. Drop minimum-stay requirements to 1 night for dates within 7 days to fill gap nights.