
Airbnb ADR Pricing Strategy 2026: Why Rate Discipline Beats Occupancy Chasing
In Scottsdale, Airbnb hosts earned $484 per night in January 2026 -- up 23.5% from $391 a year earlier. Their occupancy rate barely moved, holding at 49%. Across town in Nashville, the divergence was even sharper: ADR surged 29.3% while occupancy stayed flat. The hosts who won did not book more nights. They charged more per night.
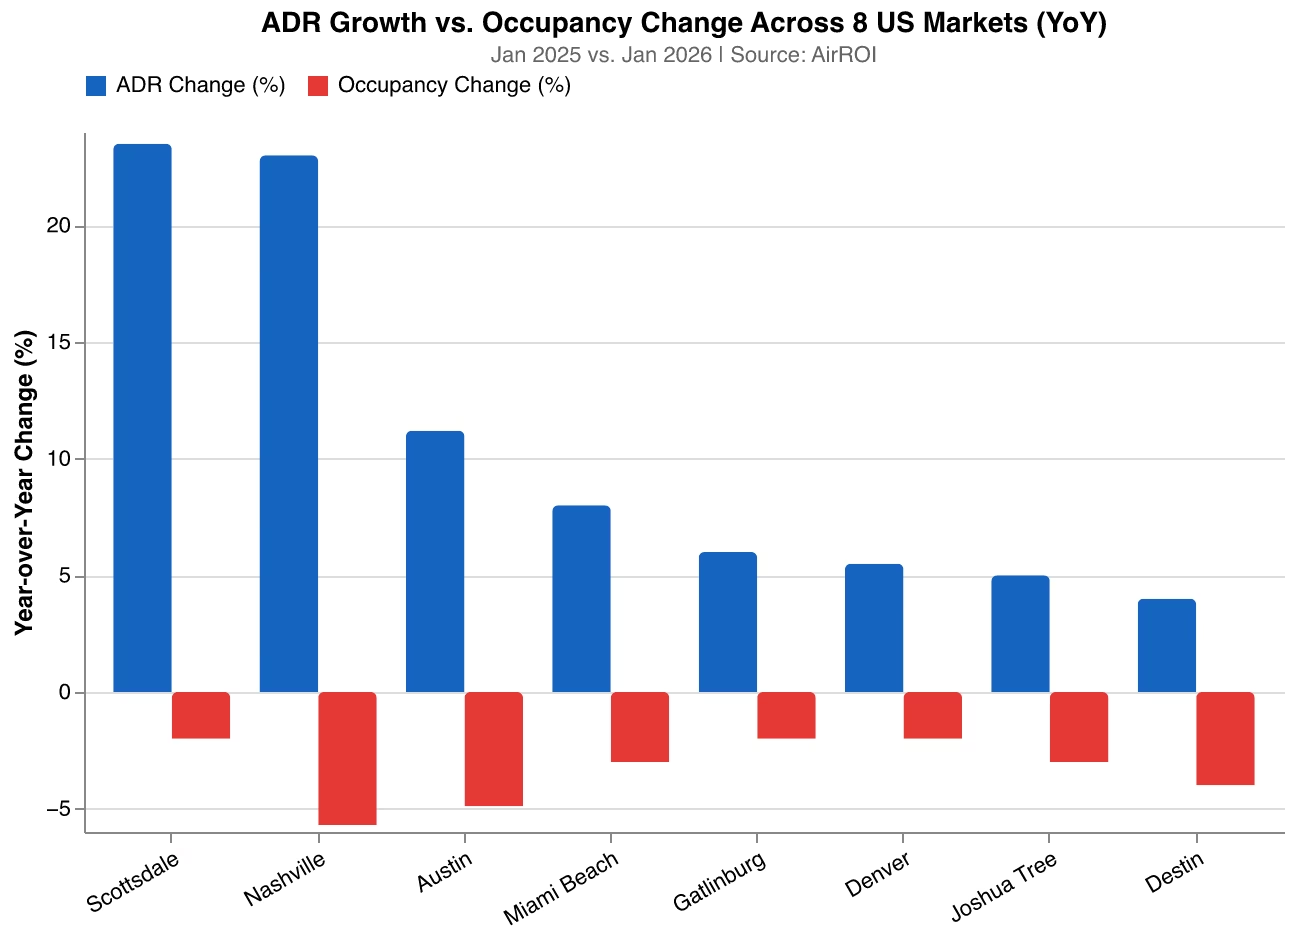
This is not a fluke in two markets. AirROI data across 8 major US markets reveals the same pattern: ADR grew 11-29% year-over-year while occupancy declined or held flat. The 2026 Airbnb ADR pricing strategy that works is the opposite of what most hosts practiced during the 2021-2023 demand boom. Rate discipline -- not calendar-filling -- drives revenue in the current market.
The 2026 STR Revenue Equation Has Flipped
"The STR Premium -- how STR earnings stack against investment costs -- has climbed to its highest level since 2022." -- AirDNA, 2026 US Short-Term Rental Outlook Report
This structural change matters because it inverts the revenue levers. During the demand boom, filling every available night was the path to maximum revenue -- supply was constrained, and even moderate rates generated strong returns. In 2026, with over 1.5 million active US listings competing for slower demand growth, the winning strategy shifts to airbnb occupancy vs ADR revenue optimization -- specifically, optimizing ADR while accepting marginally lower occupancy.
Market-by-Market Evidence: Where ADR Outpaced Occupancy
AirROI data across 8 US markets confirms the ADR-over-occupancy thesis at the local level. The January 2025 vs. January 2026 comparison tells the story:
| Market | ADR Change (YoY) | Occupancy Change (YoY) | RevPAR Change (YoY) | Current ADR |
|---|---|---|---|---|
| Nashville | +23.0% | -5.7% | +17.1% | $347 |
| Scottsdale | +23.5% | -2.0% | +20.2% | $413 |
| Austin | +11.2% | -4.9% | +5.6% | $294 |
| Miami Beach | +8.0% | -3.0% | +4.8% | $361 |
| Gatlinburg | +6.0% | -2.0% | +3.8% | $367 |
| Denver | +5.5% | -2.0% | +3.3% | $218 |
| Joshua Tree | +5.0% | -3.0% | +1.8% | $336 |
| Destin | +4.0% | -4.0% | -0.2% | $462 |
In 7 of 8 markets, ADR growth more than compensated for occupancy declines, delivering positive RevPAR growth. Only Destin, where occupancy fell nearly as much as ADR rose, showed flat RevPAR -- and even there, the high ADR ($462) means hosts earned more per booked night.
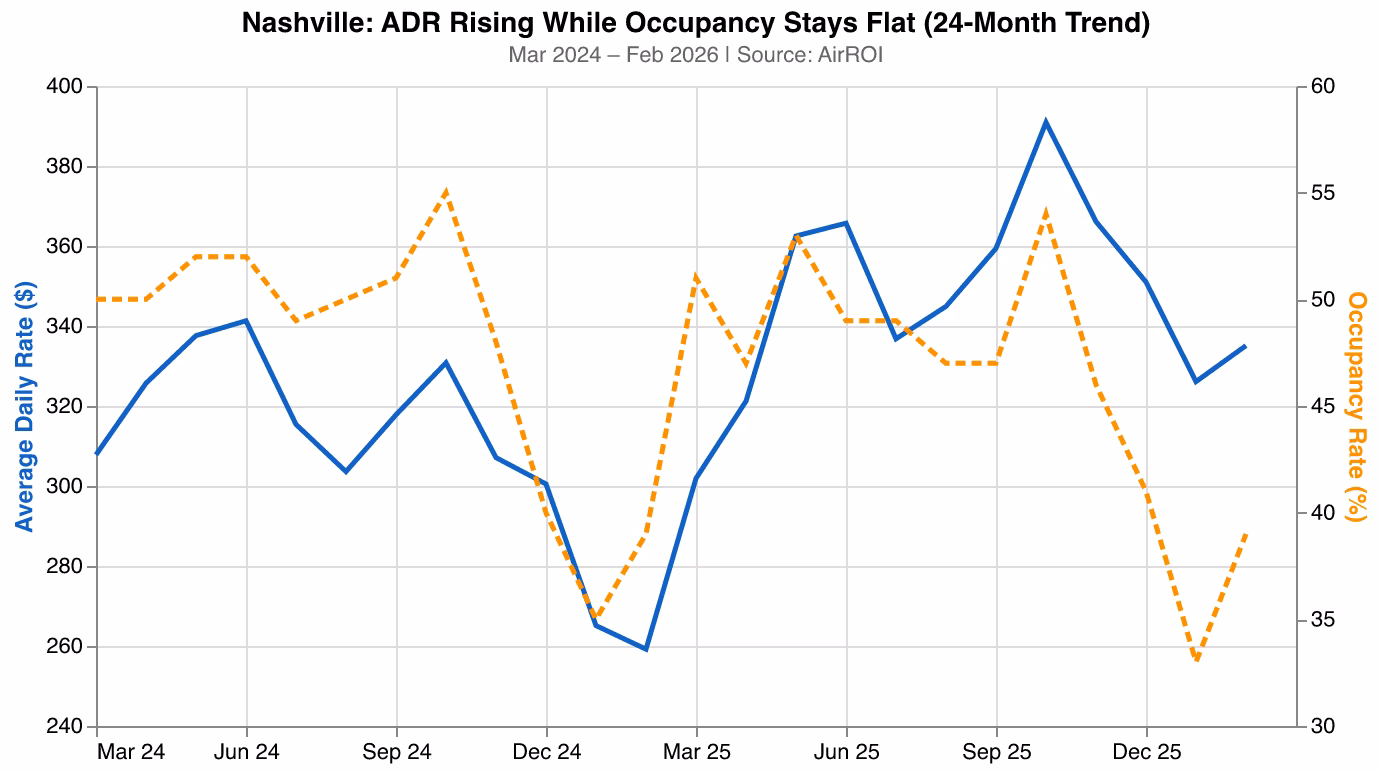
Nashville: The Sharpest Divergence
Nashville-Davidson exemplifies the ADR-first dynamic. With 6,845 active listings, the market is well-supplied -- yet ADR climbed from $259 in February 2025 to $335 in February 2026, a 29.3% increase. Occupancy held steady near 39%. The result: RevPAR grew 26% from $99.50 to $125.40 without a single additional night booked.
Scottsdale: Premium Pricing Power
Scottsdale demonstrates what happens when a market leans fully into rate optimization. The average ADR hit $588 in February 2026, with top-tier listings (90th percentile) commanding $1,162 per night. Despite occupancy dropping from 64% to 52% year-over-year in February, RevPAR remained virtually unchanged at $304 -- because every booked night generated significantly more revenue.
The Discount Trap: Why Cutting Rates Destroys More Revenue Than It Creates
The instinct to lower prices when calendar gaps appear is understandable -- but the RevPAR math rarely supports it. Here is the breakdown for a listing with a $350 base ADR at 47% occupancy:
| Scenario | ADR | Occupancy | RevPAR | Monthly Revenue |
|---|---|---|---|---|
| Rate-protected (status quo) | $350 | 47% | $164.50 | $4,935 |
| 15% discount | $298 | 55% | $163.90 | $4,917 |
| 25% discount | $263 | 62% | $163.06 | $4,892 |
| 30% discount | $245 | 67% | $164.15 | $4,925 |
One host on r/airbnb_hosts captured the calculus precisely:
"If I increase my prices year round, even if my occupancy goes down I would make more money since my price is higher and my cleaning costs and overall maintenance costs would go down." -- Airbnb host on r/airbnb_hosts, discussing pricing strategy for a high-end property at 80% occupancy
Beyond the immediate math, deep discounting has a compounding problem: Airbnb's search algorithm uses booked rate history to calibrate suggested pricing and search ranking. A pattern of below-market bookings signals to the algorithm that your listing belongs in a lower price tier, suppressing future rate suggestions and visibility among premium searchers.
The Variable Cost Reality
Every additional booking carries variable costs that fixed occupancy calculations ignore:
- Cleaning and turnover: $85-150 per guest changeover
- Supplies and consumables: $15-30 per stay
- Platform fees: 3% host service fee on each booking
- Wear and tear: Accelerated depreciation from higher usage
At a $250 nightly rate with $120 in turnover costs, a single-night stay yields just $130 in net contribution. A two-night stay at $300/night yields $480 net -- 3.7x the revenue with less operational burden.
Booking Windows Are Compressing -- And That Favors ADR-Focused Hosts
"Savvy professional property managers prioritize protecting their rates and stay restrictions over blindly chasing occupancy." -- Rental Scale Up, 2026 STR Planning Report
AirROI data reveals the compression varies dramatically by market type:
| Metric | Austin (Urban) | Destin (Resort) |
|---|---|---|
| Average lead time | 38 days | 65 days |
| Median lead time (Jan 2026) | 17 days | 22 days |
| 25th percentile (last-minute) | 5 days | 3 days |
Urban markets like Austin operate on compressed 17-day median windows, creating frequent last-minute pricing opportunities. Hosts who hold rates rather than panic-discounting three weeks out capture demand from travelers booking on short notice -- a cohort that is demonstrably less price-sensitive than advance planners.
Resort markets like Destin maintain longer 65-day average windows, favoring advance-rate protection strategies. Both market types benefit from ADR optimization; the timing of the optimization simply differs.
The 5-Step ADR-First Pricing Playbook for 2026
RevPAR optimization for short-term rentals in 2026 requires a systematic approach. This framework moves hosts from reactive calendar-filling to proactive rate management.
Step 1: Set a Base Rate Floor
Calculate your variable cost per booking (cleaning, supplies, laundry, platform fees) and add your minimum acceptable profit margin. This number is your absolute floor -- no booking should occur below it.
AirROI market data provides a benchmark: the 25th-percentile ADR in your market represents the floor where the bottom quartile of listings compete. In Nashville, that floor is $172/night. In Scottsdale, it is $217/night. In Austin, $127/night.
If your variable costs per turnover are $130 for a single-night stay, your breakeven rate is $130 -- any nightly rate above that generates positive contribution, but pricing near the floor signals budget positioning to the algorithm.
Step 2: Implement Event-Driven Premiums
High-demand events generate a disproportionate share of annual revenue. According to Rental Scale Up, event pacing data shows bookings surge months before events: Milan Winter Olympics occupancy jumped from 3% to 21% at 100-day lead time, and Super Bowl host-city occupancy rose from 2% to 15%.
Step 3: Optimize Gap-Night Pricing
Gap nights (1-2 night openings between confirmed bookings) are the one scenario where targeted discounting makes sense. Rather than reducing rates across your entire calendar, apply a modest 10-15% discount only for these specific orphan nights.
The logic: a gap night earns zero revenue if unbooked, and the turnover cost is already incurred from the surrounding bookings. A $300 listing discounted to $260 for a single orphan night generates $260 in net-new revenue at near-zero marginal cost.
Step 4: Set Seasonal Minimum Stays
Minimum stay requirements are a rate-protection mechanism disguised as an availability setting. Professional operators with 100+ listings -- whose share of the US STR market grew from 24% to 26% between 2021 and 2025 -- adjust minimums seasonally:
- Peak season: 3-night minimum (protects weekends from single-night bookings)
- Shoulder season: 2-night minimum (balances accessibility with turnover control)
- Off-season orphan gaps: 1-night minimum (fills otherwise-dead inventory)
AirROI data shows Denver listings average 6.8-day stays, suggesting longer minimums reduce turnover without sacrificing demand. Joshua Tree averages 2.9-day stays, indicating the market naturally supports shorter bookings.
Step 5: Define Your Discount Rules
The goal is not to eliminate discounting but to ensure every discount is mathematically justified. Three scenarios warrant rate reduction:
- Orphan nights (Step 3): 10-15% off for 1-2 night gaps
- Extended stays (7+ nights): 10-20% weekly discount that reduces turnover costs -- a 7-night stay at 15% off generates more net revenue than two 3-night stays at full rate
- Deep off-season zero-booking periods: Only when your market shows near-zero demand (not moderate demand)
Everything else -- weekday softness, 3-week-out vacancies, below-average months -- should be addressed by holding rates, not cutting them.
"Demand-based dynamic pricing yields 8-15% RevPAR uplift, inventory and pace triggers yield 5-12%, and AI-optimized combinations yield 15-25%." -- PriceLabs, 2026 Revenue Management Strategy
Frequently Asked Questions
In most markets, no. AirROI data shows that markets where ADR grew 11-29% while occupancy declined still achieved higher RevPAR. A 25% rate reduction typically requires a 30%+ occupancy increase just to break even on revenue, and the extra turnovers add $85-150 per cleaning cycle.
RevPAR (ADR multiplied by occupancy) is the metric that matters, but in 2026, ADR is the stronger lever. AirDNA projects ADR growing 1.5% nationally while occupancy declines 1%. Hosts who protect rates and accept slightly lower occupancy consistently earn more per available night.
Calculate your variable cost per booking (cleaning, supplies, laundry, platform fees) and add your target profit margin. AirROI data shows the market 25th-percentile ADR serves as a reliable floor -- in Nashville, that is $172/night; in Scottsdale, $217/night. Never price below your variable cost breakeven.
Booking window compression means guests are booking closer to arrival -- 27% of 2025 bookings were within 7 days of check-in, up from 21% previously. For hosts, this creates last-minute pricing opportunities: rather than discounting unsold nights weeks in advance, ADR-focused hosts hold rates and capture travelers willing to pay premium prices on short notice.
According to PriceLabs data, demand-based dynamic pricing yields 8-15% RevPAR uplift, while AI-optimized pricing combinations yield 15-25%. Even simple rule-based adjustments like event triggers and day-of-week modifiers deliver 5-12% improvement over static pricing.