
Best Airbnb Markets 2026: Data from 20M+ Listings Reveals Where to Invest
Every major short-term rental analytics company has published their best Airbnb markets 2026 ranking -- and they all disagree. AirDNA crowned Port Arthur, Texas. Ridge Street Capital picked unincorporated St. Petersburg, Florida. Sean Rakidzich ranked Gatlinburg, Tennessee at the top. The disagreement is not a coincidence: each organization is ranking a different metric, and most are ranking the wrong one. AirROI's analysis of 20M+ listings across 190+ countries produces a fundamentally different ranking -- one built on the intersection of RevPAR, regulatory stability, and supply-demand balance rather than a single dimension of performance.
Why 2026 Is the Strongest STR Investment Window Since 2021
"2026 will be the best year to invest in short-term rentals since 2021." -- AirDNA, 2026 STR Outlook Report
Supply growth has decelerated sharply. US STR listings are projected to grow just 4.6% in 2026, a fraction of the 20%+ annual expansion recorded in 2021-2022. The supply flood that compressed margins across dozens of markets is easing.
Pricing power is returning. Average daily rates are forecast to strengthen by 1.5% in 2026, with further acceleration expected in 2027. After two years of flat or declining ADR in many markets, the pricing environment is stabilizing.
How We Ranked the Best Airbnb Markets for 2026
Most market rankings fail because they optimize for a single variable. AirDNA's 2026 list favors low entry cost, which is why Port Arthur, Texas ($35,000 average annual revenue, $296,000 home prices) takes the top spot -- a market most STR investors would never consider. Revenue-only rankings inflate beach markets with high ADR but 40% occupancy. Occupancy-only rankings elevate urban markets drowning in supply.
AirROI's ranking evaluates markets across five dimensions:
- RevPAR (Revenue Per Available Room-Night) -- ADR multiplied by occupancy rate. As STR analyst Sean Rakidzich puts it: "RevPAN is the single best number for comparing markets -- it combines what people pay with how often they book."
- TTM Revenue -- Trailing twelve-month gross revenue per listing, capturing full seasonal cycles
- Regulatory stability -- Markets with established, non-prohibitive STR frameworks score higher than those with pending restrictions or recent crackdowns
- Supply-demand balance -- Active listing count relative to market demand, with markets showing listing growth below demand growth scoring higher
- Demand diversity -- Markets with multiple tourism drivers (events, outdoor recreation, business travel) outperform single-driver destinations
"Strong STR opportunities exist all across the US, but they are increasingly submarket-specific, not city-wide." -- Ridge Street Capital, Best Airbnb Markets 2026
This multi-factor approach, powered by AirROI's dataset of 20M+ listings (compared to AirDNA's 10M+), produces a ranking that surfaces both established revenue leaders and underrated opportunities that single-metric lists miss entirely.
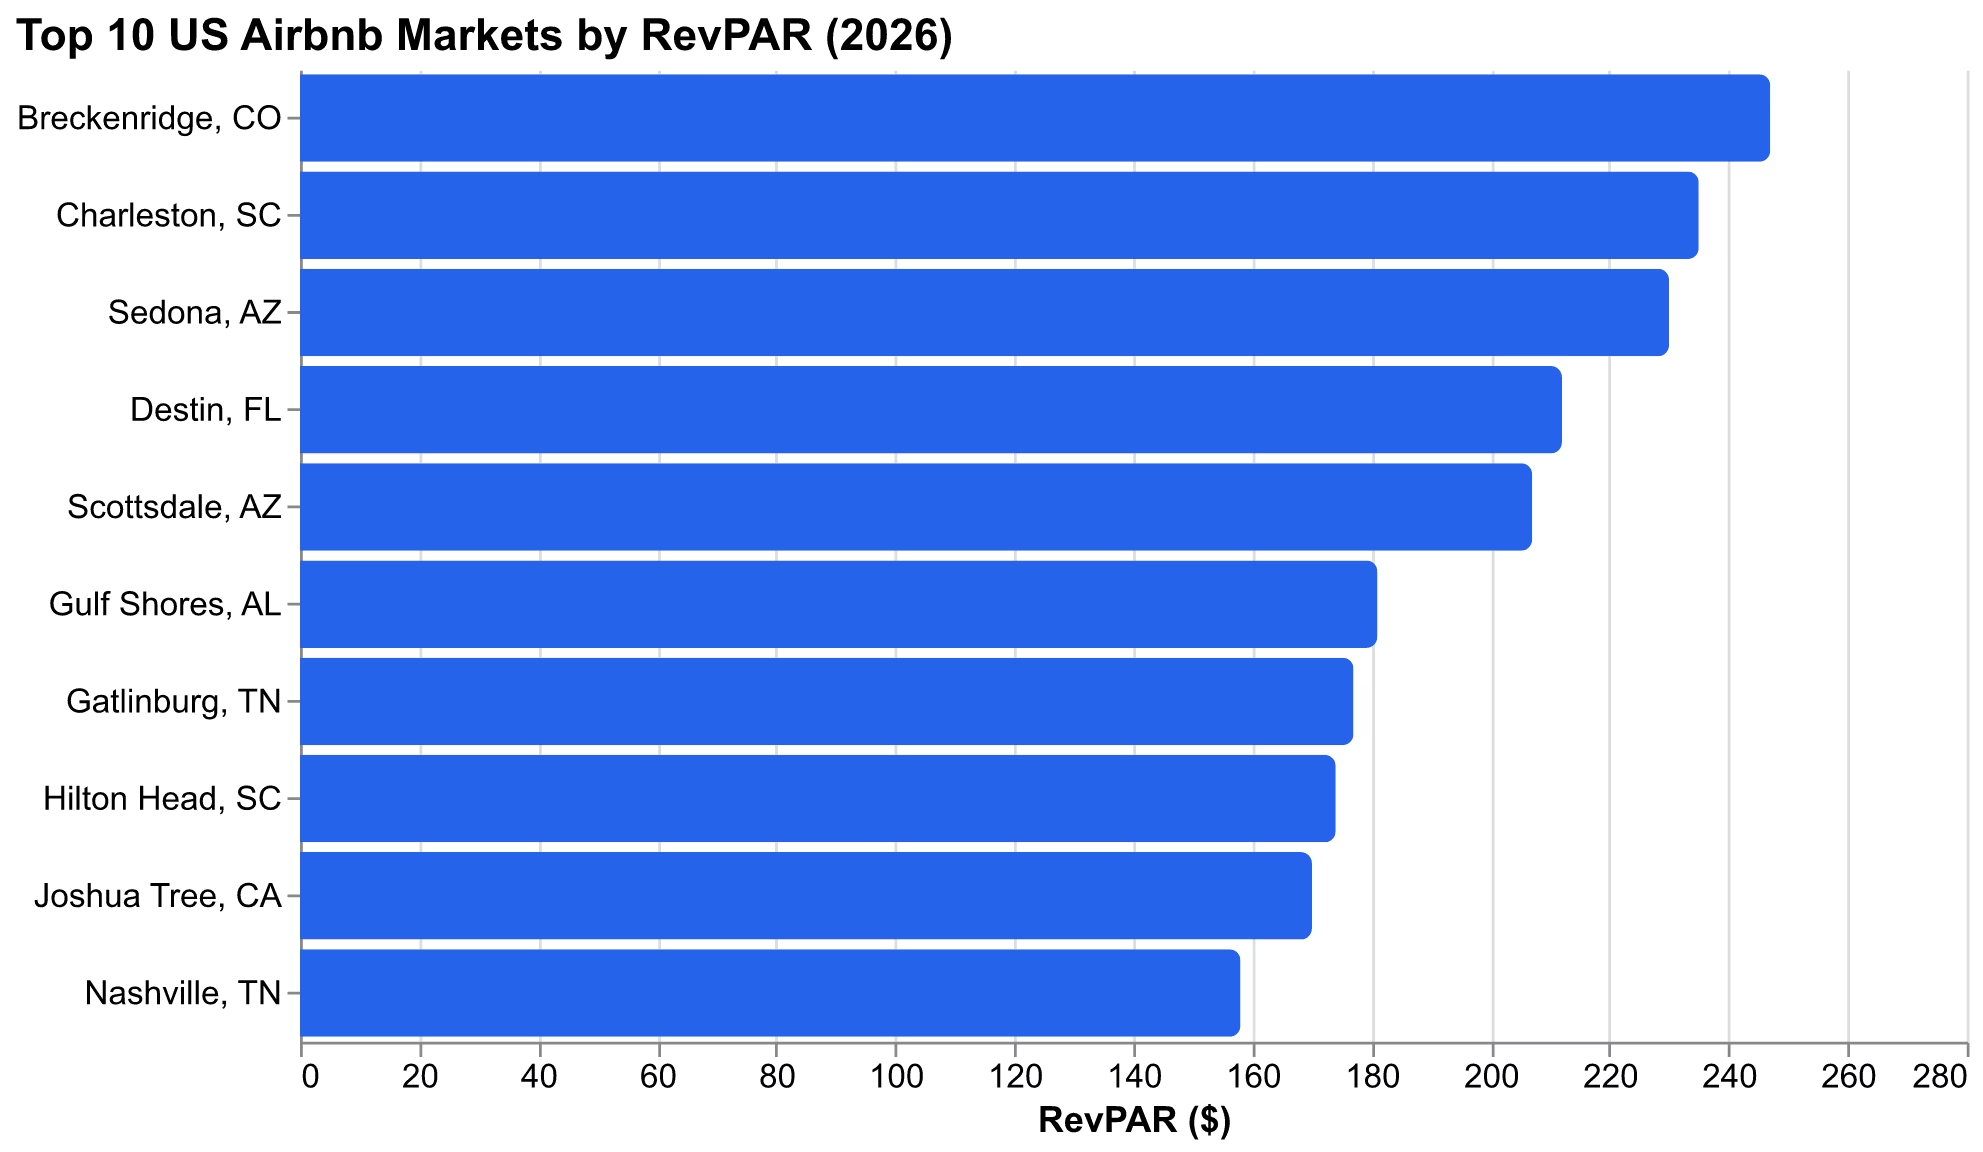
The 10 Best US Airbnb Markets for 2026
| Rank | Market | ADR | Occupancy | RevPAR | TTM Revenue | Active Listings | Regulation |
|---|---|---|---|---|---|---|---|
| 1 | Sedona, AZ | $431 | 52% | $230 | $52,553 | 1,765 | Medium |
| 2 | Charleston, SC | $420 | 56% | $235 | $47,943 | 2,008 | Medium |
| 3 | Breckenridge, CO | $574 | 42% | $247 | $46,676 | 3,224 | Medium |
| 4 | Gatlinburg, TN | $367 | 48% | $177 | $40,582 | 3,787 | Low |
| 5 | Destin, FL | $462 | 44% | $212 | $39,186 | 3,985 | Low |
| 6 | Joshua Tree, CA | $336 | 48% | $170 | $38,970 | 1,276 | Medium |
| 7 | Scottsdale, AZ | $413 | 49% | $207 | $34,246 | 4,689 | Low |
| 8 | Gulf Shores, AL | $405 | 43% | $181 | $34,748 | 5,195 | Low |
| 9 | Nashville-Davidson, TN | $347 | 47% | $158 | $34,583 | 6,845 | Medium |
| 10 | Savannah, GA | $304 | 48% | $146 | $29,859 | 2,564 | Low |
Source: AirROI market analytics, trailing 12 months as of March 2026. ADR, RevPAR, and TTM Revenue are averages across all active listings.
1. Sedona, AZ -- The Revenue King
Sedona leads our ranking with the highest TTM revenue of any market in the top 10 at $52,553 per listing. A $431 ADR paired with 52% occupancy produces $230 RevPAR -- but revenue is the story here. Red rock tourism drives year-round demand that most seasonal markets cannot match, and the relatively low listing count (1,765) keeps pricing power intact.
The investment angle for Sedona involves looking beyond city limits. Sedona has imposed permit moratoriums in certain residential zones, but the adjacent Big Park area (549 listings at comparable ADR) offers entry points 25-30% below core Sedona home prices. AirROI data confirms Big Park listings achieve similar RevPAR to the core market.
2. Charleston, SC -- The Consistency Champion
Charleston posts the highest occupancy rate in the top 10 at 56% -- a reflection of year-round demand driven by culinary tourism, historic architecture, and a growing convention scene. At $420 ADR and $47,943 TTM revenue, Charleston delivers consistent returns without the seasonal volatility that plagues beach and mountain markets.
The 2,008-listing supply is manageable, though investors should note medium regulatory risk. Charleston requires STR permits and restricts listings in certain historic districts. Focus on properties in permitted zones near King Street and the waterfront for optimal performance.
3. Breckenridge, CO -- The ADR Machine
No market in America commands pricing like Breckenridge. At $574 ADR -- the highest in our top 10 by $112 -- Breckenridge generates $247 RevPAR despite just 42% occupancy. The math works because ski season drives premium nightly rates that compensate for summer shoulder softness.
The key risk is seasonality. At a 4.6-day average length of stay and 64.5-day booking lead time, Breckenridge caters to vacation planners who book weeks in advance. Investors should stress-test at 35-40% occupancy to ensure the property cash-flows during slower months. As Ridge Street Capital advises: "Properties should still cash flow at 50-60% occupancy."
4. Gatlinburg, TN -- The Volume Play
Gatlinburg benefits from hosting the most visited national park in the United States -- Great Smoky Mountains National Park. With $367 ADR, 48% occupancy, and $40,582 TTM revenue across 3,787 listings, Gatlinburg is the classic high-volume STR market. Low regulation and a deep tourism infrastructure (Dollywood, hiking, cabin culture) sustain demand year-round.
5. Destin, FL -- The Beach Premium
Destin commands the second-highest ADR in our ranking at $462, driven by Emerald Coast beach tourism. The 4.9-day average stay and 64.7-day booking lead time reveal a market dominated by planned family vacations -- guests booking beach condos weeks or months in advance.
At 44% occupancy and $39,186 TTM revenue, Destin's seasonal concentration is stark: summer months (June-August) deliver 60-70%+ occupancy while winter drops below 30%. Investors comfortable with concentrated revenue windows will find strong returns, particularly in beachfront condo units with Gulf views.
6. Joshua Tree, CA -- The Niche Performer
Joshua Tree is the smallest market in our top 10 by listing count (1,276) and that scarcity is its strength. At $336 ADR and 48% occupancy, the desert destination generates $38,970 TTM revenue per listing -- remarkably strong for a market with no beach, no ski mountain, and no theme park.
The 35.5-day booking lead time -- the shortest of any market we analyzed -- indicates spontaneous weekend demand from the Los Angeles metro, just two hours away. Joshua Tree's Instagram-driven appeal and unique architectural properties (A-frames, desert modern, geodesic domes) command premium pricing that commodity listings in larger markets cannot match.
7. Scottsdale, AZ -- The Snowbird Magnet
Scottsdale generates $34,246 TTM revenue with $413 ADR and 49% occupancy -- respectable numbers across 4,689 listings. The standout metric is average length of stay: 5.9 days, the longest of any market in our top 10. Snowbird migration, Cactus League spring training, and golf tourism drive extended-stay bookings from October through April.
The flip side is a pronounced summer lull. Scottsdale ADR drops 30-40% during June-September, and investors must budget for 3-4 months of reduced cash flow. For those willing to ride the seasonality, winter/spring months deliver outsized returns.
8. Gulf Shores, AL -- The Value Beach
Gulf Shores offers Gulf Coast beach access at a fraction of Florida's acquisition costs. At $405 ADR, 43% occupancy, and $34,748 TTM revenue, it competes directly with Destin and Panama City Beach on pricing while offering lower entry costs and minimal regulatory friction.
The 68.4-day booking lead time -- longest in our top 10 -- signals a market driven by family vacation planning. With 5,195 active listings, supply is substantial, but Alabama's permissive STR environment keeps operational friction low.
9. Nashville-Davidson, TN -- The Cautionary Comeback
Nashville remains one of America's premier tourism destinations. Bachelor and bachelorette tourism, live music, CMA Fest, and convention business sustain genuine demand. But 6,845 active listings -- the highest density in our top 10 -- has pushed occupancy down to 47% and compressed margins.
10. Savannah, GA -- The Emerging Gem
Savannah rounds out our top 10 as the best value play. At $304 ADR (lowest in the ranking) and $29,859 TTM revenue, it may not headline revenue comparisons -- but 48% occupancy across just 2,564 listings reflects a market with room to grow. Historic district tourism, SCAD (Savannah College of Art and Design) events, and proximity to Tybee Island beaches provide diversified demand.
5 Emerging Markets the Other Lists Missed
The top 10 captures established performers. These five markets offer strong fundamentals with lower competition and, in some cases, lower entry costs.
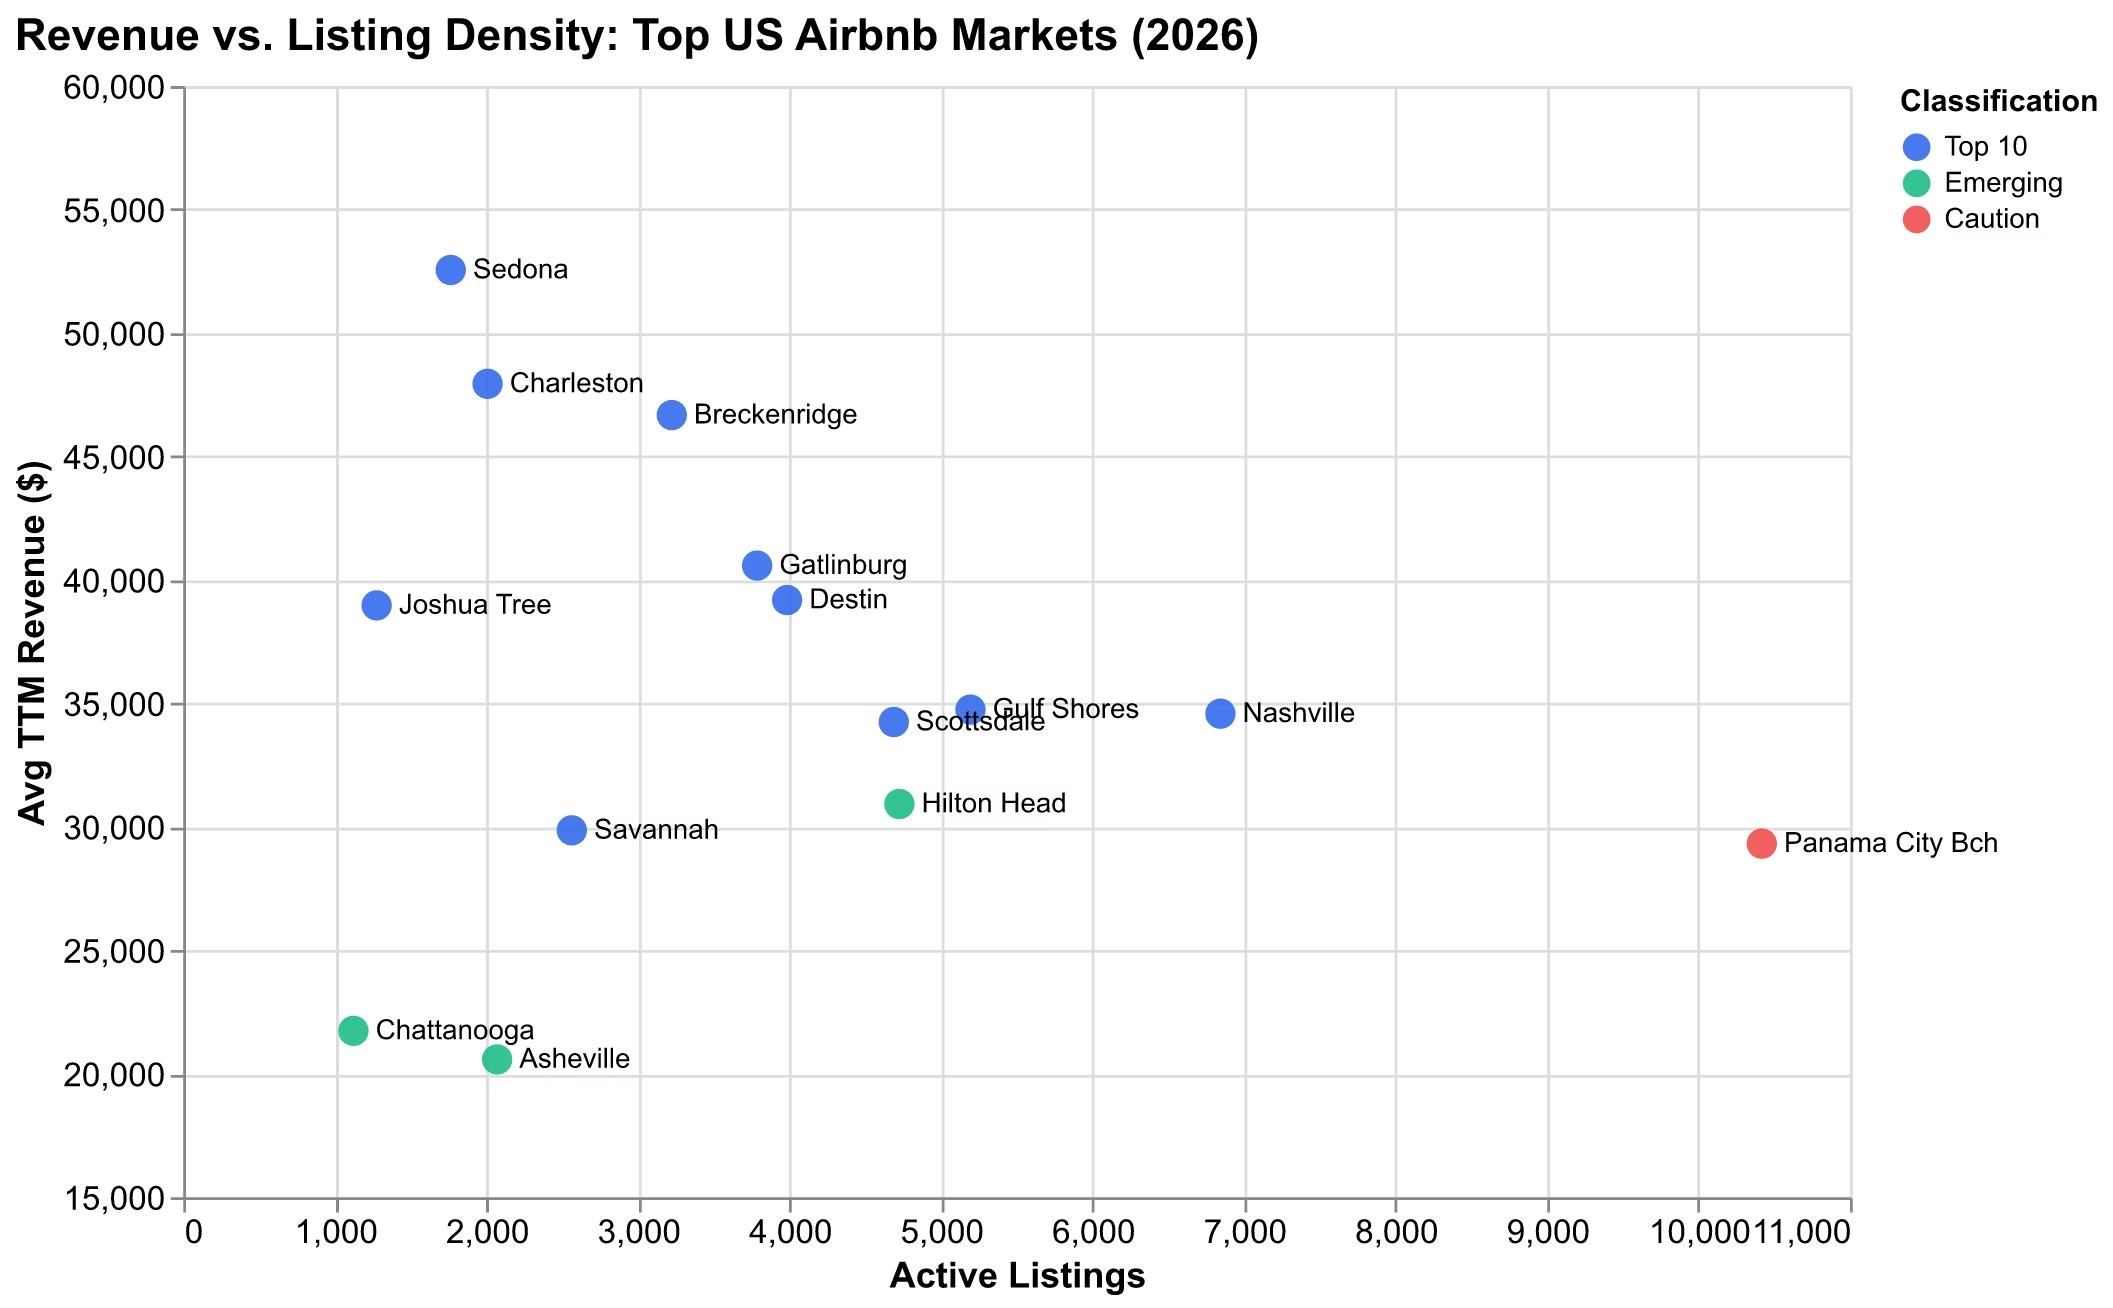
Chattanooga, TN -- Just 1,123 active listings with $207 ADR and 50% occupancy. The lowest listing density of any market we analyzed translates to less competition. The North Shore arts district and outdoor recreation (Rock City, Ruby Falls, Tennessee River) drive growing tourism. At an estimated median home price near $290K, a 3BR investment can produce 20%+ cash-on-cash returns.
Hilton Head Island, SC -- With $403 ADR and the longest average stay in our dataset (5.6 days), Hilton Head caters to affluent family vacationers booking week-long stays. The 76.7-day booking lead time is the longest of any market, indicating high-value advance bookings. Its 4,726 listings are substantial, but the premium clientele supports pricing discipline.
Asheville, NC -- Currently recovering from Hurricane Helene's 2024 impact, Asheville's tourism infrastructure is rebuilding. At $256 ADR and 2,071 listings, the market offers a window for investors to acquire properties at discounted prices before demand fully recovers. The Blue Ridge Parkway, craft brewery scene, and Biltmore Estate provide durable demand drivers.
Colorado Springs, CO -- The 2,873-listing market sits in the shadow of Denver and Breckenridge but offers significantly lower entry costs. Pikes Peak, Garden of the Gods, and the US Olympic Training Center drive year-round tourism without the extreme seasonality of ski markets.
Flagstaff, AZ -- As the primary gateway to the Grand Canyon, Flagstaff's 1,740 listings serve a captive tourism audience. Four-season demand (summer canyon visits, winter skiing at Snowbowl) provides occupancy stability that single-season markets lack.
Markets to Approach with Caution in 2026
Not every popular market is a sound investment. Three oversaturation signals to watch: high listing counts, declining occupancy, and regulatory uncertainty.
Panama City Beach, FL -- With 10,418 active listings, Panama City Beach has the highest supply density of any market in our analysis. Occupancy sits at 44% with $341 ADR, producing just $29,320 TTM revenue. For context, adjacent Destin generates $10,000 more annual revenue per listing with 6,400 fewer competitors.
Austin, TX -- Once the darling of STR investors, Austin now hosts approximately 9,167 listings. Occupancy has declined from 68-70% to roughly 60%, and margin compression is real. New investors face an uphill battle against established operators with superior reviews and pricing algorithms.
NYC and LA -- Regulatory environments have made these markets effectively off-limits for new STR investors. New York City's Local Law 18 requires hosts to register, be present during stays, and limits guests to two per booking -- effectively banning entire-home STRs. The city refused to lift restrictions even for the 2026 World Cup. Los Angeles caps primary residence hosting at 120 days per year.
The Regulatory Landscape: From Idaho's Deregulation to NYC's Lockdown
Regulation is the most underappreciated factor in STR investment. A market generating $50,000 annual revenue is worthless if local ordinances prohibit your operation.
The regulatory spectrum in 2026 spans from near-total prohibition to active deregulation:
"The pendulum has swung too far to the side of deregulating short-term rentals." -- Idaho State Senator Mark Harris, opposing HB 583
Investment Scenarios: What a 3BR Property Earns in the Top 3 Markets
Disclaimer: These scenarios are illustrative and based on market averages. Actual returns depend on specific property attributes, location, management quality, and market conditions. Always perform independent due diligence before making investment decisions.
| Factor | Sedona, AZ | Charleston, SC | Breckenridge, CO |
|---|---|---|---|
| Property type | 3BR / 2BA desert home | 3BR / 2.5BA historic home | 3BR / 2BA ski condo |
| Est. purchase price | $520,000 | $450,000 | $750,000 |
| Down payment (20%) | $104,000 | $90,000 | $150,000 |
| Projected annual revenue | $52,553 | $47,943 | $46,676 |
| Est. operating expenses (45%) | $23,649 | $21,574 | $21,004 |
| Est. mortgage (6%, 30yr) | $29,952 | $25,920 | $43,200 |
| Est. net cash flow | -$1,048 | $449 | -$17,528 |
| Cash-on-cash return (20% down) | -1.0% | 0.5% | -11.7% |
| Cap rate (cash purchase) | 5.6% | 5.9% | 3.4% |
How to Research Any Market with Free AirROI Tools
Rankings provide a starting point, but every investment decision requires property-level analysis. Here is how to vet any market using AirROI's free tools:
-
Broad market exploration -- Use AirROI Atlas to explore RevPAR, ADR, and occupancy heatmaps across any US market. Zoom into neighborhoods to identify high-performing submarkets.
-
Deep-dive analysis -- Generate detailed reports for specific cities or zip codes via AirROI Reports. Analyze seasonality trends, benchmark by property type (2BR vs. 3BR), and review seasonal demand patterns specific to your target area.
-
Property-specific projections -- Found a potential property? Input its address and details into the AirROI Calculator to get projected ADR, occupancy, and annual revenue based on comparable listings.
-
Factor in local costs and regulations -- Combine revenue projections with local property taxes, insurance, STR permit fees, and lodging taxes. For data-driven STR investment analysis, cross-reference AirROI projections with county assessor data and municipal STR ordinances.
Frequently Asked Questions
Based on AirROI's analysis of 20M+ listings, the top US Airbnb markets for 2026 by RevPAR are Breckenridge, CO ($247), Charleston, SC ($235), and Sedona, AZ ($230). These markets combine high ADR with stable occupancy and manageable regulatory environments. Sedona leads in overall TTM revenue at $52,553 per listing.
Yes. AirDNA's 2026 Outlook Report calls it the best year to invest in short-term rentals since 2021. Supply growth has slowed to 4.6% (down from 20%+ in 2021-2022), ADR is projected to rise 1.5%, and the FIFA World Cup is creating demand tailwinds across 16 host cities.
Average trailing-twelve-month revenue varies dramatically by market. AirROI data shows top US markets range from $52,553 per year in Sedona, AZ to $21,738 in Chattanooga, TN. Top-performing operators typically earn 30-50% above market averages through pricing optimization and amenity strategy.
RevPAR (Revenue Per Available Room-Night) is calculated by multiplying ADR by occupancy rate. It is the most reliable single metric for comparing Airbnb markets because it captures both pricing power and demand. A market with $500 ADR but 30% occupancy ($150 RevPAR) underperforms one with $300 ADR and 65% occupancy ($195 RevPAR).
Markets showing oversaturation signals include Nashville-Davidson, TN (6,845 active listings with 47% occupancy), Panama City Beach, FL (10,418 listings), and Austin, TX (approximately 9,167 listings with occupancy declining from 68% to 60%). High listing counts paired with falling occupancy rates indicate supply has outpaced demand.