
World Cup 2026 Airbnb Prices Near Every Stadium
Two months from the first whistle of the World Cup 2026, a three-bedroom house inside Arlington's AT&T Stadium ring is posted at $4,401 a night for the match window, up from $317 on the same dates one year earlier — a 13.9x lift on a single listing. Three miles from SoFi Stadium in Inglewood, a similar three-bedroom is posted at $277 a night, down from $339 on the same 2025 calendar. Both operators have been on the platform for years. Both have six or more World Cup matches scheduled at the nearest stadium. One priced the tournament. The other appears not to have.
That split is the story of the 2026 Airbnb market around the 16 host stadiums. This is not a single tournament-wide premium — Deloitte's $156 million host-earnings estimate and Airbnb's 80%-YoY search surge might suggest a shared lift — but a wide, structured dispersion. The sharpest hosts in each ring (call them the top tenth — operators who have actually studied the schedule, adjusted their calendar, and priced the event) are charging roughly 2x to 7.7x their 2025 rate on the same calendar dates, with eight rings clearing 3.5x. The typical host is far behind: match-window lift for the middle of the pack ranges from 1.2x to 4.6x, and in coastal California it barely clears flat. The spread between those two groups — between the hosts who priced the World Cup and the hosts who didn't — is what this article is about.
How we measured this
Two decisions separate this analysis from most tournament-pricing coverage.
First, the baseline. Earlier stadium coverage — including our own — used each listing's trailing-twelve-month ADR as the denominator, which baked in post-schedule-reveal anticipation pricing and understated the true tournament lift. This analysis instead uses each listing's own posted daily rates for the same 39-night window (June 11 to July 19) in 2025 as the denominator. Seasonality is controlled by construction. Anticipation is isolated to the 2026 numerator. The comparison becomes apples-to-apples: the same listing, the same 39 calendar days, one year apart.
Second, the unit. We ran radius searches centered on each stadium's coordinates, pulling thousands of active listings across all 16 rings and qualifying each listing against both the 2025 and 2026 windows. The ring radius varies by market — tighter where supply is dense, wider where it's thin — because the ring is the unit a fan shopping "near the stadium" is actually searching; city-wide averages mix in listings that are geographically irrelevant for the event. The result is a substantially deeper data pull than our earlier pass, which revised medians downward and produced the authoritative numbers below.
The 16-stadium scorecard
Ranked by the top-tenth host multiplier — what the 90th-percentile listing in each ring is charging relative to its own 2025 same-window rate. We call this the "top-tenth" because it isolates the operators who clearly repriced the calendar. A "typical" column (the median listing in the ring) is shown alongside so you can see how broadly the premium is distributed — a wide spread between the two means most hosts in the ring still haven't moved, a narrow spread means the ring is pricing more uniformly.
| Rank | Stadium | City / Metro | Ring | Top-tenth multiplier | Typical | Top-tenth match-night ADR | 2025 baseline ADR | Avail % |
|---|---|---|---|---|---|---|---|---|
| 1 | Arrowhead Stadium | Kansas City, US | 7 mi | 7.65x | 4.05x | $2,411 | $273 | 92% |
| 2 | AT&T Stadium | Arlington (Dallas), US | 5 mi | 6.98x | 4.56x | $3,092 | $316 | 94% |
| 3 | Estadio BBVA | Monterrey, MX | 5 mi | 4.70x | 2.52x | $711 | $99 | 96% |
| 4 | Mercedes-Benz Stadium | Atlanta, US | 2 mi | 4.53x | 1.70x | $1,483 | $302 | 83% |
| 5 | Estadio Azteca | Mexico City, MX | 5 mi | 4.27x | 1.99x | $579 | $92 | 92% |
| 6 | Estadio Akron | Guadalajara, MX | 5 mi | 4.02x | 2.46x | $617 | $134 | 78% |
| 7 | NRG Stadium | Houston, US | 5 mi | 3.82x | 1.96x | $1,969 | $477 | 85% |
| 8 | MetLife Stadium | E. Rutherford (NY-NJ), US | 5 mi | 3.53x | 1.83x | $1,862 | $322 | 51% |
| 9 | BC Place | Vancouver, CA | 2 mi | 3.44x | 1.91x | $1,804 | $388 | 74% |
| 10 | BMO Field | Toronto, CA | 2 mi | 2.89x | 1.45x | $1,157 | $426 | 92% |
| 11 | Hard Rock Stadium | Miami Gardens, US | 5 mi | 2.85x | 1.43x | $1,899 | $527 | 78% |
| 12 | Lincoln Financial Field | Philadelphia, US | 5 mi | 2.78x | 1.64x | $1,181 | $418 | 82% |
| 13 | Lumen Field | Seattle, US | 3 mi | 2.40x | 1.58x | $1,762 | $541 | 67% |
| 14 | Levi's Stadium | Santa Clara (SF Bay), US | 6 mi | 2.03x | 1.19x | $870 | $339 | 72% |
| 15 | SoFi Stadium | Inglewood (LA), US | 5 mi | 2.00x | 1.24x | $803 | $305 | 81% |
| 16 | Gillette Stadium | Foxborough (Boston), US | 18 mi | 1.88x | 1.26x | $1,082 | $359 | 40% |
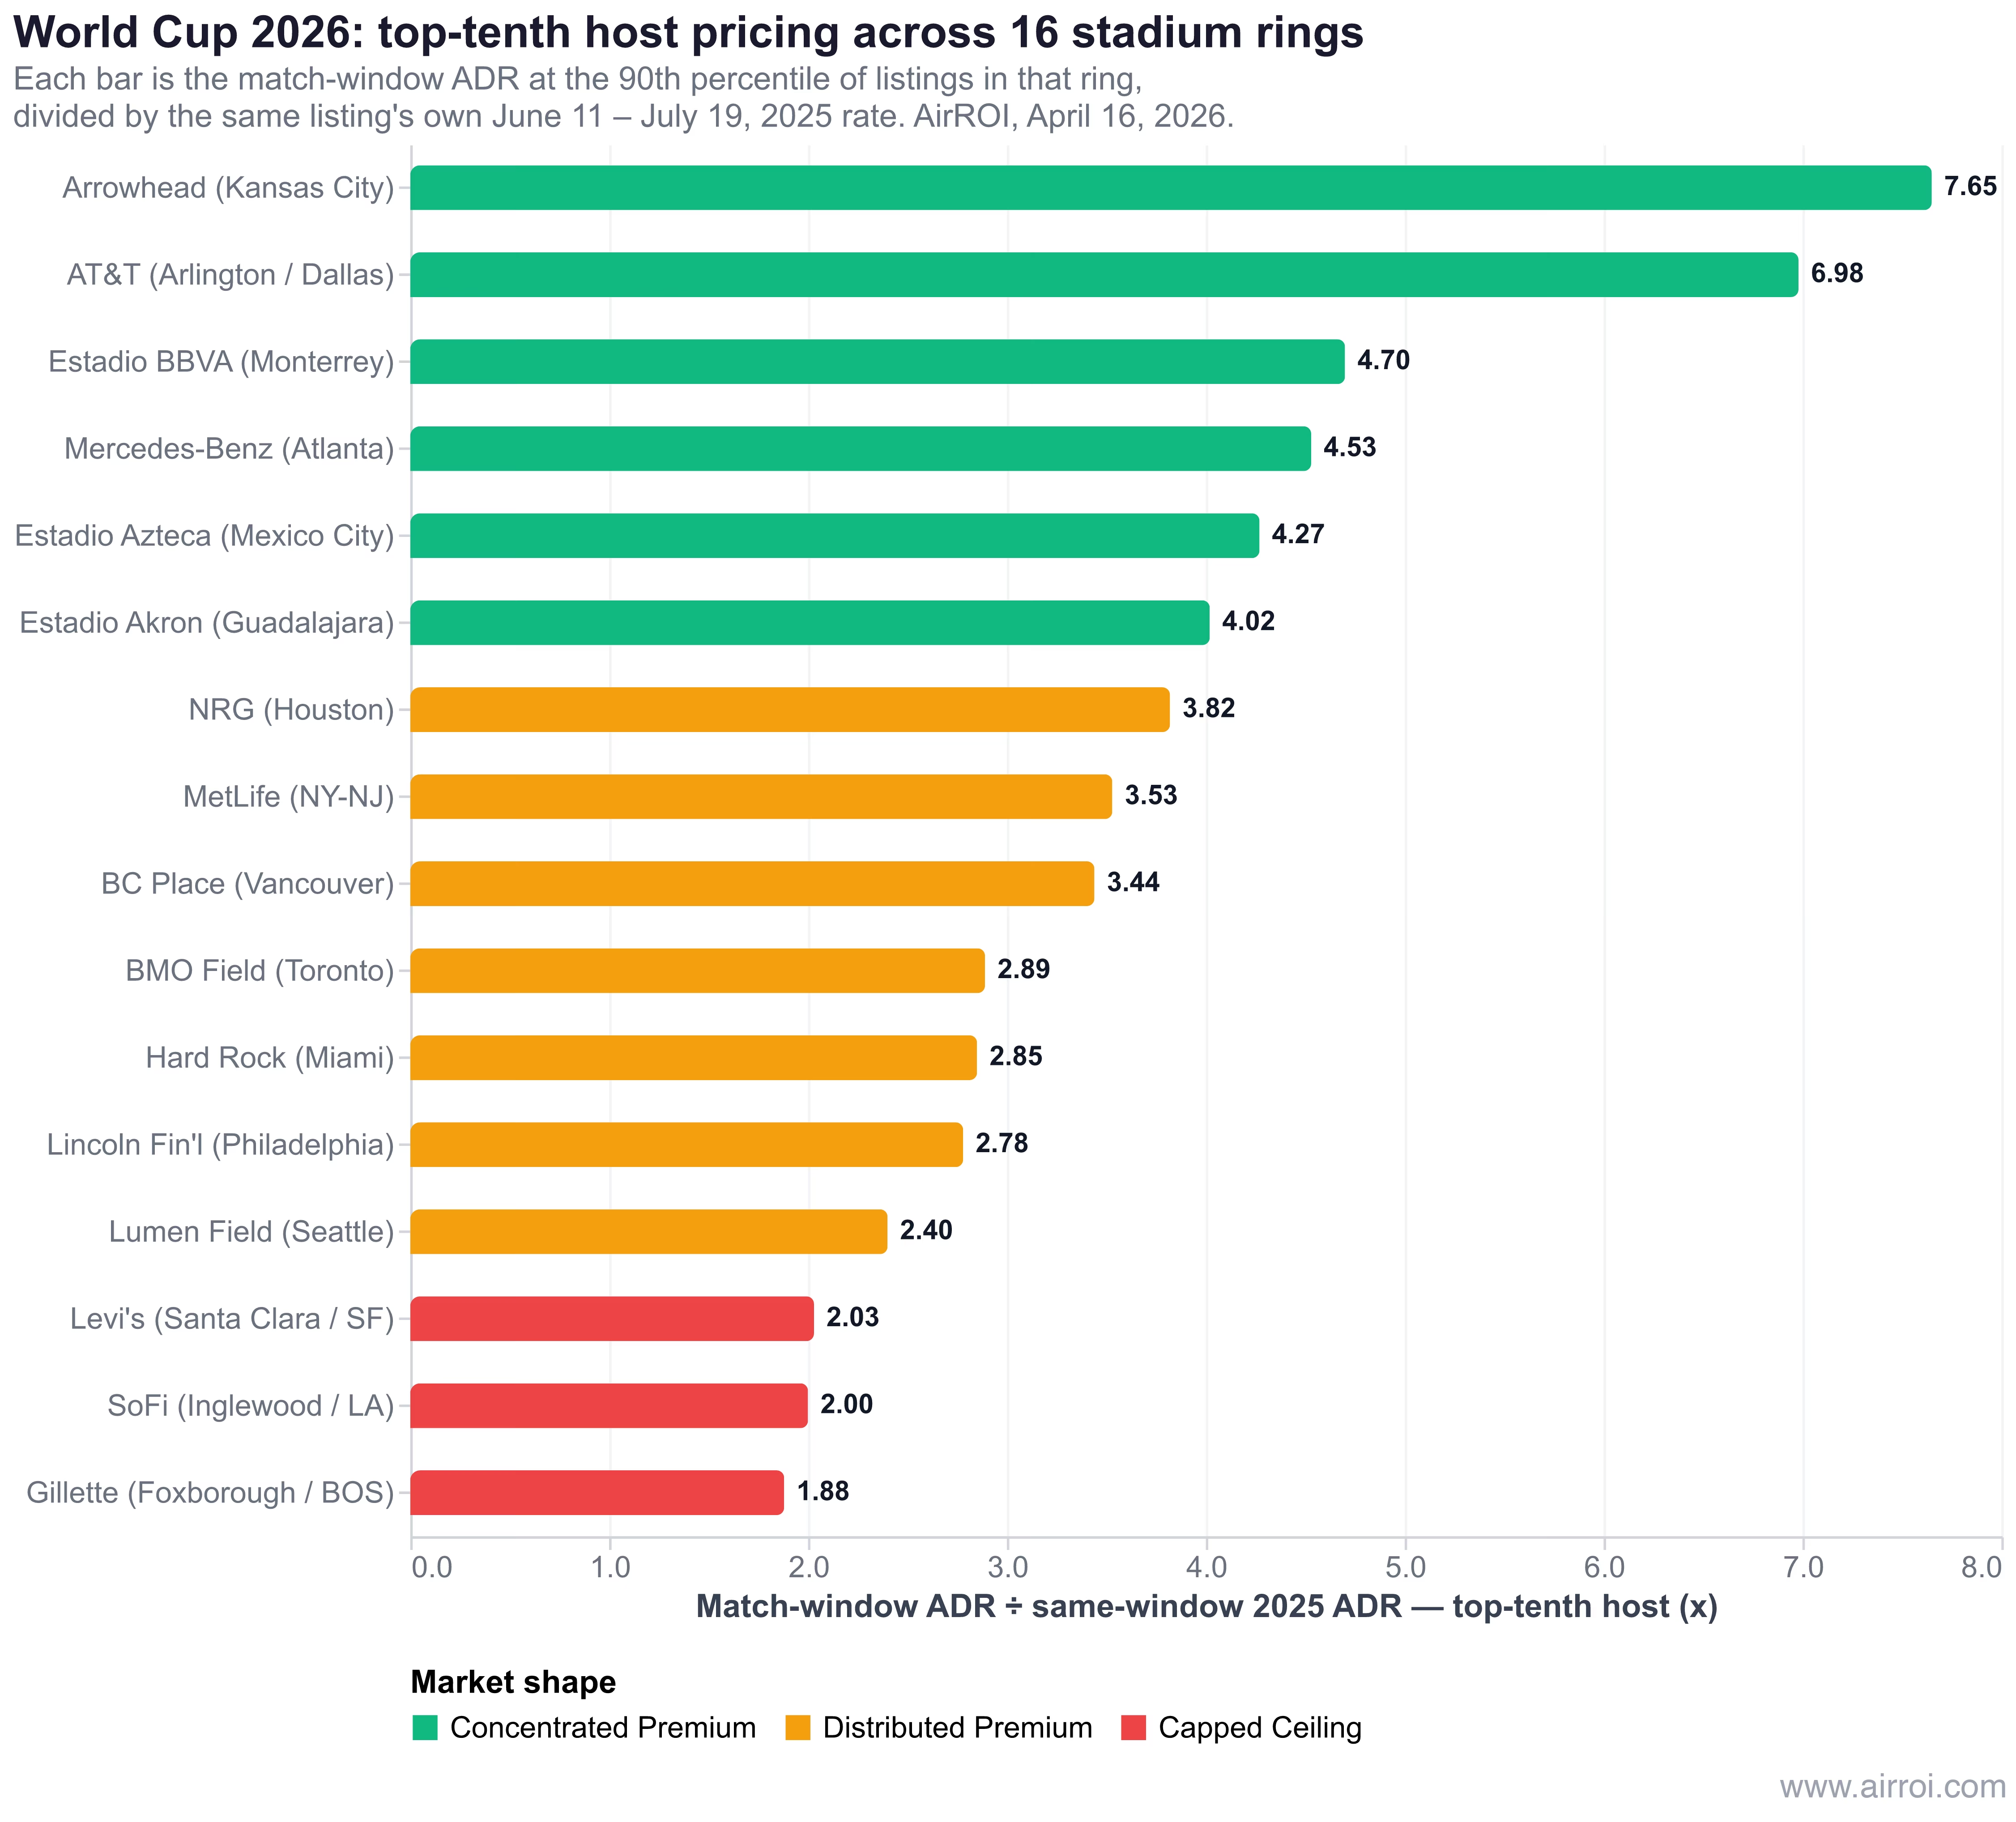
Eyeballing the table, three things stand out. Kansas City and Arlington are in a class of their own — their top-tenth hosts are posting around seven times what they were charging in 2025. The middle band (Houston through Seattle) sits in the 2.4x–3.8x range, a smaller but genuine premium. And at the bottom, coastal California and Foxborough can't clear 2.1x even among their most aggressive operators.
The "typical" column tells a second story worth noting once and moving past. In Kansas City, the ranking's leader, the middle of the pack is running 4.05x — less than the sharpest hosts' 7.65x, but still a strong premium. In Atlanta, the middle is running only 1.70x against a top-tenth of 4.53x — meaning most Atlanta hosts are still priced for a normal summer while a sophisticated 10% have captured the event. In Boston, both groups are close together because there is no ceiling to push against. Wherever the typical figure is far below the top-tenth, a middle-of-the-pack host in that ring is leaving real money on the table. Wherever they're close, the ring is efficient and the arbitrage is limited.
Three shapes of market
The rings sort into three groups that matter more than the ranking itself.
Concentrated Premium — Kansas City, Arlington, Monterrey, Atlanta, Mexico City, Guadalajara. The sharpest hosts are charging 4x to 7.7x. The typical host is at least 1.5x behind them. The tournament's strongest pricing power is available in these rings but not being captured evenly. A Kansas City operator still sitting at 2x for the match window is not wrong in any objective sense — 2x is a real premium — but they're leaving money that three, five, or ten of their neighbors have already claimed. For fans, the signal is the opposite: the ring's advertised price is bimodal, and the cheaper half of the distribution is real inventory, not error.
Distributed Premium — Houston, MetLife, Vancouver, Toronto, Miami, Philadelphia, Seattle. The sharpest hosts are at 2.4x to 3.8x, and the middle isn't that far behind. Pricing power exists — these aren't flat markets — but it's absorbed more uniformly across the ring. The distance between a sophisticated operator and a passive one is narrower, and the catch-up opportunity is smaller. These are the tournament's most efficient rings: what a fan sees is what the market has collectively decided it's worth.
Capped Ceiling — Santa Clara, Inglewood, Foxborough. The sharpest hosts top out around 2x; even they can't push further. The bottom decile of listings in all three rings is posting below last year's same-window rate. The structural features of each zone — supply abundance in Santa Clara and Inglewood, capped inventory absorbed by scarcity rather than price in Foxborough — are the binding constraints. In these rings, "reprice your calendar" isn't the advice. "Know where the ceiling is and don't swing past it" is.
Arlington and Kansas City: the tournament's actual pricing leaders
Arlington's AT&T Stadium is the prime-time venue — nine matches, including a semi-final on July 14, 2026, more than any other host stadium. The ring is a mature short-term rental economy, tuned for years by Cowboys games, Rangers baseball, and college football. And critically, there is no major hotel corridor inside the five-mile ring; the nearest cluster sits 5 to 10 miles east in downtown Dallas or west in Fort Worth. A fan who wants to walk or short-ride to the stadium has 764 active Airbnbs to choose from, and those hosts know the substitute supply is not adjacent.
The sharpest Arlington hosts are running 6.98x on their own 2025 rate, at a top-tenth match-night ADR of $3,092. Individual listings push much further: a three-bedroom is posted at $4,401 per night — 13.87x its own 2025 same-window rate — with 95% of the match window still available. A five-bedroom runs $6,736 (13.32x) with 100% available. The highest single-listing multiplier anywhere in the dataset — 13.87x — comes from the Arlington ring. What makes Arlington stand out isn't just that extreme top; it's that the middle of the ring is also at 4.56x, the highest typical figure of any stadium. The premium is broadly distributed and the upper tail is extreme. That combination is rare. The market is pricing something real.
Kansas City's Arrowhead ring is the surprise. The earlier pass we ran touched only two KC listings and reported a 2.5x median — accurate to those two, but obscured by noise. With a 7-mile ring expanded to 963 active listings, Arrowhead turns out to be the tournament's actual top-tenth leader at 7.65x. A four-bedroom in the ring is posted at $13,629 per match night against a $1,012 baseline (13.47x) with 100% of the window still available — the highest per-listing multiplier anywhere in the Kansas City data. A two-bedroom runs $1,699 against $192 (8.85x). Even the more moderately-priced picks are substantial: a four-bedroom at $1,908 against $469 (4.07x, already 41% absorbed), a five-bedroom at $1,999 against $532 (3.75x, 100% available). The geometry resembles Arlington — suburban stadium, thin walk-to hotel substitute — but with an added wrinkle: Kansas City's Airbnb supply is less professionalized than Arlington's and includes more owner-occupied listings repurposed for the tournament, which pulls the extreme tail even higher. And the spread between the sharpest KC hosts and the typical KC host — 3.60x — is the widest in the tournament. Half of Kansas City hosts still haven't repriced.
For hosts within 3 to 7 miles of either stadium, the posture is the same: an asking rate at the middle of the ring's current distribution — 4.0 to 4.6x the 2025 same-window rate — is no longer an aggressive ask. It's catching up.
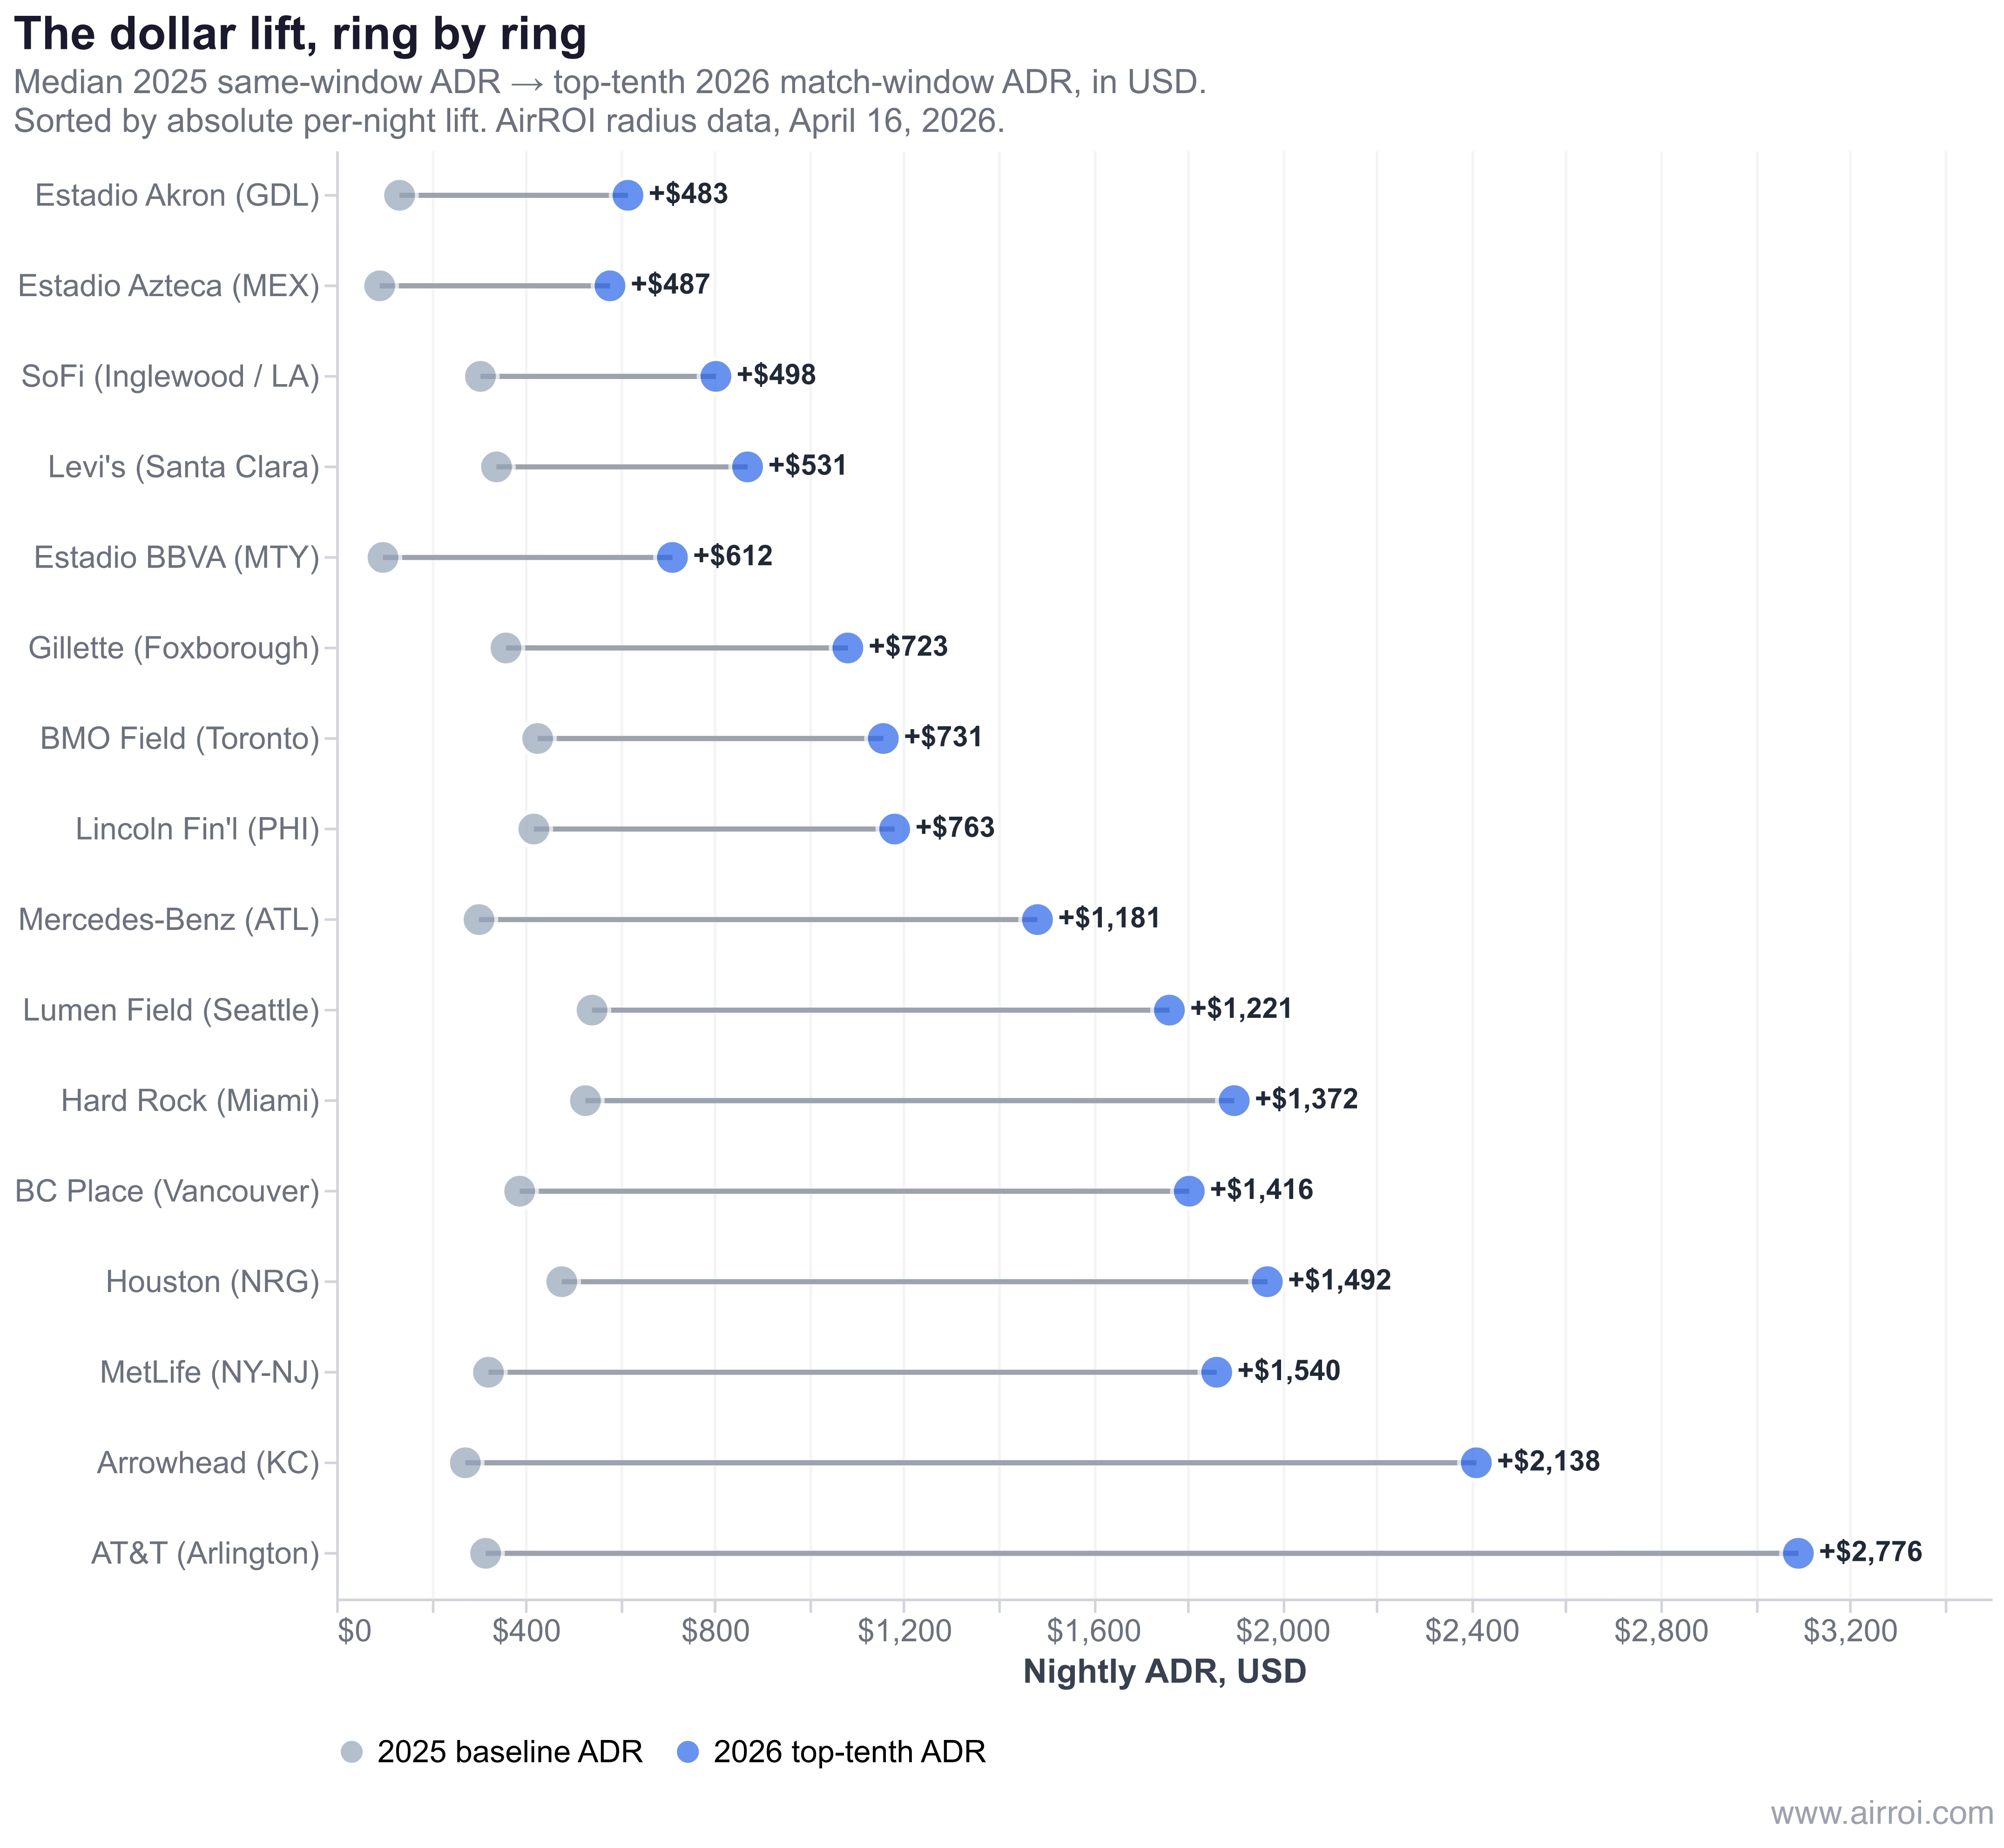
The dollar chart above makes the ranking feel different. Arlington and Kansas City still lead on multiplier, but MetLife ($1,540 lift per night), Houston ($1,492), Vancouver ($1,416), Miami ($1,372), and Seattle ($1,221) push more raw dollars per night than Monterrey or Guadalajara — even though Monterrey's multiplier (4.70x) comfortably tops MetLife's (3.53x). The 4x-plus Mexican multipliers ride on small baselines: a $612 per-night uplift in Monterrey is enormous in percentage terms and modest in absolute dollar terms. The structure of what a host actually captures depends as much on the baseline they started from as on the lift they achieved.
Why SoFi and Levi's refuse to lift
The most surprising finding in the revised data is the flatness of coastal California. SoFi Stadium hosts eight matches, including a quarter-final. Levi's hosts six. Both sit in metros that rank among the world's top travel destinations. And yet:
- The sharpest SoFi host tops out at 2.00x. Even the most aggressive Inglewood-ring host cannot push past a doubling.
- The sharpest Levi's-ring host maxes at 2.03x. The typical Santa Clara listing is at 1.19x — essentially flat to a normal summer.
- The bottom quartile of both rings is posting rates at or below their 2025 ADR. A two-bedroom in the Inglewood ring is listed at $278 per night, down from a $356 baseline. A three-bedroom near Levi's runs $388 against a $628 baseline.
The data isn't broken. Individual listings do push: a two-bedroom near SoFi is posted at $803 (2.77x), a one-bedroom at $917 (2.76x). But those are the tail, not the middle. Ten percent of LA-ring listings are posting less for the match window than they posted on the same dates last year. Something structural is capping this market, and the explanation turns out to be four mechanisms stacking on top of each other.
Supply abundance dilutes pricing power. Arlington's 5-mile ring contains 764 active listings; across nine AT&T Stadium matches, that's roughly 85 Airbnbs per match. Inglewood's 5-mile ring contains 1,431; across nine SoFi matches, 159 per match — nearly twice as many competitors per demand event. Santa Clara's picture is even more dilute. At 5 miles, Levi's has 735 active listings, but at the 10-mile radius that matches the actual fan-lodging footprint of a Bay Area match day (downtown San Jose, Palo Alto, Mountain View all fall inside), the ring contains 3,204 active listings — roughly 534 per match across Levi's six matches, six times Arlington's walk-to-stadium density. A fan booking a Bay Area match night has hundreds of substitutes inside a reasonable commute. A fan booking Arlington has 85. Price discipline collapses at the higher ratio.
The 2025 summer baseline was already elevated. LA and the Bay Area are in peak tourism season during June and July. SoFi's same-window baseline ADR is $305, Levi's is $339 — within rounding distance of Arlington's $316. But Arlington-area June isn't a particular tourism draw; that $316 reflects Cowboys-and-Rangers weekends, not an independent summer season. LA and SF's June-July baselines already carry a beach, Hollywood, and Napa premium baked in. Adding the World Cup on top of an already-peak-priced market produces a smaller multiplicative lift than adding it to an off-season one. The absolute-dollar uplift at SoFi ($498 per night at the top-tenth) isn't trivial, but it's a linear addition to an already-high base, not a multiplicative surge.
Professional hosts on dynamic-pricing tools dampen speculation. Coastal California's short-term rental economy is unusually concentrated in professional operators using tools like PriceLabs, Wheelhouse, and Beyond. Those tools price from realized forward booking demand and from competitive comp sets, not from speculative event anticipation. If the Inglewood ring's competitive set is priced at a typical June weekend, the algorithm will price to match — regardless of whether a World Cup match is scheduled. Only when a meaningful share of the competitive set actually raises prices does the algorithm begin to follow. The result is a coordination problem: each sophisticated operator waits for the others. In Arlington, where independent operators dominate, the coordination resolves quickly through speculation. In coastal California, it resolves slowly or not at all.
Hotel substitution is brutal. LA and the Bay Area combine massive hotel inventory with well-developed airport-and-transit substitution. A SoFi fan can stay in Downtown LA, Santa Monica, Hollywood, Long Beach, or Anaheim — each 10 to 30 miles out and served by reasonable hotel pricing. A Levi's fan can stay in San Francisco proper, in downtown San Jose, in Palo Alto, in Mountain View. Each alternative caps how much the stadium-proximity ring can charge. In Arlington, the nearest serious hotel cluster is 5 to 10 miles away; for a walk-or-short-ride fan the substitution is harder, and the rental-price cap is correspondingly higher.
Layered on top in LA: the city's Home-Sharing Ordinance caps non-primary-residence listings at 120 nights per calendar year, pushing operators who would otherwise run the full 39-night match window toward shorter stays or 30-plus-night rentals. The effect is to pull the most aggressive pricing out of the active market entirely — a listing that's already pre-blocked for a 30-day corporate contract cannot contribute to match-window pricing at all.
For a host inside the Inglewood, Santa Clara, or Foxborough rings, the honest read is that the ceiling is hard: 2x is approximately what the market will bear. Above that, listings go unbooked. Below that, the spread is broad and catching up is worth doing — but betting 5x in any of those three rings is betting against the structural evidence.
MetLife, revisited
MetLife Stadium hosts the July 19, 2026 World Cup final, the single most-watched venue event in global sport. Our earlier reading — that the final-hosting ring commands only a 3.8x multiplier, with a median final-night print of $1,018 — stands up at the typical listing (now refined to 1.83x on the same-window baseline, which is the lowest multiplier of any final-hosting venue in recent memory). But it was incomplete. The sharpest MetLife hosts are running 3.53x at a match-night ADR of $1,862 — roughly $1,540 per night above baseline. Real money across 39 match nights.
Three observations matter at once.
The typical MetLife host has not aggressively priced the final. This fits the substitution story: Manhattan's hotel inventory is among the densest in the country, and Manhattan is five miles from MetLife via NJ Transit or the Lincoln Tunnel. A fan can stay Midtown at $400 to $800, cab to Penn Station, and ride one NJ Transit stop to Secaucus for a stadium shuttle. The substitute supply is so deep that most MetLife hosts cannot credibly charge final-night prices that match Arlington's semi-final prices. The typical posted rate reflects that.
The sharpest MetLife host has extracted a real premium anyway. The mechanism is product differentiation: a detached home three miles from the stadium is not a substitute for a Manhattan hotel room, and a guest willing to book it has already rejected the Manhattan alternative. That guest is price-insensitive, and the sharpest MetLife hosts have identified and priced for them.
Availability is the signal this ring really wants you to see. Only 51% of the 39 match nights remain listed as available across MetLife listings — the tournament's second-tightest number, behind only Boston. The MetLife ring has already absorbed roughly half its inventory, which is what happens when the sophisticated top tenth and a meaningful share of the middle distribution have collectively cleared their calendars. For the fan, the practical read is that the ring does have real inventory at $500 to $900 a night — the passive half of the distribution — and it will probably clear closer to those levels than to Arlington's $3,000 semi-final prices. For the host still to price, the sharpest MetLife listing is asking $1,862 and still has inventory. The ceiling is real; it's just not uniformly captured.
The Mexican cluster: broad premium, modest dollars
Monterrey, Mexico City, and Guadalajara share a coherent pattern. Their sharpest hosts are all between 4.02x and 4.70x. Their typical listings are all between 1.99x and 2.52x. The spread between the two — in the middle of the tournament's range — tells you the premium is neither concentrated in a thin tail (as in Atlanta) nor uniformly absorbed (as in coastal California). Somewhere between a quarter and a third of each ring has priced the event aggressively, and the rest is catching up.
The absolute-dollar story is the inverse of the multiplier story. Monterrey's sharpest hosts are asking $711 per night against a $99 baseline — a $612 per-night uplift. Mexico City's $579 sits on a $92 baseline — a $487 lift. Guadalajara's $617 on $134 — a $483 lift. Those are enormous moves in local-currency percentage terms but relatively modest absolute-dollar entries into a globally-travelling fanbase's lodging budget. A fan flying London to Monterrey pays £1,800 for airfare and pays $700 a night without flinching because £1,800 is the number that hurts.
The three Mexican rings diverge on one dimension worth naming: availability. Monterrey and Mexico City both retain 92-96% availability eight weeks out. Guadalajara sits at 78%. The pattern likely reflects both Monterrey and Mexico City's deeper supply and the front-running pricing we observed a month ago — hosts in both cities raised rates enough early that price has rationed demand rather than filled the calendar. Guadalajara's availability is tighter because its ring is simply smaller (118 active listings within 2 miles, roughly 1,500 within 5 miles).
One anecdote worth preserving from the earlier analysis: a single Monterrey unit moved from $95 per night in May 2025 to $1,152 from June 15 onward — a roughly 12x shift on one listing. That's the front-running pattern made individual. The current top-tenth Monterrey figure (4.70x) is a disciplined aggregation of many such moves across the ring.
Four trajectories across the calendar
The scorecard and the dollar chart above show a snapshot. The trajectory chart shows how four representative rings got to that snapshot — and what happens on either side of the match window.
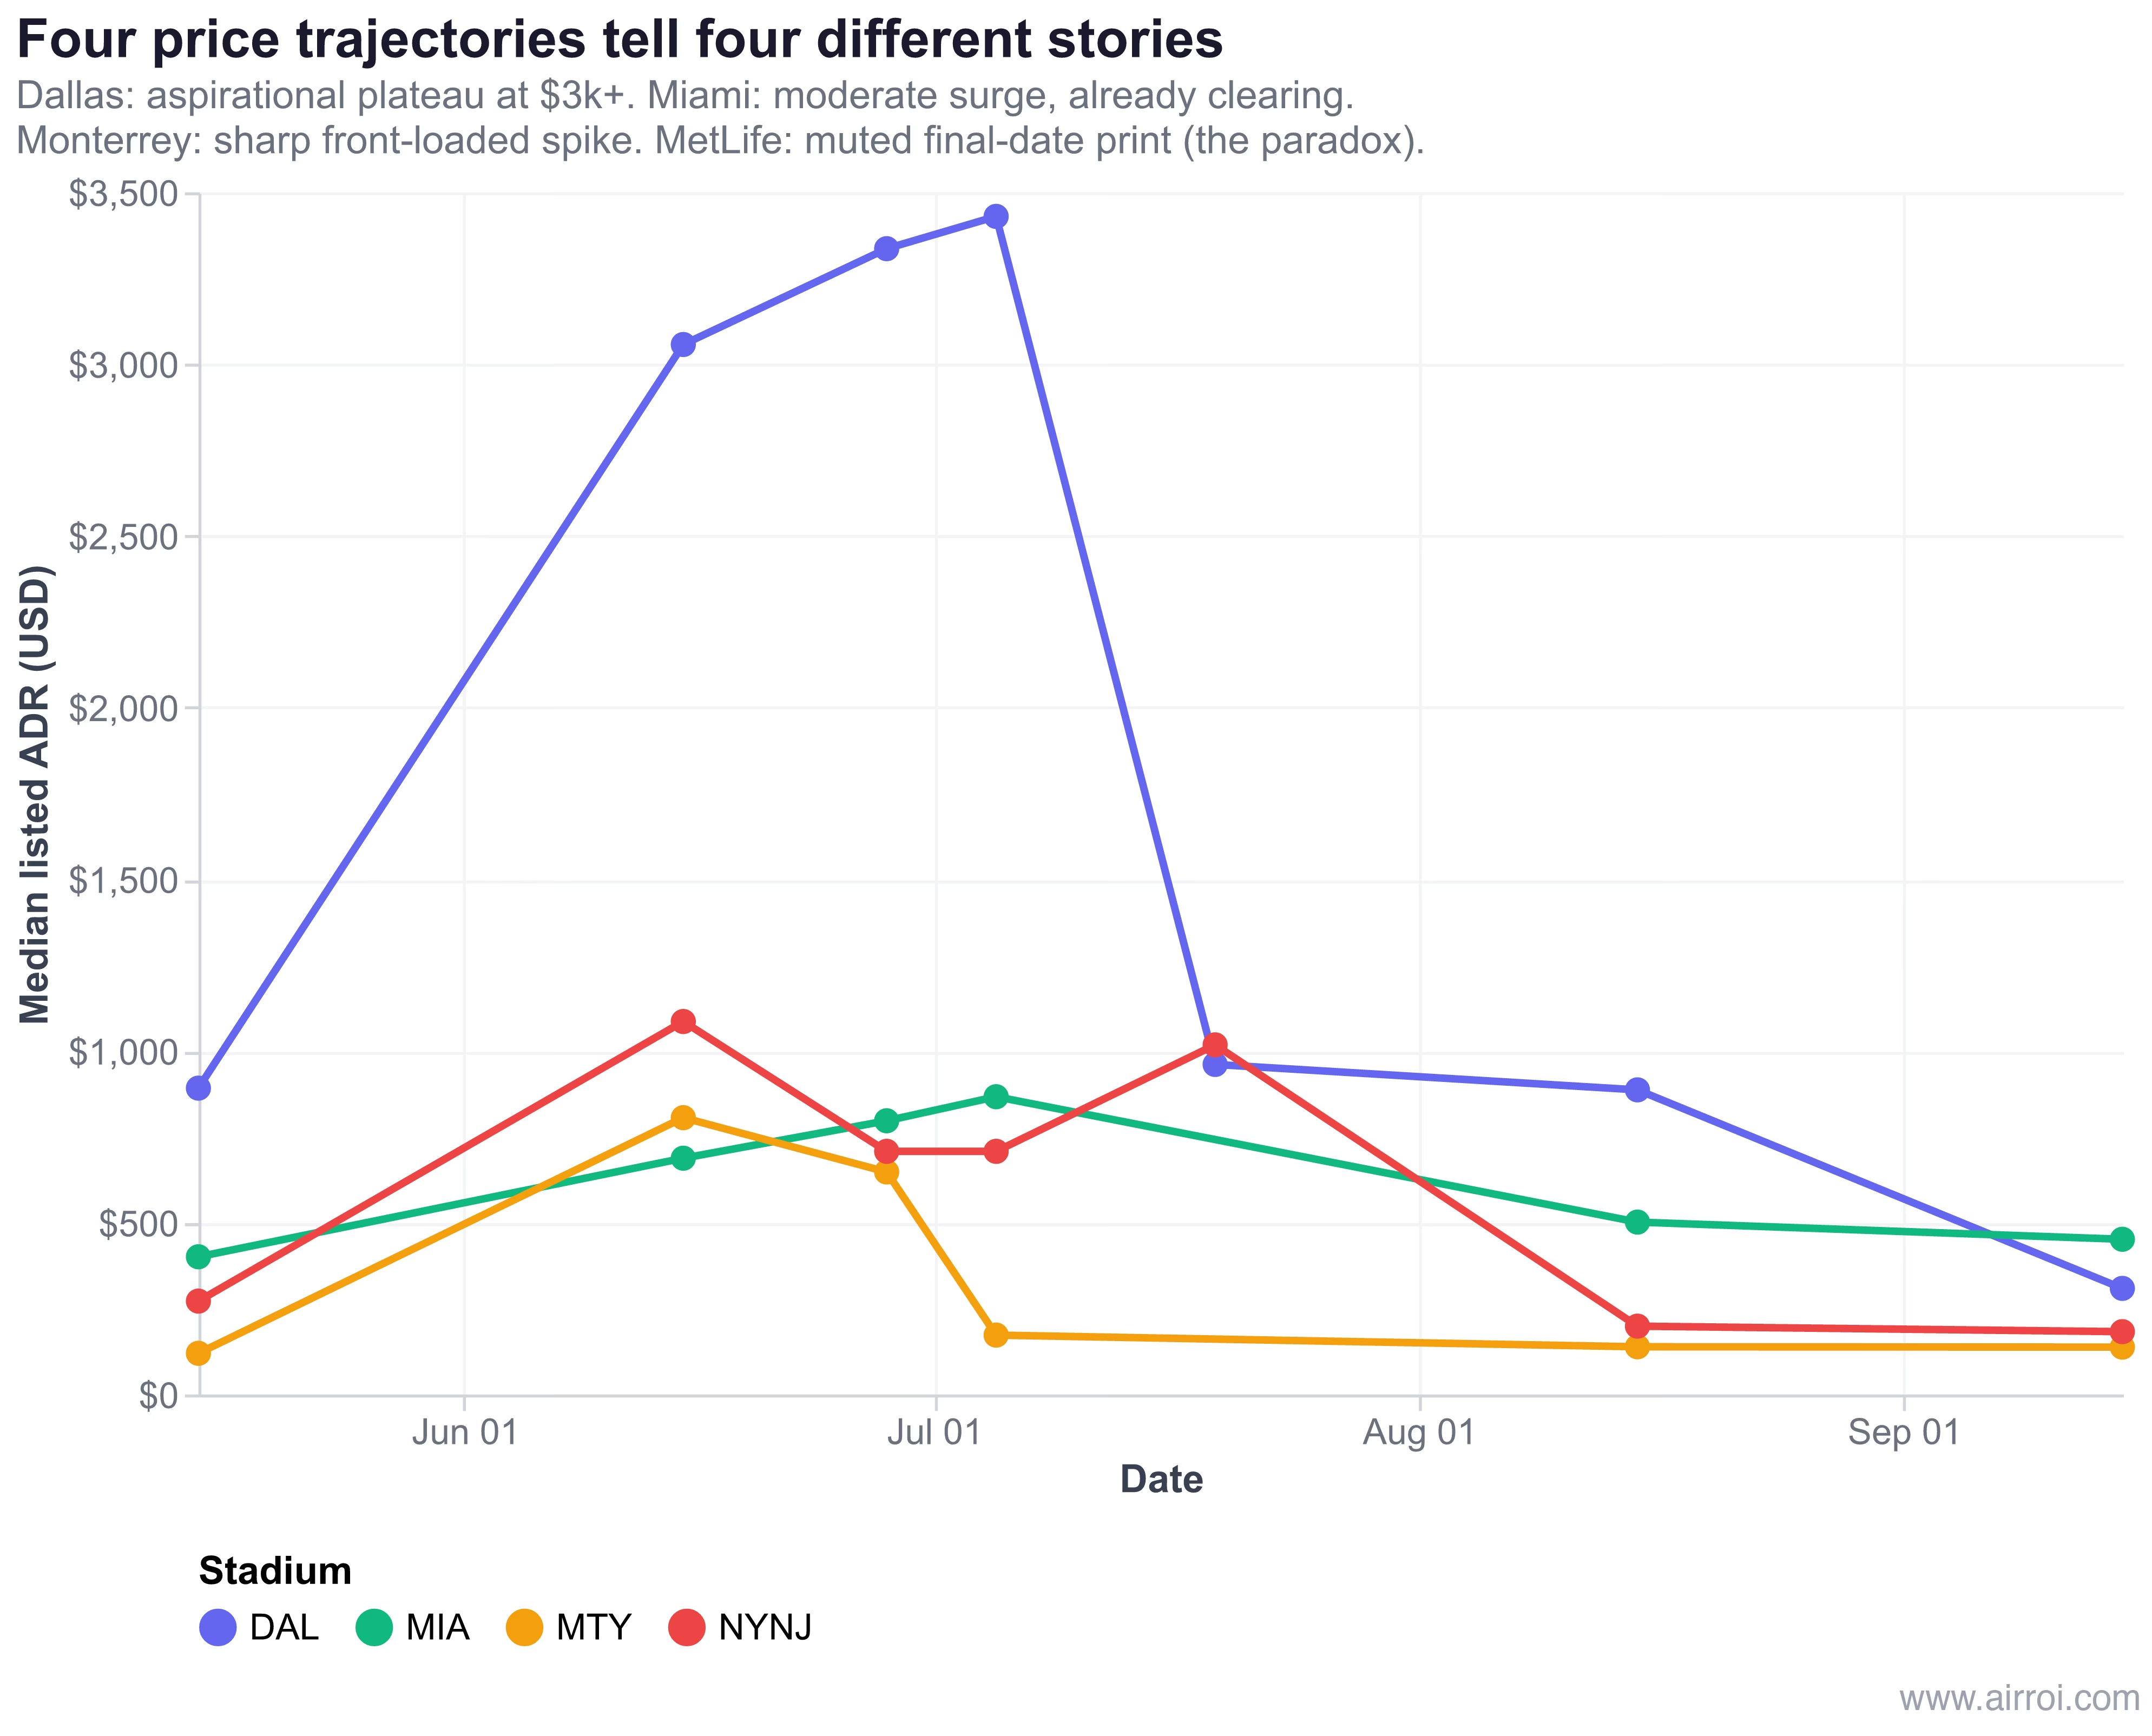
Arrowhead holds a $2,000+ plateau for the whole window. The top-tenth Kansas City host isn't pricing a handful of match days — they're committed to the tournament-length premium, holding above $2,700 for the full 39-night window before the line drops sharply the day after the final. These hosts aren't hedging; they're assuming full demand across the group stage plus knockouts.
MetLife sustains a $1,900 premium across the window, then collapses. The trajectory rules out the alternative story — that the sharpest MetLife hosts are betting only on the July 19 final — and replaces it with something simpler: they're holding a broad tournament-window premium that the market has already absorbed roughly half of. Post-window the line falls to $200, underscoring how tightly the premium is scoped to the actual match dates.
Monterrey spiked early and is now fading. The top-tenth Monterrey line peaks in late May / early June at $1,100, then drifts down during the tournament itself. That's front-running made visible: aggressive hosts priced early enough that they've pulled in their best calendar, and the ring's asking distribution is now moderating. A fan shopping Monterrey today is shopping into softening prices, not hardening ones.
SoFi stays essentially flat the whole four months. No ramp-in, no plateau, no drop-off — just a $700-$900 band through May, June, July, and August. That's the capped ceiling made visible: whatever dynamic pricing LA hosts are running, it is not detecting event-scale demand.
Where the calendars are filling up
Two rings tell a different story in the availability column than they tell in the multiplier column.
Foxborough (40% available). Boston's stadium-proximity supply is the tournament's most constrained, with only 111 active listings within 10 miles of Gillette and 423 within 15 miles. Our qualified pool required widening the ring to 18 miles — capturing Boston's southwestern suburbs and the northern edge of Providence — before 300 transacting listings were found. Inside that wide ring, the sharpest host runs only 1.88x. But the available-night share is the lowest in the tournament. Boston shows what Arlington doesn't: demand clearing through volume rather than price. Fans are booking Foxborough-adjacent inventory at modest premiums, and they're booking it fast. For a Gillette-ring host still to price, the read is that 1.3 to 1.7x is fine — the ring will clear — but sitting above 2x without data support is not.
MetLife (51% available). Manhattan-hotel substitution caps the ceiling at a modest premium, but that modest premium has still attracted significant booking. Half the match-window nights have already been absorbed. What remains is priced heterogeneously, with the active-but-not-yet-booked inventory concentrated in the passive-pricing segment of the ring. A fan booking MetLife at sub-$500 still has inventory to shop.
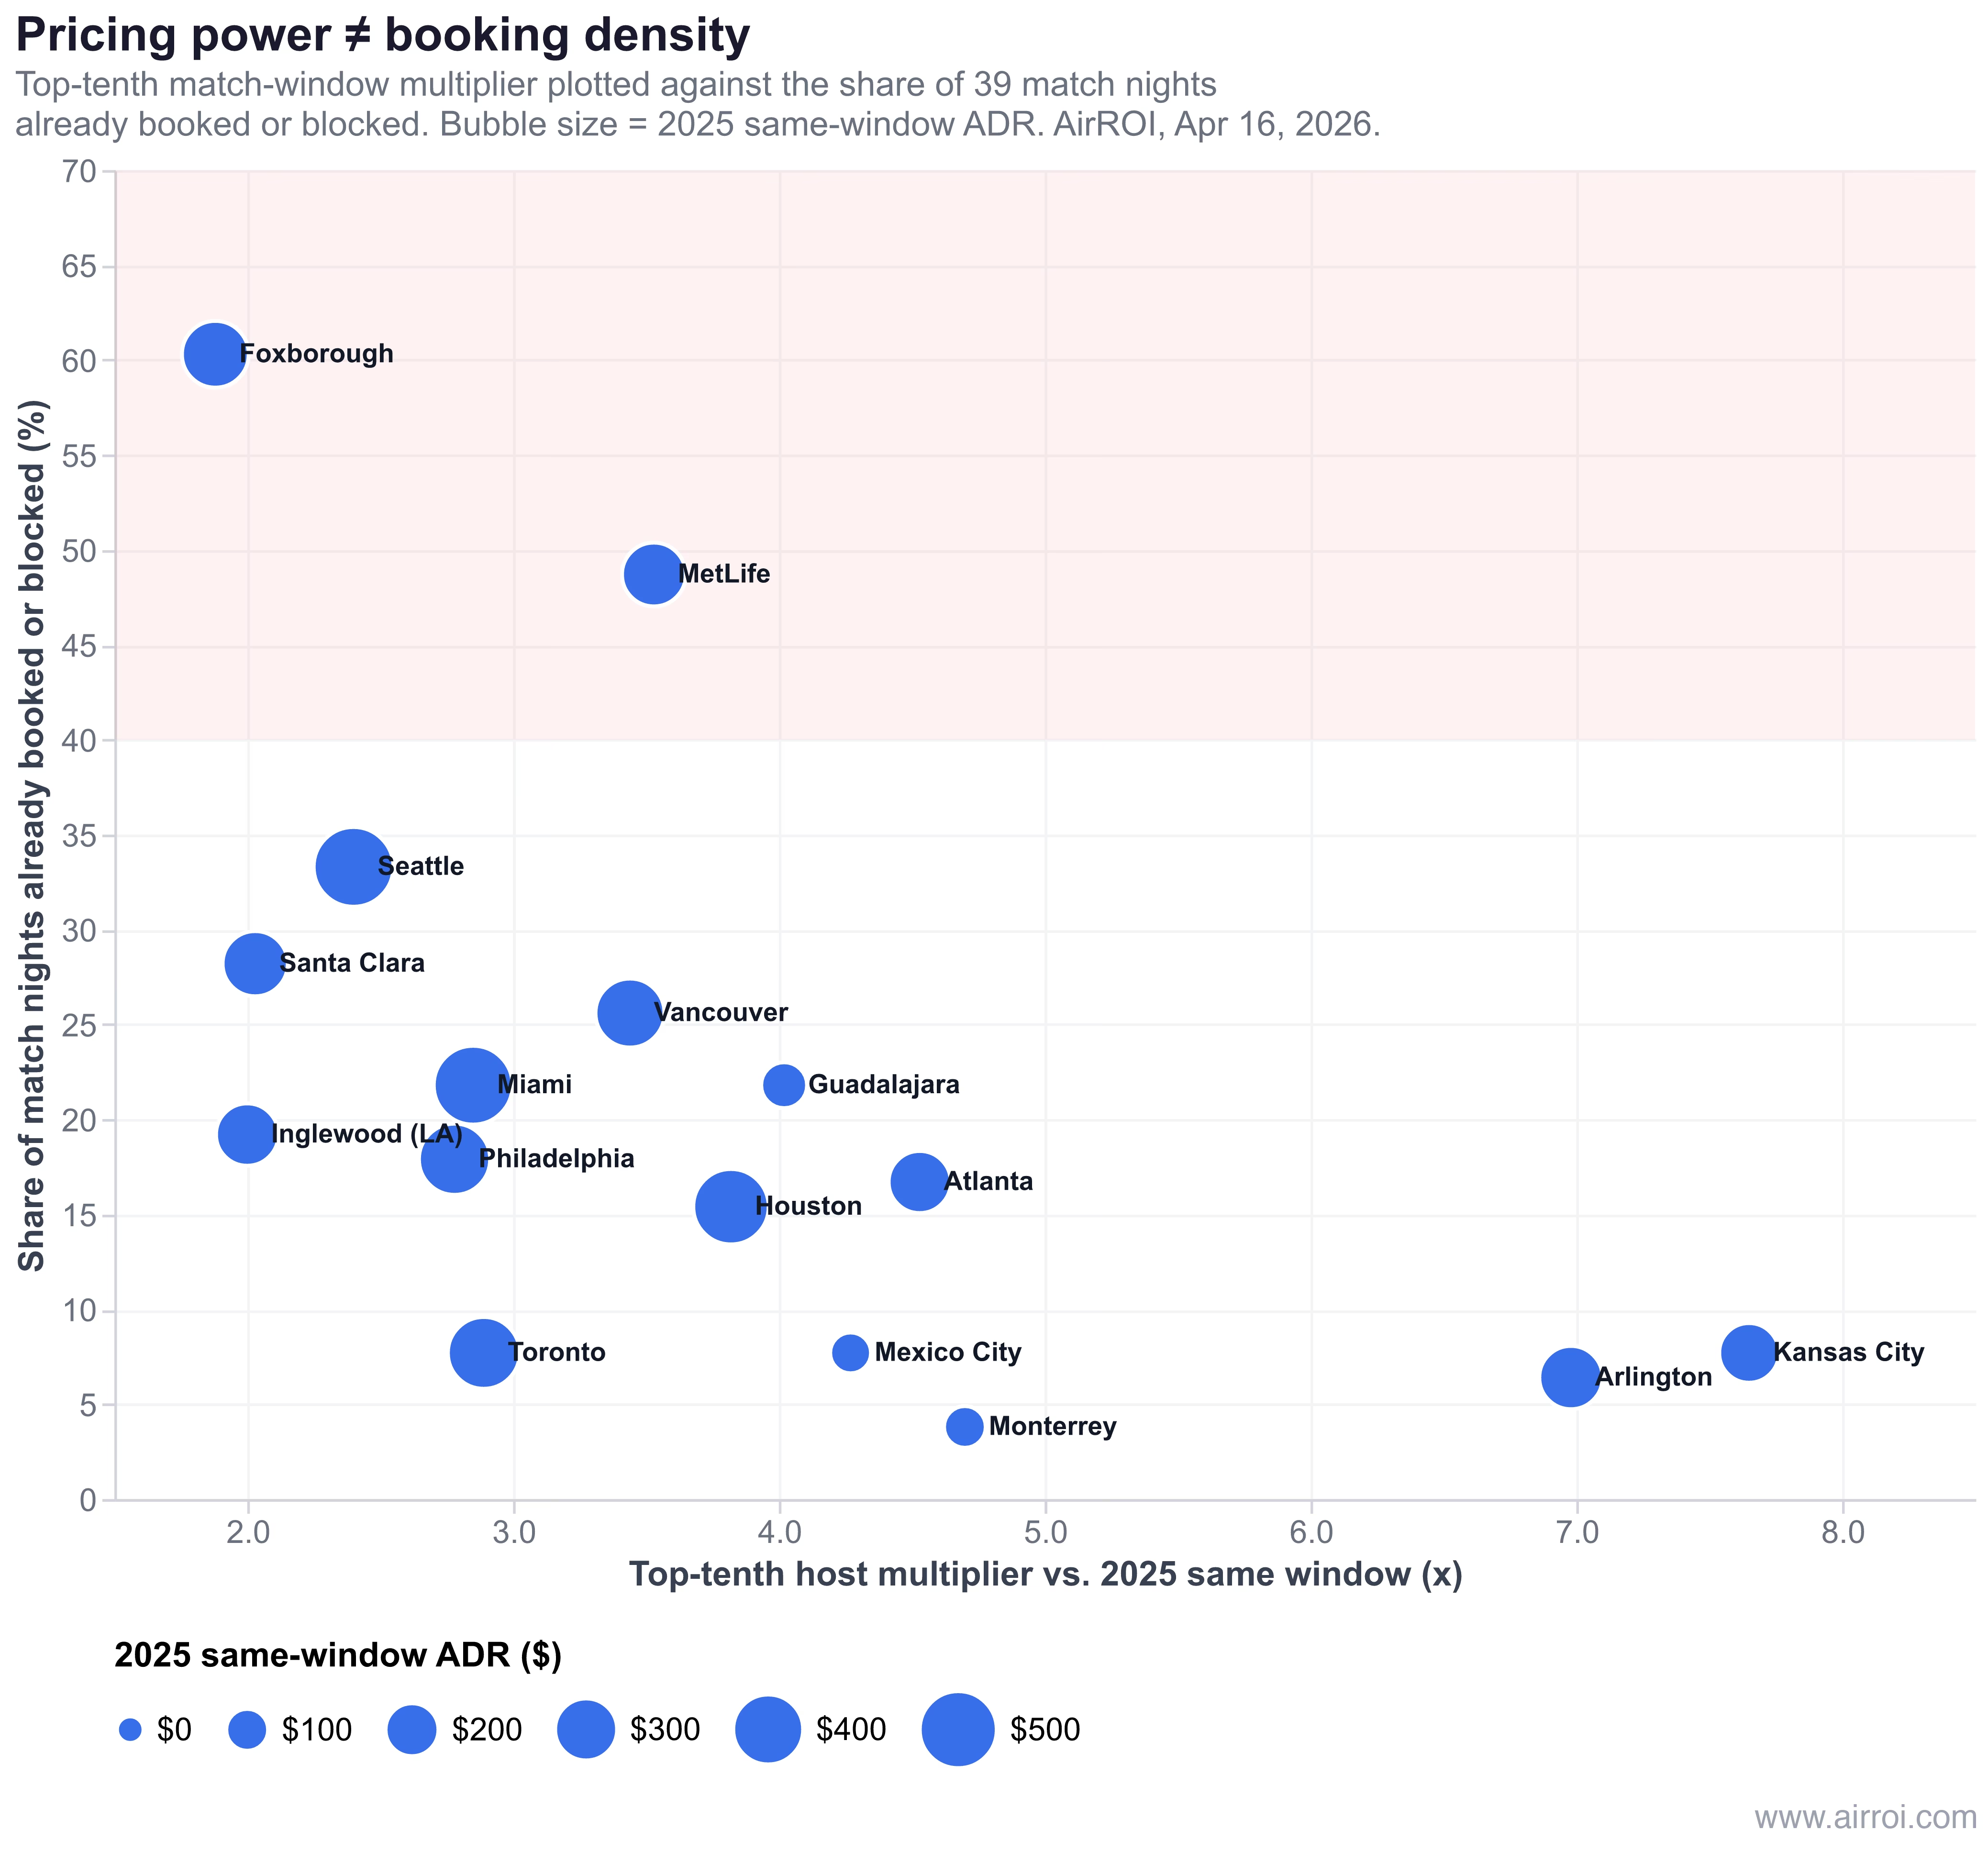
The scatter above matters because it decouples pricing power from realized demand. A ring can have low multipliers and high booking density (Foxborough, MetLife), indicating demand is real but price-capped by structure. A ring can have high multipliers and low booking density (Arlington 6%, Kansas City 8%, Monterrey 4%), indicating aggressive pricing that hasn't yet cleared. Neither is wrong — they tell different stories about eight weeks from kickoff.
What to do with this table
If you're reading this as a host, four situation-dependent reads emerge from the data.
If you're inside the Kansas City, Arlington, Atlanta, Monterrey, Mexico City, or Guadalajara rings — the sharpest hosts' 4-7x numbers are the ceiling you should be reading, not a fantasy. If you're currently posted at the typical or below, the catch-up is real and large. A Kansas City host moving from 2x to 4x isn't being aggressive; they're catching up to the middle. A Kansas City host moving from 4x to 6x is claiming the catch-up-to-the-sharpest-hosts opportunity that roughly 10% of their neighbors have already claimed.
If you're inside the Houston, MetLife, Vancouver, Toronto, Miami, Philadelphia, or Seattle rings — the catch-up opportunity is narrower, and the ceiling is meaningfully lower. Repricing from the typical to the top-tenth captures a 1.0 to 1.9x lift on a base that is already elevated. Pushing above the top-tenth is a low-probability bet; the passive half of this band is more disciplined than in the Concentrated rings, and there are fewer aggressive outliers to pull the tail up.
If you're inside the Inglewood, Santa Clara, or Foxborough rings — the ceiling is hard. The sharpest host in each zone is at 2x or just under it; the bottom decile of all three rings is actually pricing below last year. A Santa Clara host repricing from 1.0x to 1.8x is doing the right thing; a Santa Clara host attempting 4x is betting against the structural evidence. The honest read is: catch up to the ceiling, don't attempt to establish a new one.
Everywhere, availability is the sharper lever than multiplier. Foxborough (60% absorbed) and MetLife (49% absorbed) are filling faster than anything else. Hosts with still-available nights in those rings should be repricing down to capture the remaining demand before it moves to substitute supply. Hosts with still-available nights in Dallas (6% absorbed) and Monterrey (4% absorbed) have more time — the calendar isn't yet the binding constraint.
Methodology and caveats
- Scope. Thousands of active listings discovered via radius search around each stadium's coordinates, filtered to listings with sufficient booking history in both the 2025 and 2026 windows. Per-stadium ring radius (reported in the scorecard) was set to the tightest distance that assembled a stable qualified pool — as narrow as 2 miles where supply was deep, wider where it was not.
- Baseline vs. numerator. Each listing's mean of posted daily rates across the same 39-night match window (June 11 to July 19), compared year-over-year — 2025 as denominator, 2026 as numerator, both USD-normalized. Seasonality is controlled by construction.
- Aggregation. Per listing: match multiplier = mean(2026 daily rates) / mean(2025 daily rates). Per stadium: typical = median of per-listing multipliers; top-tenth = 90th percentile. Available % = median share of the 39 match nights still listed as available.
- What this does not measure. Transacted prices. Cleaning fees and taxes layered at checkout. Listings that have been pulled from the platform entirely for the tournament (LA HSR cap, some Vancouver regulatory adaptations). The methodology captures posted asking rates — the signal a fan shopping the market sees, and what a host is publicly committing to.
- Error bars. For deep-supply zones (Atlanta, Toronto, Vancouver, Seattle, Guadalajara, Mexico City), the typical and top-tenth figures are stable across reasonable resampling. For zones where the qualified pool is thinner (Boston, Kansas City, San Francisco), treat single-zone figures as ±15-20% and cross-zone comparisons as directional.
Eight weeks from kickoff
The tournament's Airbnb premium is not a single number and not a uniform lift. It's a distribution, and the distribution's shape varies stadium by stadium in ways that are structural, not random.
In Arlington and Kansas City, the shape is a long right tail: a handful of operators capture 7 to 14x the 2025 rate, a larger middle sits at 3 to 5x, and a passive minority hasn't yet priced the event. Hosts in the middle are watching a real premium and can still reprice upward.
In Monterrey, Mexico City, Atlanta, and Guadalajara, the shape is two distinct clusters: a small aggressive tail at 4 to 6x, a larger typical group at 1.7 to 2.5x, and very little supply between them. The bimodality is the signal. Fans find inventory at both prices and can choose; hosts should know that the conservative middle and the aggressive tail coexist without either dominating.
In Miami, Houston, MetLife, Vancouver, Toronto, Philadelphia, and Seattle, the shape is a modest smooth curve: top-tenth multipliers of 2.4 to 3.8x, typical of 1.4 to 2.0x, and an even distribution between them. Most hosts have priced the event somewhat; the sophisticated tenth have priced it more. These are the most efficient rings in the tournament — the price a fan sees is close to the market's honest aggregation.
In Inglewood, Santa Clara, and Foxborough, the shape is a compressed distribution under a hard ceiling. The sharpest host in each of those rings has done approximately what they can do, and it is a doubling — not a tripling, not a septupling. The structural features of each zone (supply, algorithms, hotel substitution, regulation, thin walk-to inventory) are the binding constraints. Hosts in those rings should price to the observed ceiling, not above it. Fans shopping them are in a genuinely reasonable market.
The city-wide narrative of the 2026 World Cup's Airbnb economy — $156 million across 11 U.S. cities, roughly $4,000 per U.S. host — is not wrong; it's a smooth average over sixteen very different rings. The ring is where the market lives, and inside each ring, the story isn't the single average. It's the gap between the host who priced the World Cup and the host who didn't. Eight weeks from kickoff, the sharpest hosts have found their ceiling. The rest will either catch up, or watch the tournament clear around them.