The $93 Billion Mirage: How Much of Airbnb's 2025 US Economic Impact Actually Reaches Hosts?
Across 10 major US markets analyzed with AirROI's trailing twelve-month data, aggregate direct host gross revenue totals roughly $1.87 billion, or just 2% of the $93 billion headline. Scaled across every US Airbnb listing, direct host gross likely lands between $15 billion and $20 billion. The other ~$73 billion is visitor spending in local restaurants, retail, transportation, and attractions — real economic activity that matters to cities, but not money that flows to hosts. And of the dollars that do move through a booking, hosts keep between 51.6 cents (Nashville) and 58.8 cents (New York) per $1 of gross guest outlay after platform fees, occupancy taxes, cleaning, and baseline operating costs.
This analysis deconstructs the $93B claim using real AirROI market-level data, traces where every guest dollar actually flows, and ranks 10 major US markets by host capture rate. The goal is not to dispute Airbnb's methodology — it is to translate a macro headline into the number hosts actually need for investment decisions.
What Exactly Is the $93 Billion?
Airbnb's economic impact figures follow a standard tourism-economics playbook. A fraction of the total is direct host revenue — money guests pay for a booking. The larger portion is indirect and induced visitor spending: the restaurant meals, Uber rides, museum tickets, grocery runs, and souvenir purchases guests make while staying at an Airbnb, plus the follow-on jobs and wages those dollars create. Industry impact studies typically split the total roughly 15-25% direct / 75-85% indirect and induced.
Applied to Airbnb's $93B: direct host gross revenue is plausibly in the $15-20B range nationwide. The remaining $73-78B represents guest spending that a short-term rental brings into local economies but that does not reach host bank accounts.
We can bound the direct-host figure using AirROI data. Our 10-market sample covers 63,397 active listings with a combined annual gross of $1.87B. Airbnb reports more than 1.5M active US listings in its most recent platform disclosures; applying the 10-market weighted average naively suggests $40-45B in theory — but our sample over-indexes on high-revenue urban and resort markets. Adjusting for the long tail of low-revenue rural and spare-room listings, a realistic nationwide direct-host gross estimate is $15-22B, consistent with independent industry estimates.
The takeaway: the $93B headline is true, but at least three-quarters of it is money that never touches a host's payout. Any prospective investor reading the headline as a proxy for "how big the host opportunity is" is reading the wrong number.
The 10-Market AirROI Dataset
To translate the macro claim into host-level economics, we pulled AirROI trailing-twelve-month market summaries for 10 leading US markets covering a cross-section of urban, leisure, and hybrid destinations.
| Market | Occupancy | ADR | RevPAR | Annual Rev / Listing | Active Listings | Aggregate Gross |
|---|---|---|---|---|---|---|
| Miami, FL | 50% | $291 | $143 | $34,590 | 7,945 | $275M |
| Seattle, WA | 55% | $238 | $133 | $33,583 | 5,416 | $182M |
| Phoenix, AZ | 48% | $289 | $142 | $31,894 | 6,104 | $195M |
| Los Angeles, CA | 48% | $317 | $158 | $30,467 | 10,264 | $313M |
| Orlando, FL | 50% | $247 | $123 | $29,814 | 3,899 | $116M |
| Austin, TX | 45% | $300 | $131 | $29,690 | 8,894 | $264M |
| Nashville, TN | 45% | $368 | $163 | $38,331 | 2,060 | $79M |
| Denver, CO | 54% | $222 | $121 | $28,072 | 3,787 | $106M |
| Las Vegas, NV | 42% | $277 | $117 | $23,972 | 3,375 | $81M |
| New York, NY | 50% | $226 | $123 | $22,677 | 11,660 | $264M |
| Total | $29,530 avg | 63,397 | $1.87B |
Nashville leads on revenue per listing at $38,331 — the highest ADR in the set ($368) combined with respectable occupancy. New York sits at the bottom on per-listing revenue ($22,677), a direct consequence of Local Law 18's effective ban on sub-30-day stays in entire apartments without host presence. The 11,660 NYC "active listings" in AirROI's data are almost entirely long-stay and extended-furnished rentals, which is why the NYC median length of stay is 10.7 nights — more than double any other market in the sample.
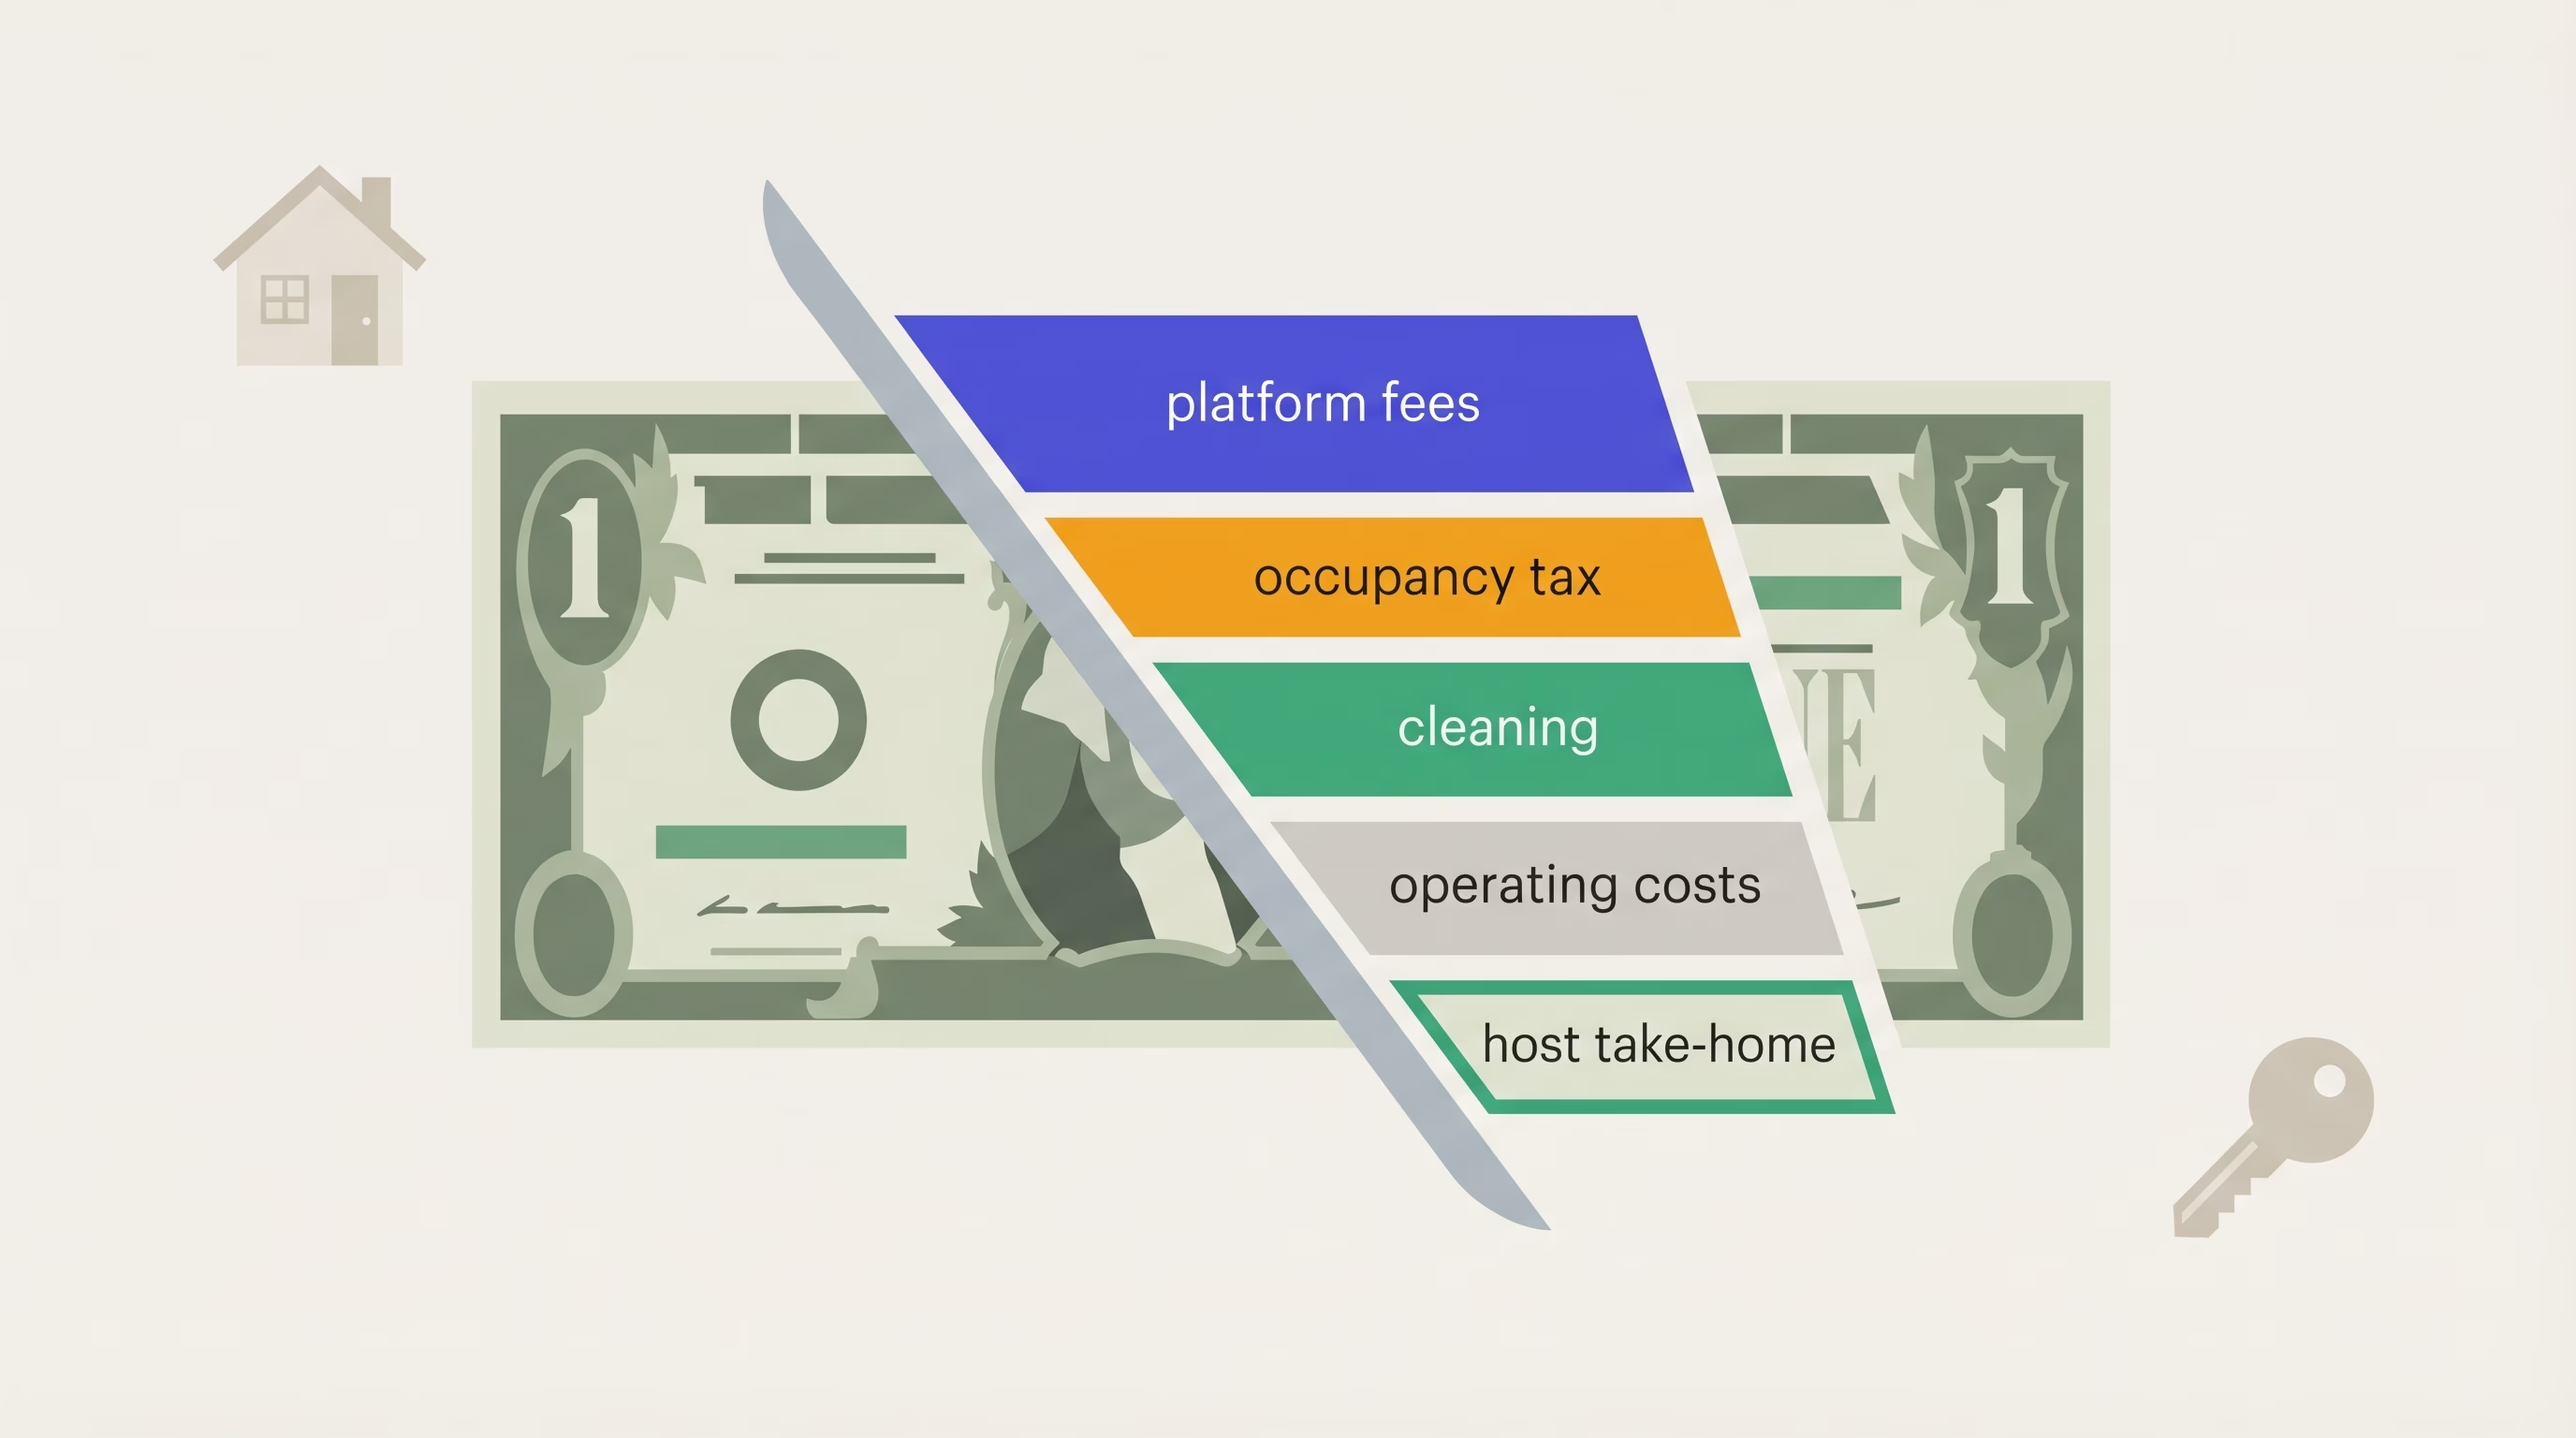
The Anatomy of an Airbnb Dollar
Every guest checkout on Airbnb contains five distinct claims on the same pool of money before the host sees a cent of take-home pay:
1. Nightly revenue × nights — the base rate the host sets (or the algorithm suggests) times the number of nights booked.
2. Cleaning fee — a flat amount charged once per stay. In our dataset, cleaning fees range from ~$95/stay (NYC) to ~$165/stay (Nashville). Spread across a 3-5 night average length of stay, cleaning becomes a material share of every dollar.
4. Occupancy / lodging tax — collected by Airbnb in most US markets and remitted to the local jurisdiction. Rates range from 10.75% in Denver to 15.6% in Seattle across our sample.
5. Host service fee (3%) — deducted from the host's payout before it hits the host's bank account.
After Airbnb processes the payment, the host's payout is (nightly revenue + cleaning fee) × (1 – 3%). The host then pays operating costs: the cleaner (a pass-through), utilities (~8%), maintenance and supplies (~5%), and insurance (~2%). What remains is host take-home cash — the number that matters for cash-on-cash return.
Combined, the platform take on a standard split-fee booking is ~17.2% of the booking subtotal. Occupancy taxes add another 10-16%. Before a host has paid a single dollar of operating expense, between 27% and 33% of gross guest outlay has already been claimed by Airbnb and the local tax authority.
Where Every $100 of Guest Spending Goes
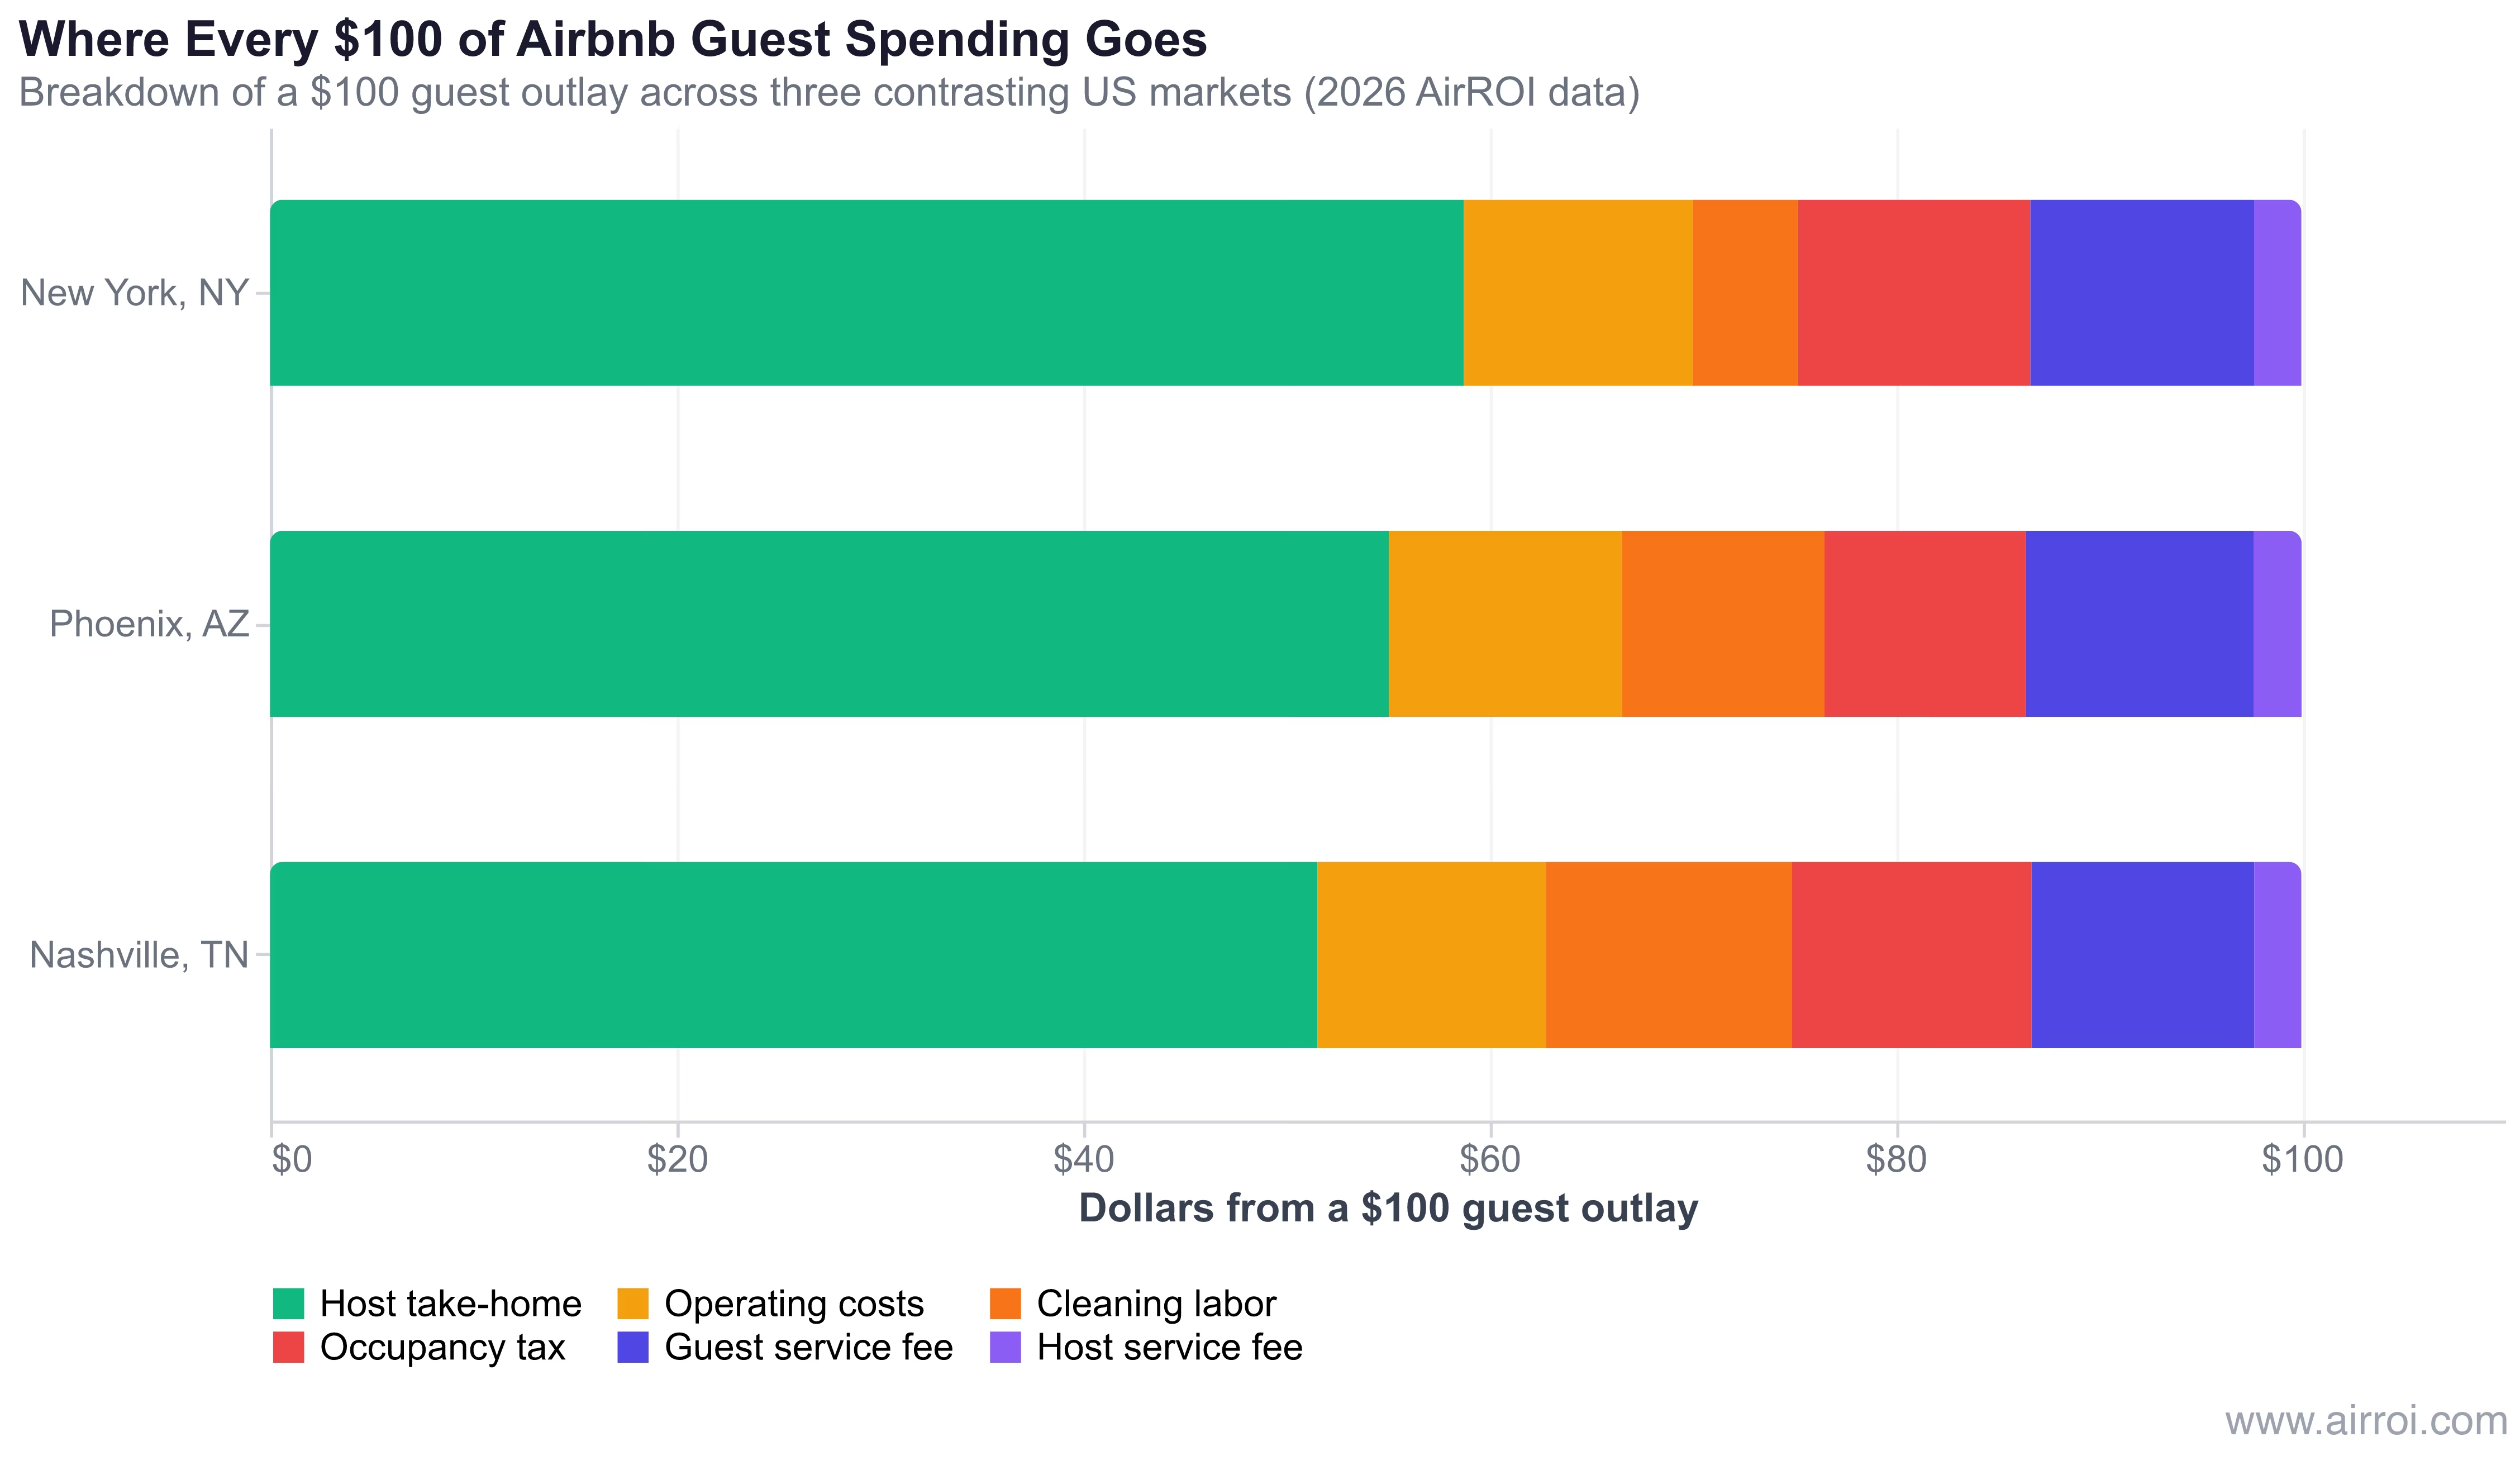
The most revealing way to visualize the capture rate is to normalize every market to a $100 guest outlay. Consider three contrasting markets:
- New York, NY — The longest average length of stay (10.7 nights) in our sample means a single $95 cleaning fee is spread across many nights, shrinking cleaning's share of the $100 to just $5.17. The host nets $58.77 per $100 — the highest capture rate, though it applies only to the small population of legally compliant NYC listings.
- Phoenix, AZ — A balanced mid-market profile: 12.57% occupancy tax, $150 cleaning fee, 5.7-night stays. Host nets $55.08 per $100, the highest non-NYC capture rate in the set.
- Nashville, TN — Highest ADR in the sample but shortest stays (3.8 nights) combined with a 15.25% combined lodging and sales tax burden and $165 cleaning fees. Cleaning alone consumes $12.12 of every $100 guest outlay. Net host capture drops to $51.57 — the lowest in the dataset.
Two insights fall out immediately:
- Longer average stays dramatically improve host capture rate by diluting the impact of per-stay cleaning fees.
- High ADR does not automatically translate into high capture. Nashville has the highest per-listing revenue in the dataset but the lowest capture rate, because its fee structure (high tax, short stays, expensive cleaning) extracts more per dollar of guest outlay.
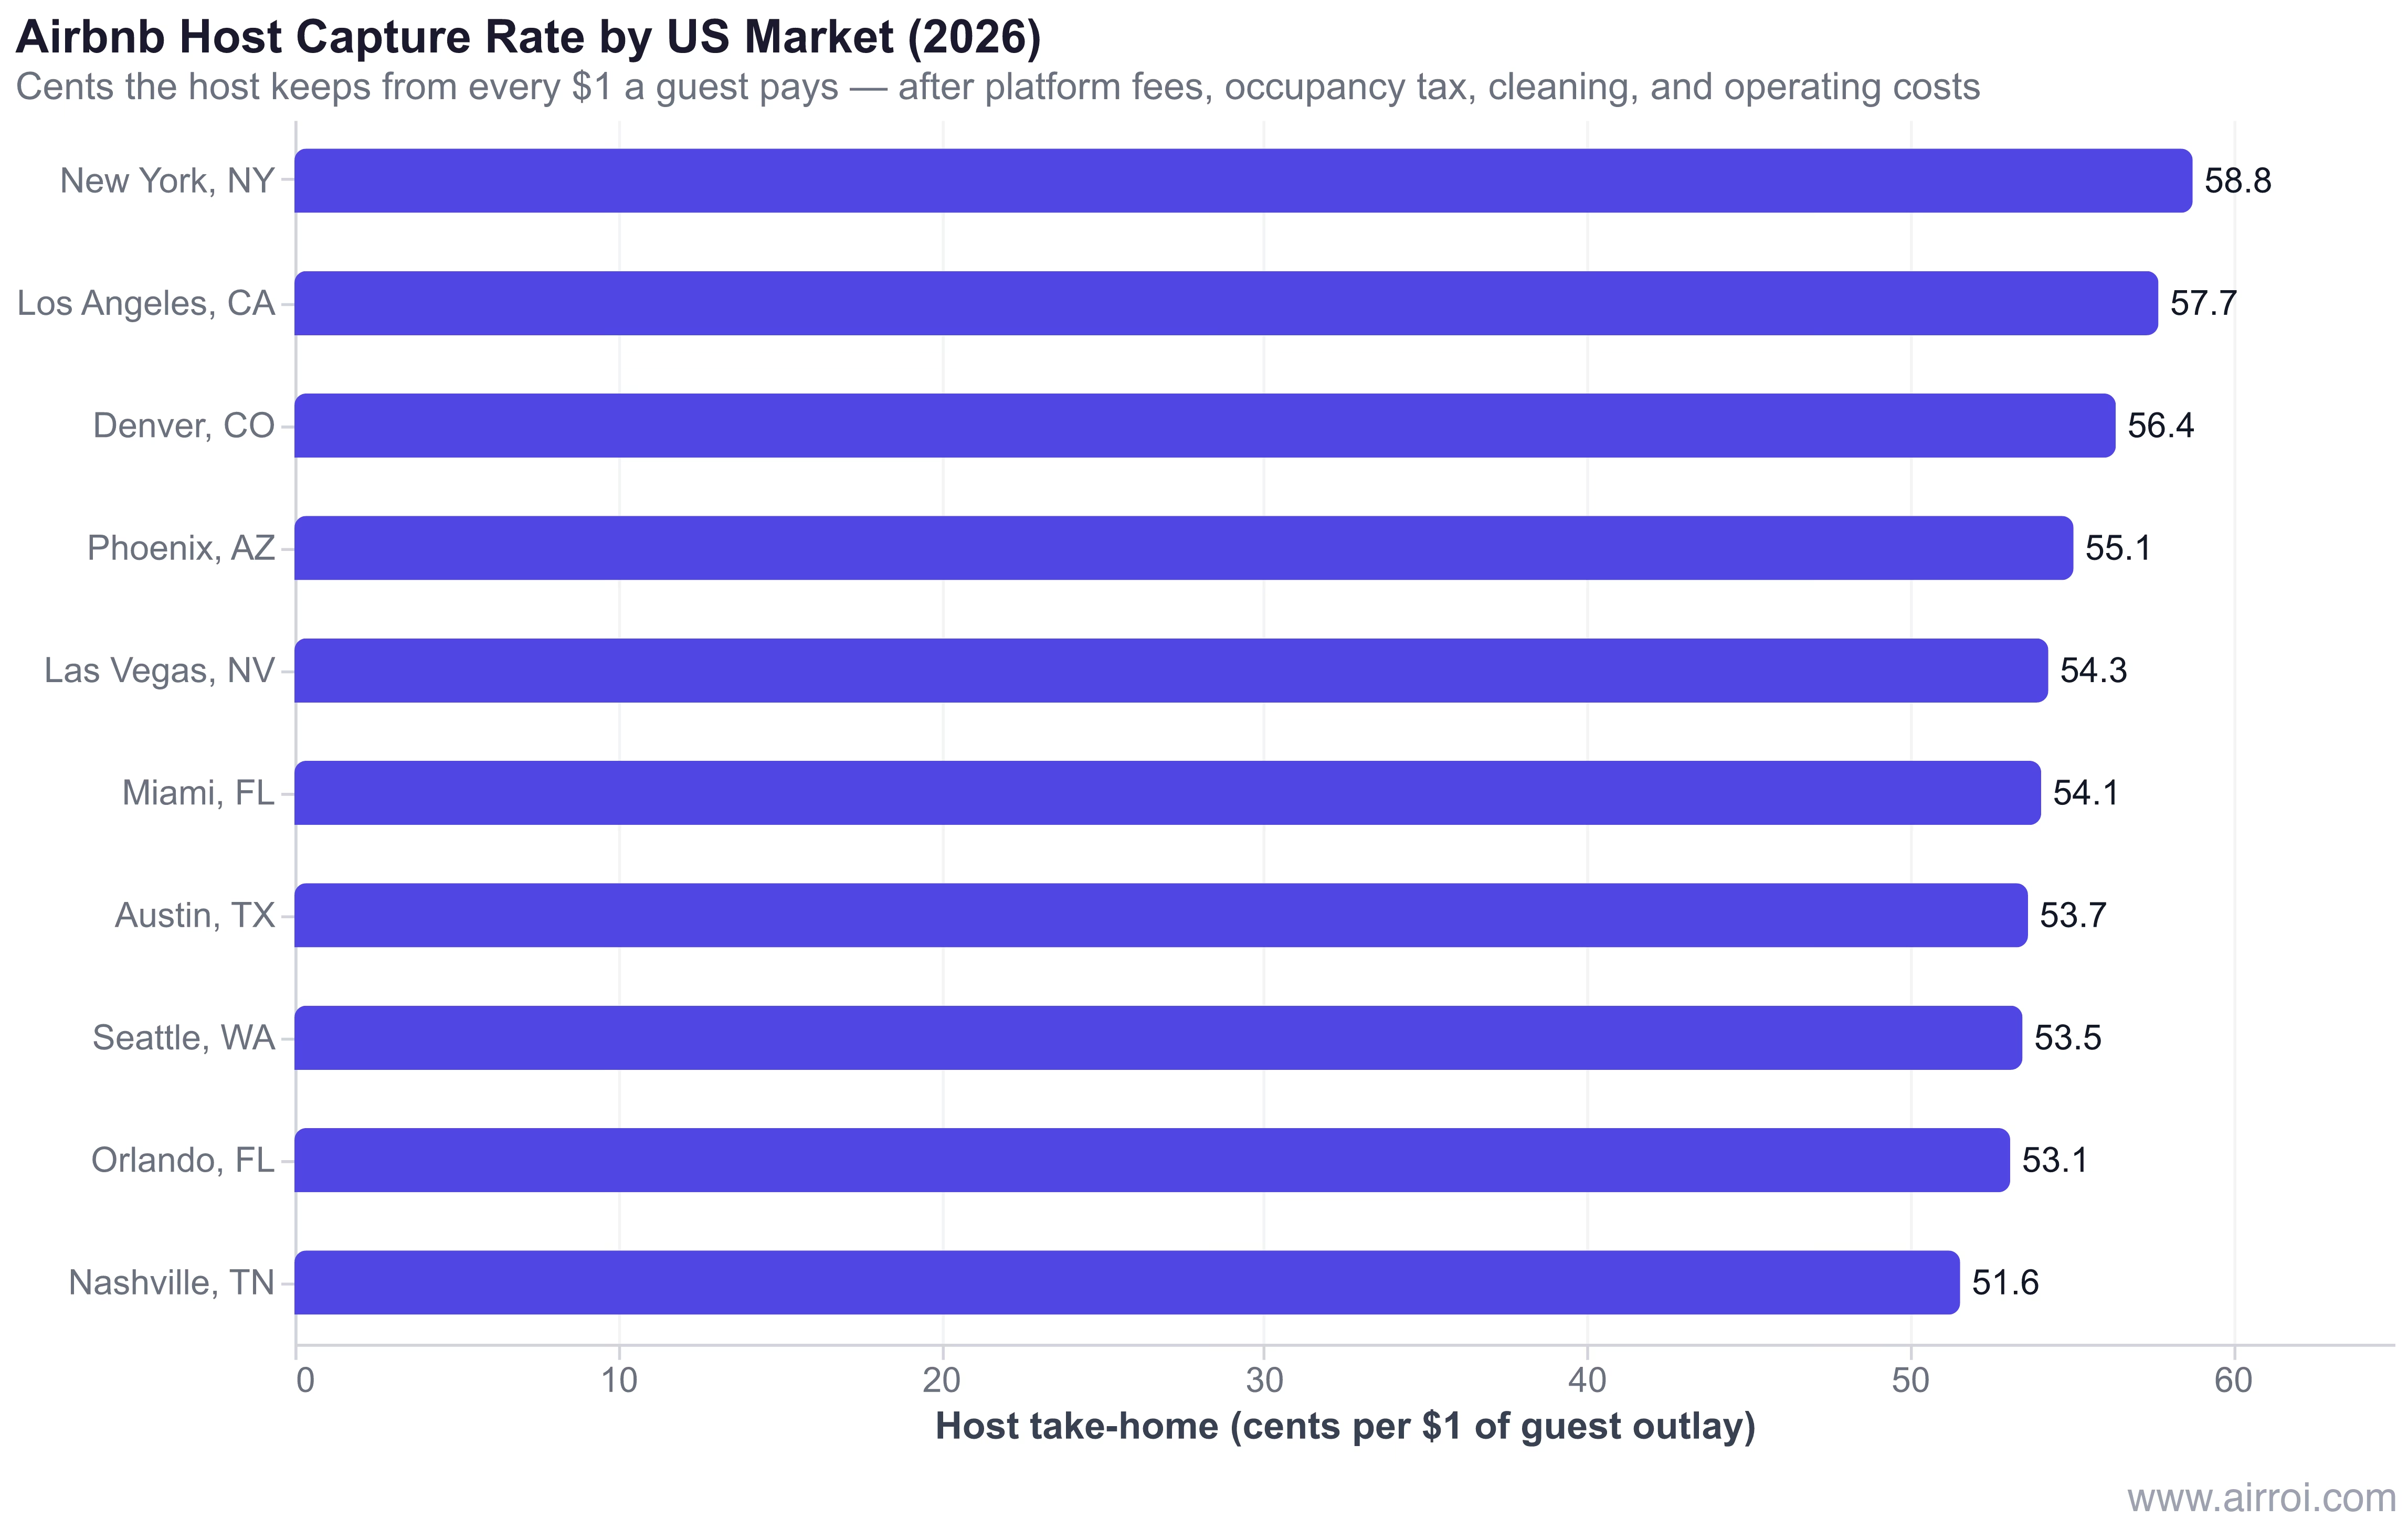
The 10-Market Host Capture Ranking
| Rank | Market | Capture Rate | Guest Fee | Occ Tax | Host Fee | Cleaning Labor | Ops Cost | Host Net |
|---|---|---|---|---|---|---|---|---|
| 1 | New York, NY | 58.8% | $11.01 | $11.44 | $2.33 | $5.17 | $11.28 | $58.77 |
| 2 | Los Angeles, CA | 57.7% | $11.08 | $10.92 | $2.34 | $6.61 | $11.35 | $57.71 |
| 3 | Denver, CO | 56.4% | $11.36 | $8.60 | $2.40 | $9.60 | $11.64 | $56.39 |
| 4 | Phoenix, AZ | 55.1% | $11.20 | $9.92 | $2.37 | $9.96 | $11.48 | $55.08 |
| 5 | Las Vegas, NV | 54.3% | $11.13 | $10.49 | $2.35 | $10.33 | $11.40 | $54.30 |
| 6 | Miami, FL | 54.1% | $11.16 | $10.22 | $2.36 | $10.74 | $11.44 | $54.08 |
| 7 | Austin, TX | 53.7% | $10.99 | $11.61 | $2.32 | $10.15 | $11.26 | $53.67 |
| 8 | Seattle, WA | 53.5% | $10.94 | $12.02 | $2.31 | $10.02 | $11.21 | $53.50 |
| 9 | Orlando, FL | 53.1% | $11.21 | $9.87 | $2.37 | $11.96 | $11.48 | $53.12 |
| 10 | Nashville, TN | 51.6% | $10.97 | $11.78 | $2.32 | $12.12 | $11.24 | $51.57 |
All dollar amounts are normalized to a $100 guest outlay. Capture rate is the share the host retains after platform fees, occupancy tax, cleaning labor, and a 15%-of-payout operating cost stack (utilities 8%, maintenance and supplies 5%, insurance 2%). Property management fees are excluded from this baseline; hosts using full-service management subtract another ~20% of gross revenue.
The 7.2-percentage-point spread between New York and Nashville translates into roughly $14 of additional host take-home per $1,000 of guest spending. But capture rate alone does not determine investment attractiveness. Nashville's lower capture is offset by its much higher gross revenue per listing ($38,331 vs. NYC's $22,677), so the Nashville host still takes home more total dollars. What capture rate really measures is the efficiency of revenue conversion into cash — and for two listings with similar gross revenue, the one in a higher-capture market wins.
Where Hosts Capture the Most: Low-Tax, Long-Stay Markets
The four highest-capture markets — New York, Los Angeles, Denver, and Phoenix — share two traits: longer average lengths of stay (5.7 to 10.7 nights) and moderate occupancy tax regimes relative to the sample.
Denver is the cleanest example. Its 10.75% city lodger's tax is the lowest in our sample, its 6.7-night average length of stay dilutes cleaning costs, and its $222 ADR keeps the fixed cleaning charge as a manageable share of each stay. Hosts keep 56.4 cents of every guest dollar — a rate achievable even without special host-side optimization.
Los Angeles is an interesting outlier. Its high ADR ($317) drives cleaning fees to a smaller share of the total, but operating costs, labor, and regulation are expensive enough that the capture rate advantage can erode for hosts paying union-rate wages or full-service management. The 57.7% capture rate holds only for self-managed operators.
What these markets have in common operationally: they reward longer stays, they avoid double-stacking sales tax on top of lodging tax, and their mid-to-high ADRs mean percentage fees dominate dollar economics rather than the fixed cleaning fee.
Where Hosts Capture the Least: Short-Stay, High-Tax Markets
The bottom four — Nashville, Orlando, Seattle, and Austin — share three obstacles: short average stays that magnify per-stay fixed costs, combined lodging + sales tax regimes north of 12%, and premium cleaning-labor markets that push pass-through costs higher.
Nashville's case is instructive because its gross revenue is the highest in the sample. A Nashville cabin clearing $38,331/year translates to ~$19,766 of take-home cash on guest outlay of ~$58,852 — strong in absolute dollars, but the fees and taxes extracted along the way are substantial. Davidson County's 6% hotel occupancy privilege tax stacks on top of the 9.25% combined state and local sales tax (15.25% total), and the 3.8-night average length of stay means every booking pays a fresh $165 cleaning fee.
Seattle's 15.6% combined lodging and sales tax is the steepest in our sample, and King County's cleaning-labor market ($35-45/hr plus supplies) amplifies the drag. Orlando's low capture rate (53.1%) is driven almost entirely by its short stay length (4.8 nights) combined with a $140 cleaning fee — the math is punishing when guests only stay four or five nights. Austin's 15% Hotel Occupancy Tax lands it at 53.7%, essentially tied with Seattle despite very different demand profiles.
The structural takeaway: markets with combined tax burdens above 13% and average stays under 6 nights cannot deliver top-quartile capture rates, no matter how strong their ADR.
Why the $93 Billion Claim Matters for Policy
The capture-rate analysis produces a nuanced answer. A $100 guest booking in a mid-capture market like Phoenix distributes roughly:
- $55 to the host — the vast majority of which is spent in-market on cleaning labor, supplies, maintenance, property taxes, mortgage interest, and services.
- $13 to Airbnb ($11 guest fee + $2 host fee) — this leaves the local economy entirely, flowing to Airbnb's San Francisco corporate treasury.
- $10-12 to the city/state in occupancy and sales tax — fully local by definition, funding municipal services, tourism marketing, and general revenue.
- $11-12 in operating costs — mostly local spending on local service providers.
The meaningful number for a city council is the local-capture portion: host take-home + occupancy tax + local operating spending, which typically totals ~$77-82 of every $100 in guest outlay. The extracted-platform-rent portion is ~$13. The $73-78 in indirect visitor spending layered on top is the biggest local number by far — and also the most contested, since a portion of it would flow to hotels and motels if STRs did not exist.
A policy framework that targets the extractive piece (platform rent) rather than the productive piece (host income + taxes + local spending) is economically coherent. Many current ordinances do the opposite — they restrict host supply while letting Airbnb's platform take rate pass through unchanged, which reduces both direct host income and total visitor volume simultaneously.
What Hosts Should Do With This
For individual hosts and prospective investors, the capture-rate analysis reframes how to evaluate markets:
1. Don't chase the highest gross revenue ranking. Nashville has the highest gross revenue in our sample and the lowest capture rate. A cabin there clearing $38K in gross will take home less per dollar than a Phoenix home clearing $32K, once differences in property tax, insurance, and utilities are normalized.
2. Optimize for capture rate × revenue, not revenue alone. The real figure of merit is host net take-home dollars per listing. Phoenix, Miami, and Denver consistently deliver strong net-dollar outcomes precisely because their capture rates are healthy even when their ADRs are mid-range.
3. Length of stay matters more than most hosts realize. Moving the average stay from 3.8 nights to 5.5 nights can add 2-3 percentage points to capture rate by spreading the fixed cleaning fee across more revenue. Market weekly discounts, work-friendly setups, and minimum-stay policies that favor longer bookings.
5. Budget honestly for operating costs. The 15% operating-cost stack used here is a conservative baseline. In high-cost markets (Seattle, LA, NYC), actual utilities + maintenance + insurance can run 18-22% of payout. Modeling a property based on 10% operating costs — a common mistake — overstates take-home by 30-40%.
Limitations and Methodology Notes
This analysis uses AirROI trailing-twelve-month market-summary data as of April 2026, with these assumptions:
- Platform fees follow Airbnb's published split-fee schedule: 14.2% guest service fee, 3% host service fee, applied to the booking subtotal.
- Occupancy tax rates are taken from current municipal and state tax ordinances as of Q1 2026.
- Cleaning fees are market-level estimates based on AirROI cleaning-fee data and industry benchmarks; actual fees vary by listing size and pet policy.
- Operating cost stack (15% of payout) reflects a self-managed baseline: 8% utilities, 5% maintenance/supplies, 2% insurance. Full-service management (~20% of gross) is excluded.
- Capture rate excludes federal and state income tax, depreciation, mortgage interest, and owner-occupied exclusions — it's the cash that reaches the host, not taxable net income.
- The $15-22B nationwide direct-host gross estimate is derived from the 10-market sample adjusted downward for the long tail of low-revenue rural and spare-room listings.
The Bottom Line
Airbnb's $93 billion US economic impact headline is directionally accurate and a legitimate number for policy advocacy — short-term rentals do drive substantial local spending. But at least three-quarters of the $93B is visitor spending recycled into the broader local economy, not host income.
Across 10 major US markets, direct host gross revenue totals $1.87B, and hosts retain between 51.6 and 58.8 cents per dollar of gross guest outlay after platform fees, occupancy taxes, cleaning, and basic operating costs. The variation across markets is driven more by length of stay, tax stack, and cleaning economics than by headline ADR or occupancy. Phoenix, Denver, Miami, and Las Vegas deliver the most efficient conversion from gross revenue to host cash in the non-NYC sample; Nashville, Orlando, Seattle, and Austin have structural capture-rate headwinds that high ADR alone cannot overcome.
The real question for investors isn't "how big is Airbnb's US economy?" — it's "how much of each guest dollar reaches my bank account, and in which markets?" The answer, quantified: about 55 cents per dollar, and it varies by seven percentage points depending on where you buy.