
How Much Do Airbnb Hosts Make? 2026 Data Across 15 Markets Reveals the Real Numbers
A 25th percentile Airbnb host in Portland, Oregon earns roughly $20,000 per year. A 90th percentile host in Charleston, South Carolina clears over $185,000. Same platform, same year — and neither number is the "average Airbnb income" you will find on Google. The question "how much do Airbnb hosts make" has no single answer because the variance is the story: a 9x spread between the bottom and top quartiles, driven almost entirely by five controllable factors.
AirROI analyzed current trailing twelve-month data across 15 diverse markets — from resort towns like Park City and Nags Head to urban centers like Chicago and San Diego, plus international cities including London and Lisbon — to build the most granular, up-to-date Airbnb host earnings breakdown available. What follows is the definitive 2026 answer: market-by-market, bedroom-by-bedroom, amenity-by-amenity.
The "Average Airbnb Income" Is a Fiction
Every number on the first page of Google for "how much do Airbnb hosts make" is either stale, misleadingly framed, or fatally averaged.
Airbnb's own figure: $14,000 per year. This number dates to 2022 and includes every spare-room renter who listed for three months, every host in a low-demand rural market, and every inactive listing that technically remained "available." It tells a prospective investor nothing about what a committed host earns in 2026.
ZipRecruiter's figure: $37,956 per year. ZipRecruiter treats Airbnb hosting as a W-2 salary job — complete with hourly wage calculations and state-by-state salary comparisons. Hosting is not a salaried position. It is a real estate business with revenue driven by asset quality, market selection, and operational execution.
AirDNA's figure: $44,235 per year. As Uplisting noted in their 2025 analysis, this higher number "likely reflects income from full-time, professional hosts, rather than part-time users." It is a useful data point but still a single average that obscures a massive distribution.
The real story is percentile-level data. According to AirROI's analysis across 15 markets, the 25th percentile annual revenue ranges from roughly $20,000 in weaker urban markets to $37,000 in top resort markets. The 90th percentile ranges from $68,000 to over $185,000. As STR operator Sean Rakidzich, who manages 155 properties, observed: "When you see headlines about hosts making $50,000 per year, that usually describes the top 10% of hosts in the best markets."
The five factors that explain where a host lands on this spectrum: market selection, bedroom count, property type, amenity tier, and management style. We will quantify each one.
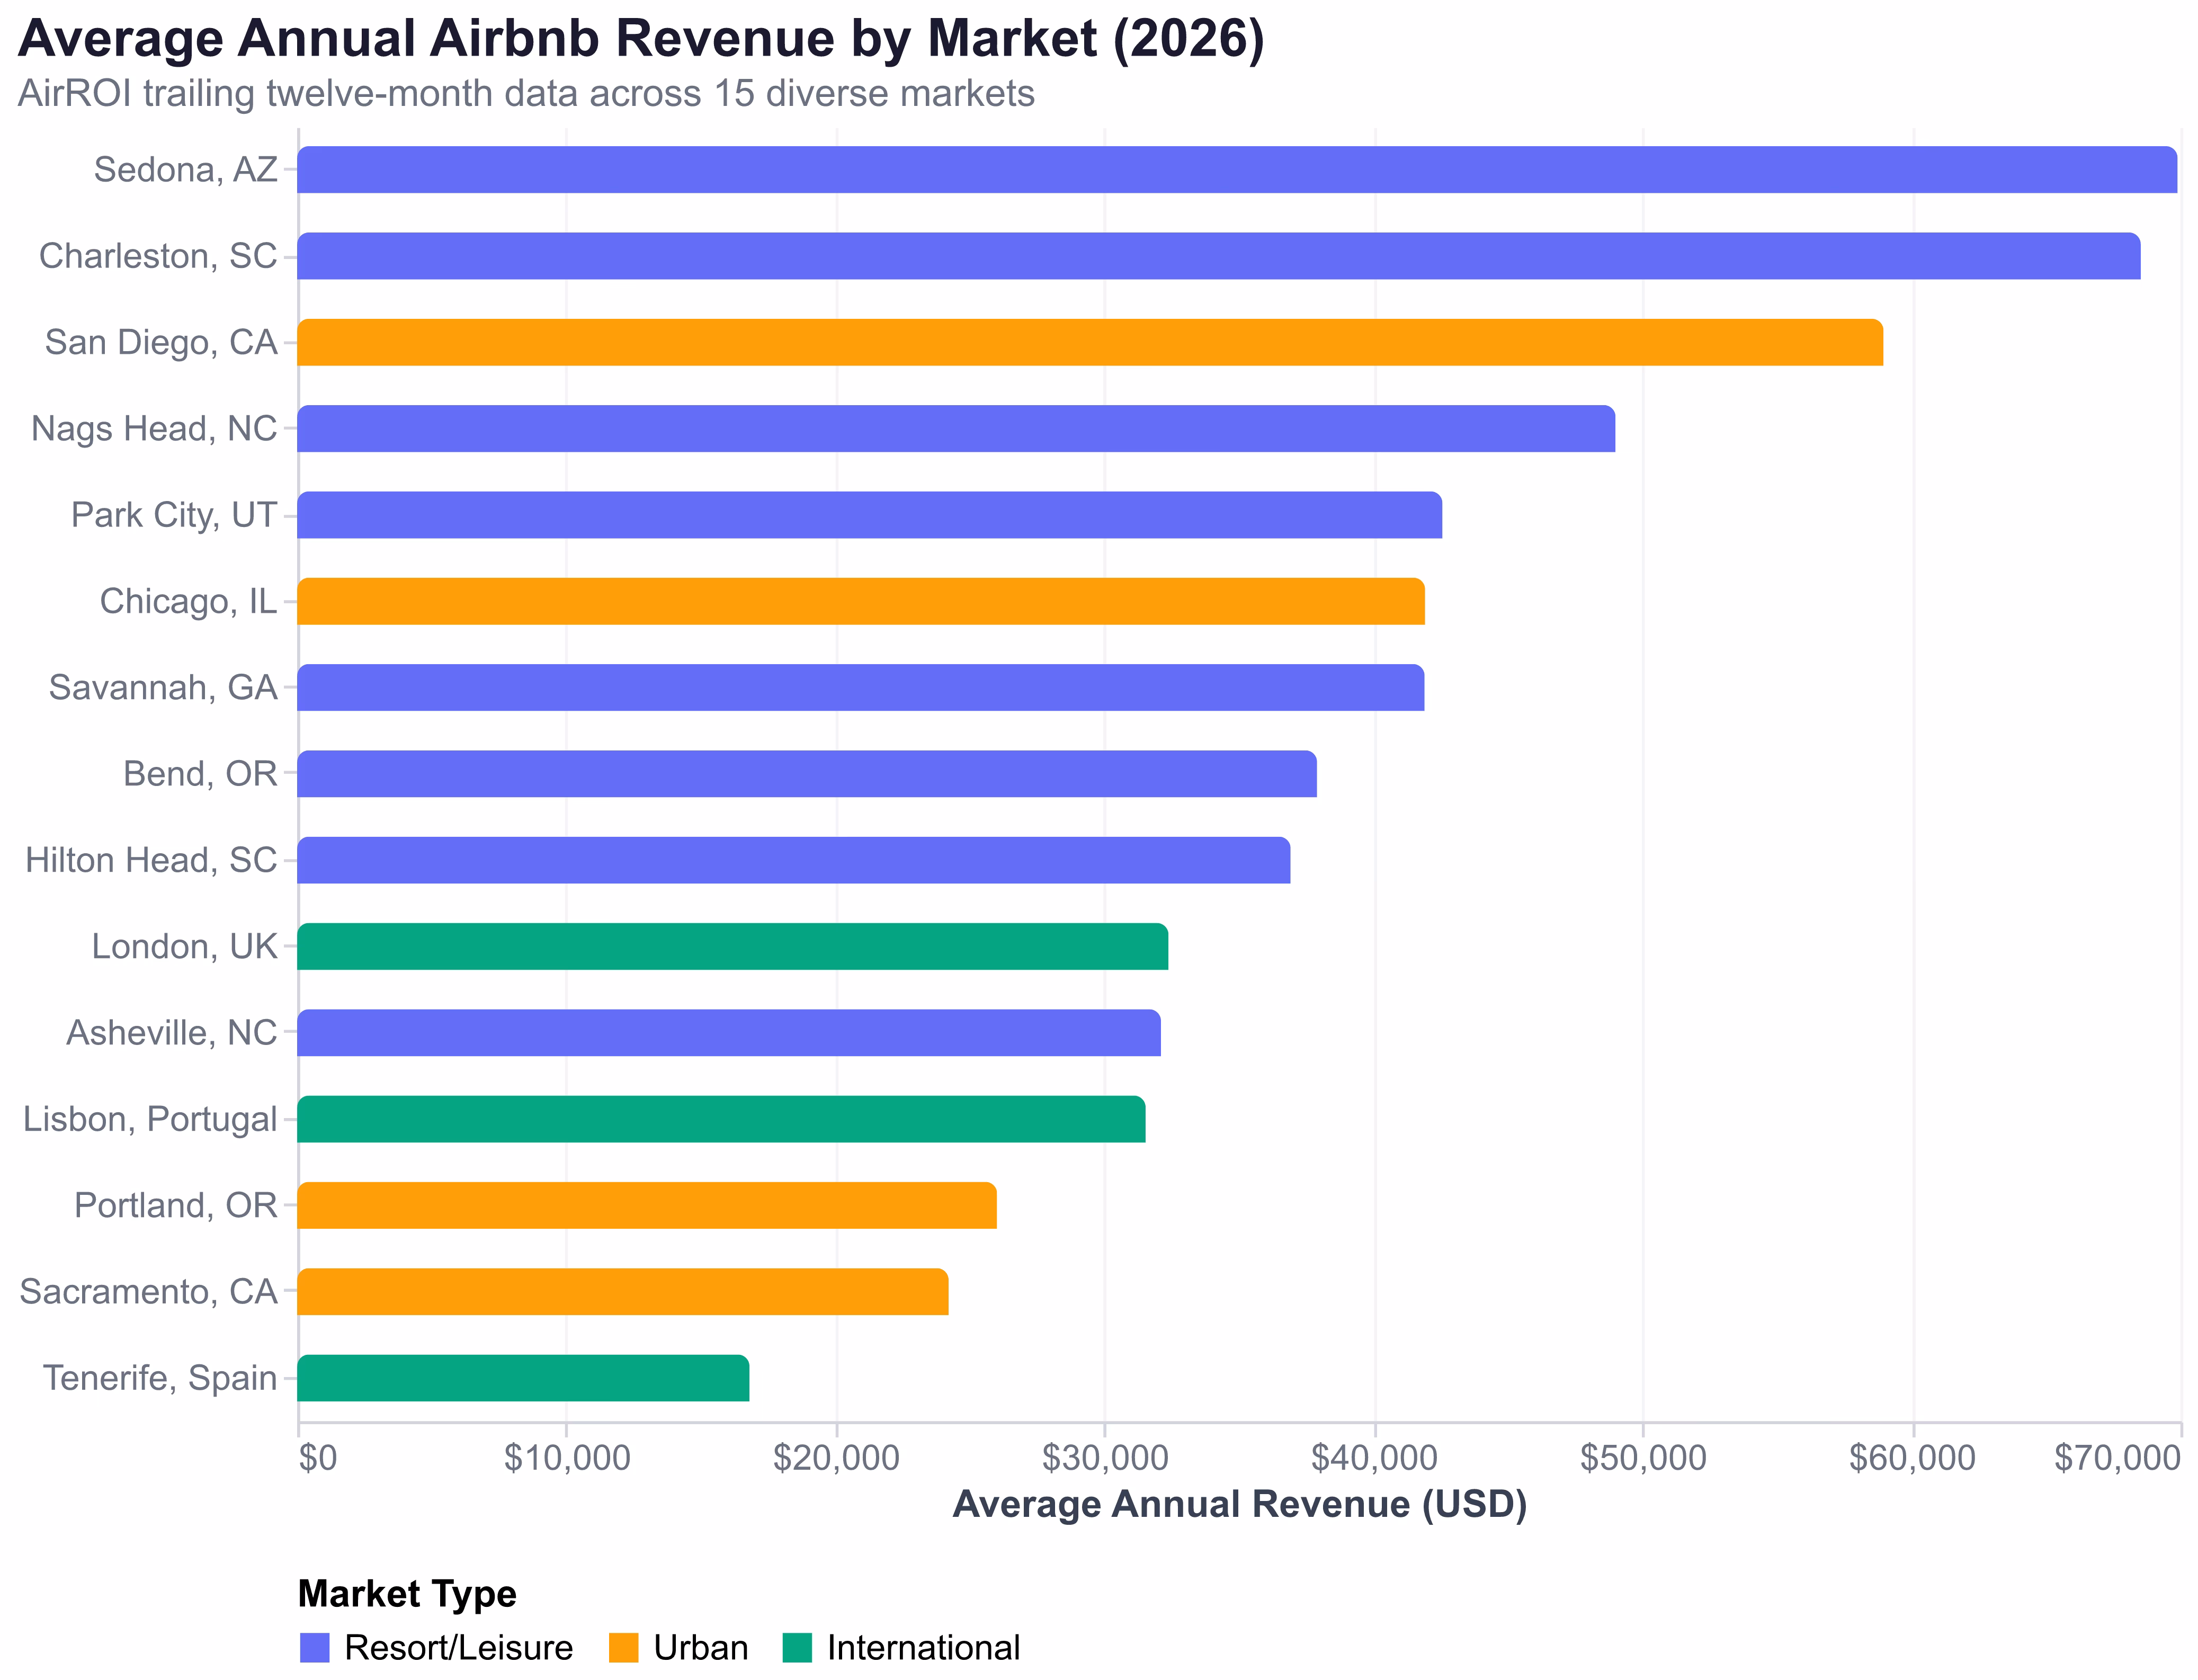
Airbnb Revenue Across 15 Markets: Where Hosts Earn the Most
Market selection is the single largest determinant of Airbnb host earnings. AirROI's trailing twelve-month data reveals a 4.2x spread in average annual revenue between the highest-earning and lowest-earning markets in our analysis.
| Market | Type | Listings | Avg Revenue | ADR | Occupancy |
|---|---|---|---|---|---|
| Sedona, AZ | Resort | 1,581 | $69,897 | $454 | 52% |
| Charleston, SC | Historic | 1,695 | $68,528 | $453 | 56% |
| San Diego, CA | Coastal | 8,528 | $58,967 | $424 | 54% |
| Nags Head, NC | Beach | 828 | $49,006 | $457 | 43% |
| Park City, UT | Ski | 3,936 | $42,570 | $681 | 32% |
| Chicago, IL | Urban | 4,722 | $41,927 | $318 | 52% |
| Savannah, GA | Historic | 2,197 | $41,909 | $324 | 48% |
| Bend, OR | Outdoor | 1,749 | $37,911 | $314 | 49% |
| Hilton Head, SC | Beach | 4,506 | $36,928 | $416 | 41% |
| London, UK | Intl Major | 27,613 | $32,389 | $321 | 49% |
| Asheville, NC | Mountain | 1,706 | $32,109 | $272 | 45% |
| Lisbon, Portugal | Intl Urban | 10,571 | $31,538 | $192 | 58% |
| Portland, OR | Urban | 2,951 | $26,017 | $185 | 57% |
| Sacramento, CA | Suburban | 932 | $24,214 | $205 | 49% |
| Tenerife, Spain | Intl Resort | 807 | $16,812 | $133 | 50% |
Source: AirROI trailing twelve-month data, April 2026 (entire-home listings)
Resort and Leisure Markets: $37K-$70K
Resort markets dominate the revenue rankings because they combine above-average nightly rates with travelers willing to book entire homes for multi-night stays. Sedona leads at $69,897 per year with a $454 average daily rate (ADR) — guests are paying premium prices for red-rock views and desert luxury. Charleston follows at $68,528, delivering the strongest occupancy (56%) among resort markets thanks to year-round appeal as a culinary and historic destination.
Park City presents an interesting case: its $681 ADR is the highest in our dataset by far, but 32% occupancy — driven by extreme ski-season concentration — holds annual revenue to $42,570. The lesson: a high nightly rate does not guarantee high annual income if demand is compressed into 3-4 months.
Urban Markets: $24K-$59K
San Diego is the clear urban leader at $58,967, benefiting from coastal tourism demand that pushes it closer to resort-market performance. Chicago ($41,927) and Portland ($26,017) illustrate the urban reality: moderate ADRs of $185-$320 combined with 52-57% occupancy produce reliable but less peaked annual revenue than resort markets. Urban markets reward volume and consistency over peak-rate pricing.
International Markets: $17K-$32K
London ($32,389) outperforms Lisbon ($31,538) on revenue despite Lisbon's higher occupancy (58% vs 49%) — the deepest booking density in our entire dataset. London's 27,613 active entire-home listings create supply-side pressure that holds per-listing occupancy below its US peers, but higher nightly rates ($321 ADR) close the gap. Tenerife's $16,812 reflects lower European nightly rates, though local operating costs are proportionally lower, potentially yielding competitive ROI percentages.
The Bedroom Revenue Ladder: Each Room Adds $18K-$57K
After market selection, bedroom count is the most powerful revenue lever. AirROI data shows each additional bedroom adds $18,000 to $57,000 in annual revenue — but the relationship is not linear, and the sweet spot matters.
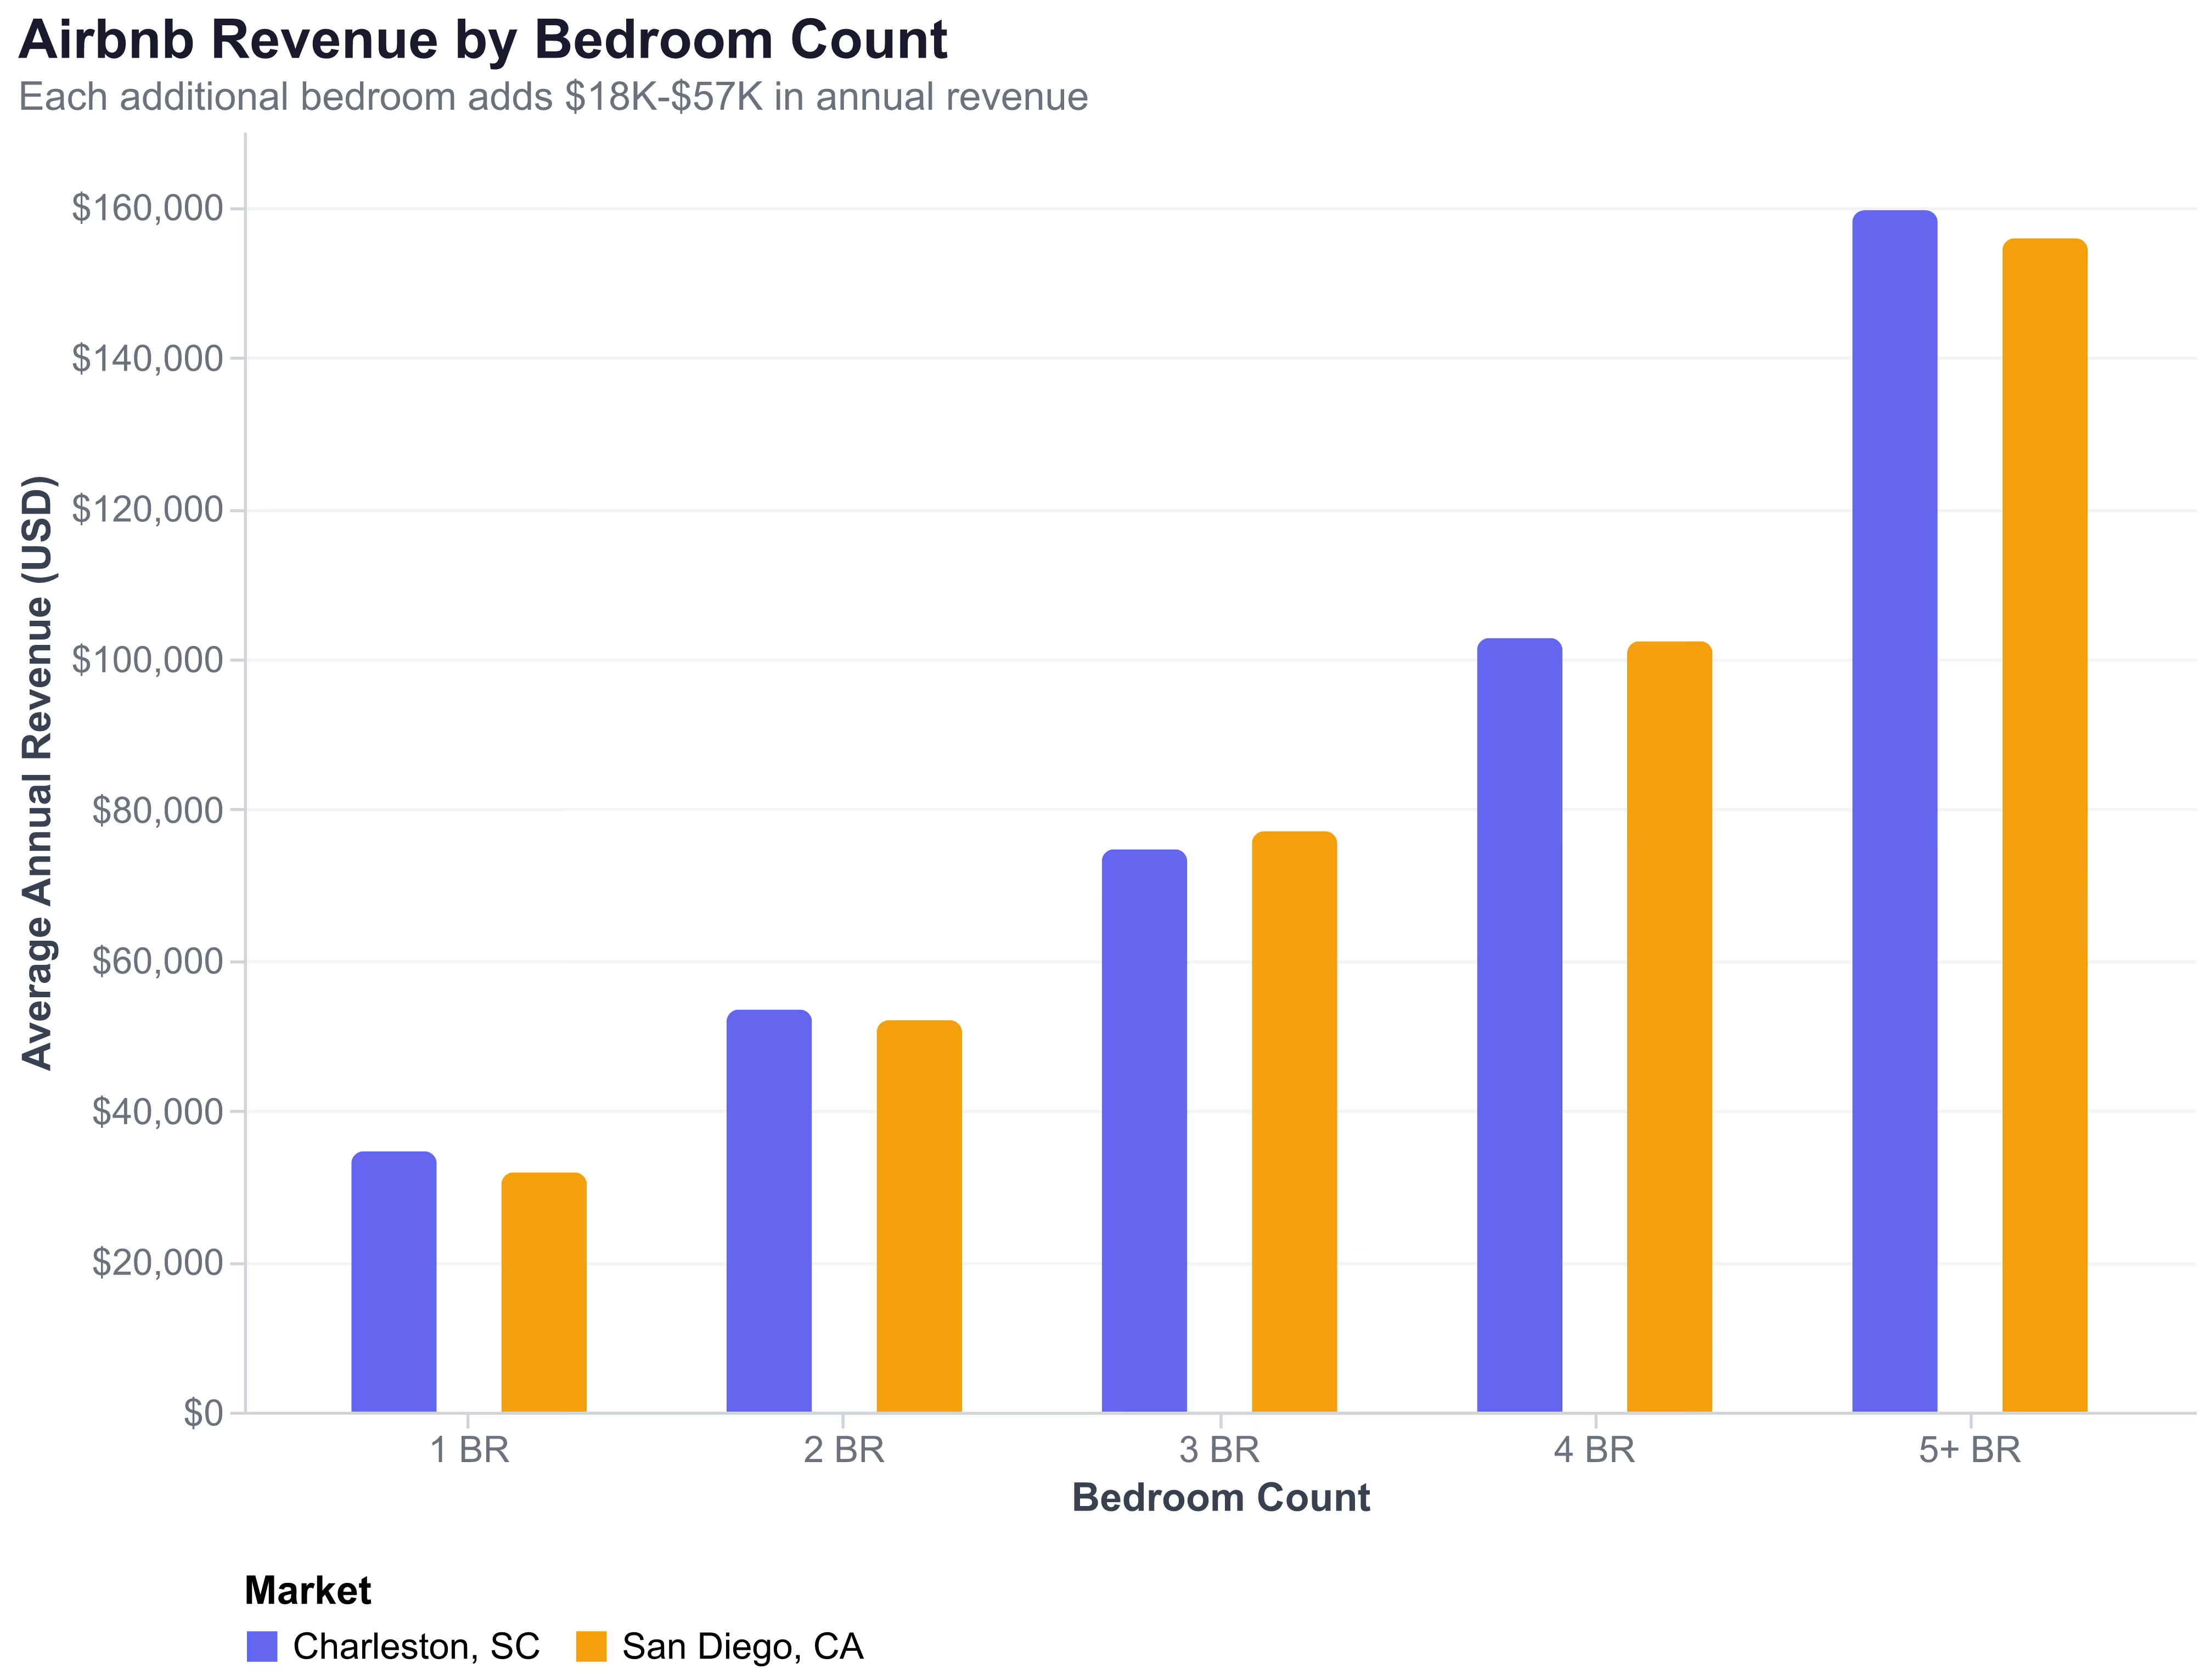
Charleston, SC: Bedroom Revenue Breakdown
| Bedrooms | Annual Revenue | ADR | Occupancy | Added per BR |
|---|---|---|---|---|
| 1 BR | $34,566 | $231 | 56% | — |
| 2 BR | $53,389 | $334 | 58% | +$18,823 |
| 3 BR | $74,663 | $457 | 56% | +$21,274 |
| 4 BR | $102,706 | $683 | 52% | +$28,043 |
| 5+ BR | $159,492 | $1,141 | 51% | +$56,786 |
San Diego, CA: Bedroom Revenue Breakdown
| Bedrooms | Annual Revenue | ADR | Occupancy | Added per BR |
|---|---|---|---|---|
| 1 BR | $31,772 | $215 | 56% | — |
| 2 BR | $51,966 | $355 | 56% | +$20,194 |
| 3 BR | $77,046 | $539 | 54% | +$25,080 |
| 4 BR | $102,279 | $757 | 51% | +$25,233 |
| 5+ BR | $155,767 | $1,218 | 48% | +$53,488 |
The pattern is consistent across both markets: revenue scales aggressively with bedroom count — a 5BR+ property earns 4.6x a 1BR in Charleston and 4.9x in San Diego. But notice the occupancy trend: 1-2BR listings maintain 56-58% occupancy, while 5BR+ drops to 48-51%. Larger properties command extraordinary nightly rates but sit empty more often.
The 2-3BR sweet spot delivers the optimal balance. A 3BR in either market more than doubles the revenue of a 1BR while maintaining occupancy above 54%. For investors calculating ROI, the acquisition cost of a 3BR is typically 40-60% more than a 1BR, but revenue increases by 115-142%. This is why bedroom count is the first variable experienced STR investors optimize.
Property Type Matters: Entire Homes Earn 4.4x Private Rooms
The gap between entire home and private room listings dwarfs every other variable except market selection. In San Diego, the numbers are stark:
| Property Type | Annual Revenue | ADR | Occupancy |
|---|---|---|---|
| Entire Home | $58,967 | $424 | 54% |
| Private Room | $13,476 | $147 | 46% |
Entire homes generate 4.4x the annual revenue of private rooms. The ADR premium (2.9x) combines with higher occupancy (54% vs 46%) to create a compounding effect. Private rooms serve a specific niche — budget-conscious travelers and urban hosts monetizing a spare bedroom — but they are fundamentally supplemental income, typically generating $10,000-$15,000 annually in mid-tier markets.
This data reinforces why industry observers note that "across most markets, bedroom count explains demand the best." The property type and bedroom count decisions are made at the point of purchase or listing setup — they set the revenue ceiling before a single guest arrives.
The Management Premium: Self-Hosted vs. Professionally Managed
Professionally managed Airbnb listings generate substantially higher gross revenue than self-hosted properties — but the gap varies enormously by market, and the net income story is more nuanced than the headline numbers suggest.
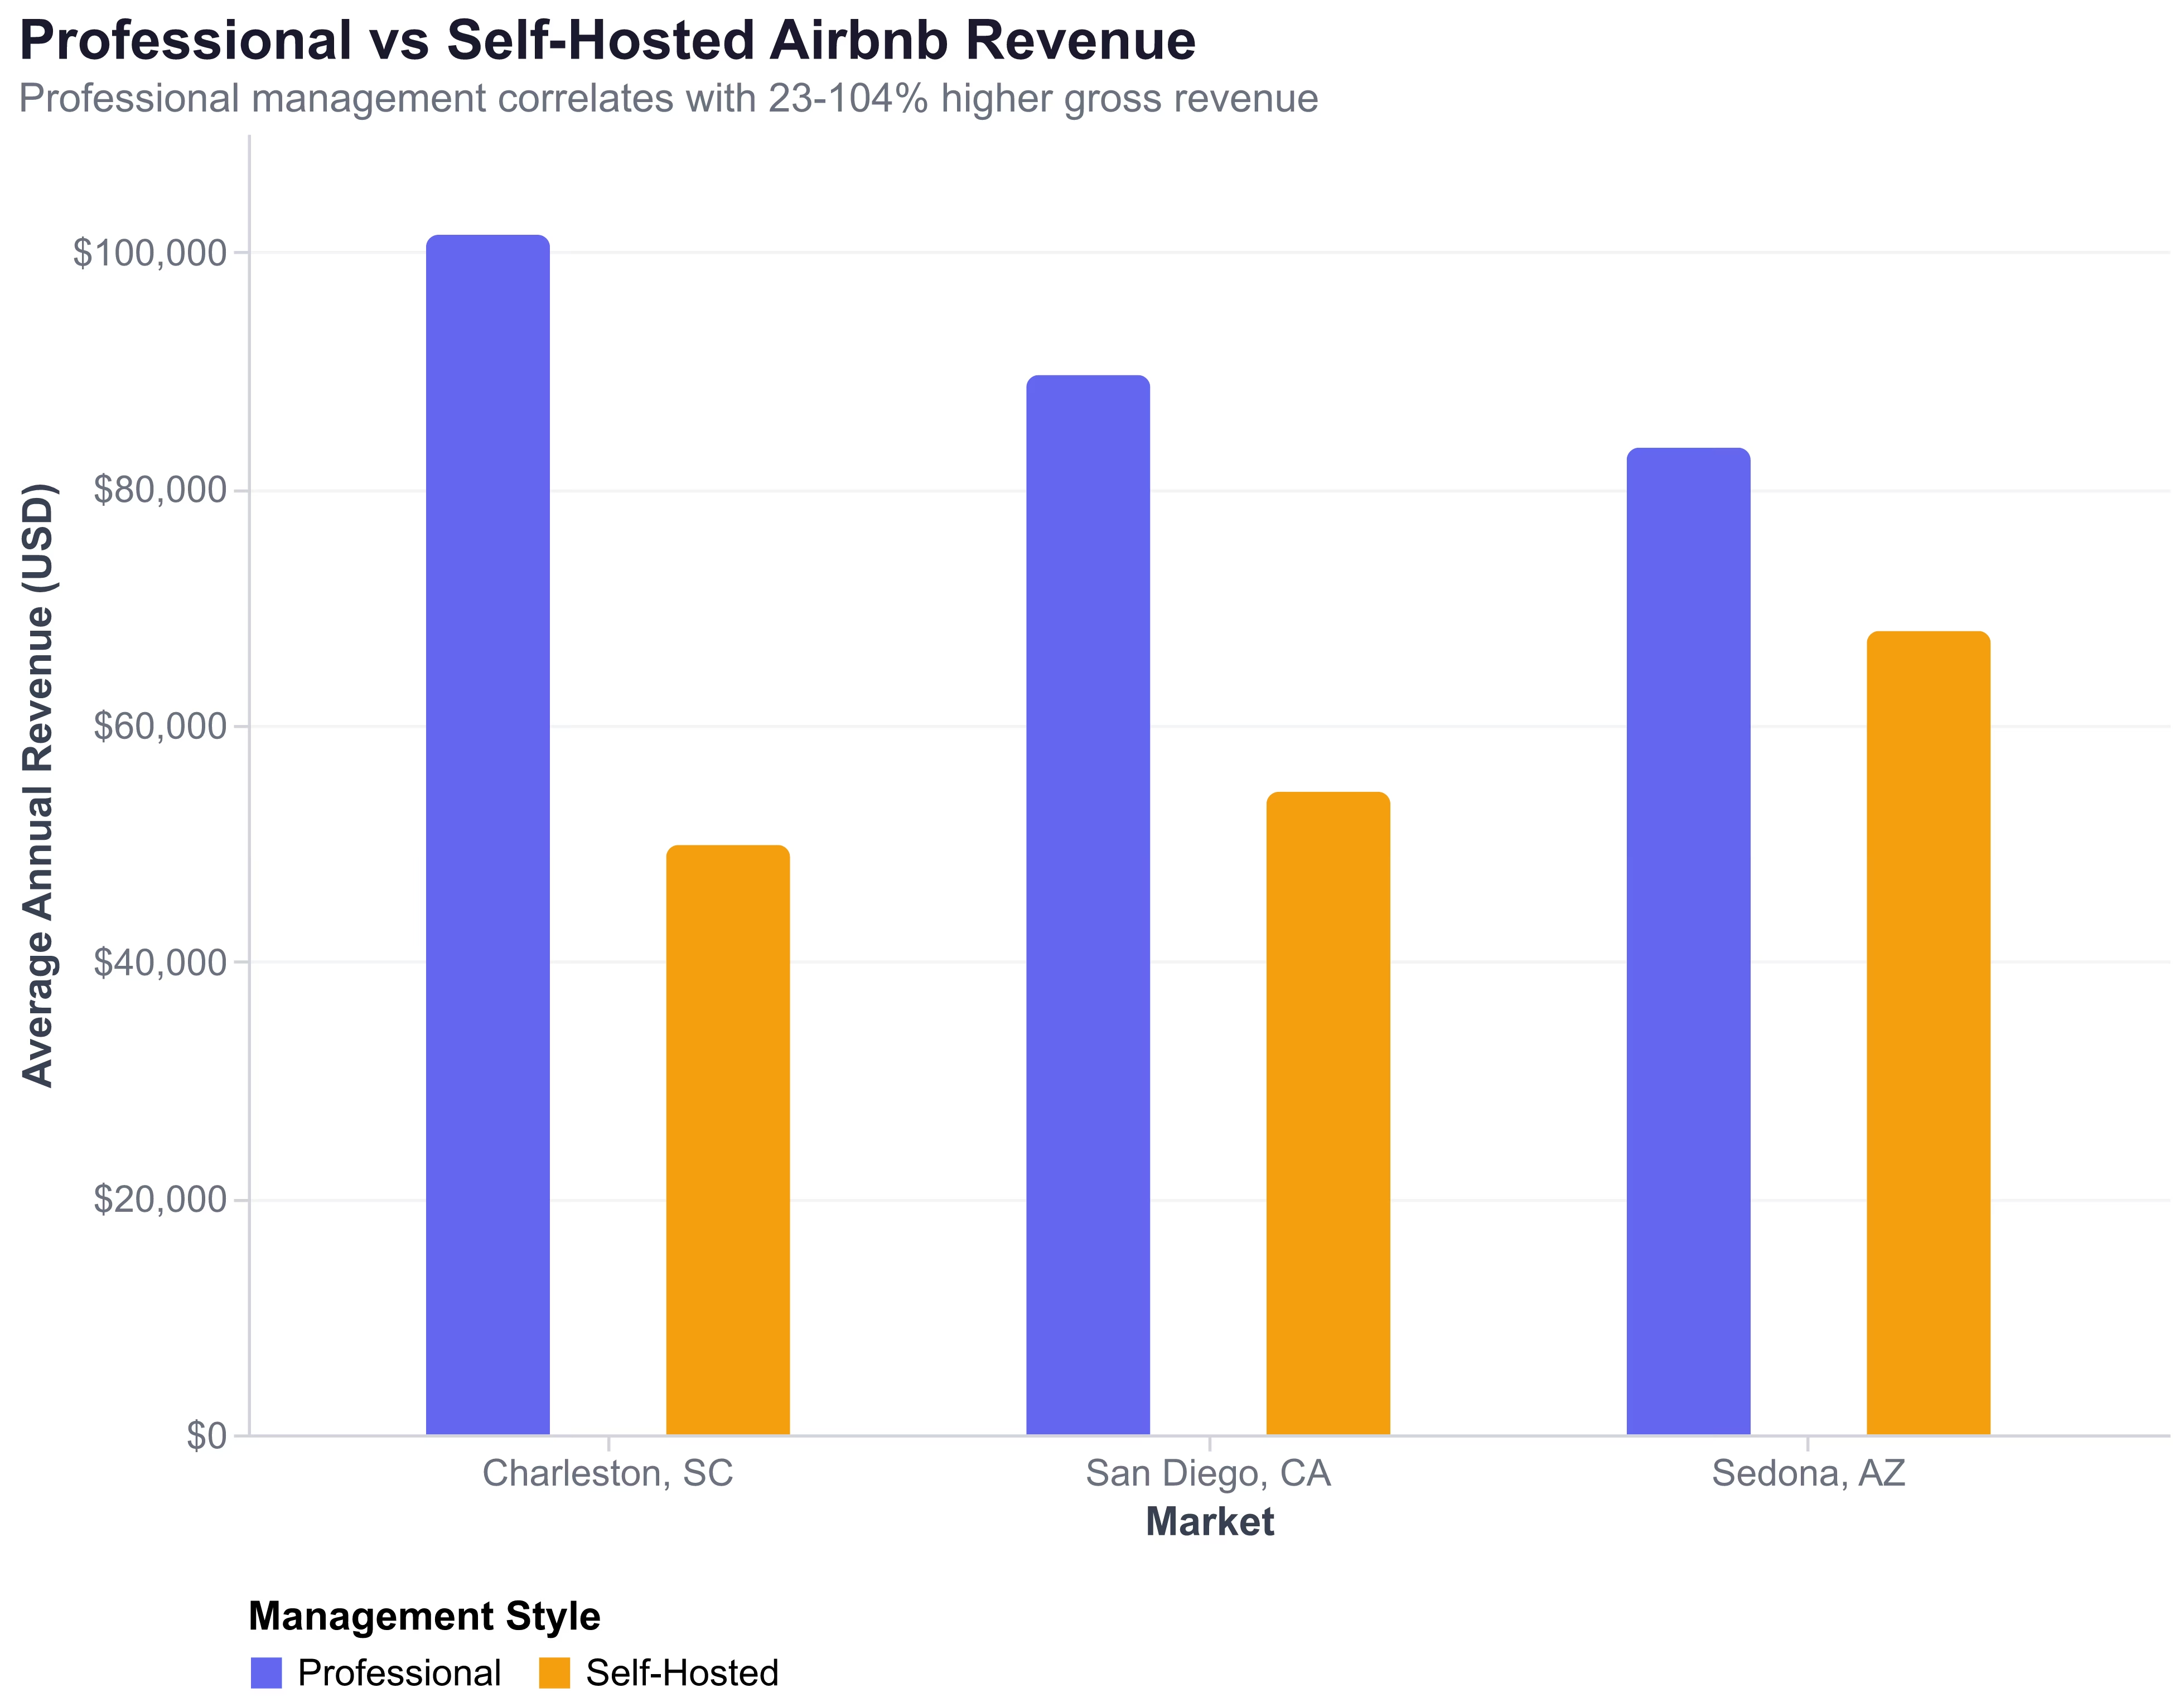
| Market | Professional | Self-Hosted | Gross Premium |
|---|---|---|---|
| Charleston, SC | $101,413 | $49,832 | +104% |
| San Diego, CA | $89,557 | $54,326 | +65% |
| Sedona, AZ | $83,417 | $67,923 | +23% |
In Charleston, professionally managed properties earn 104% more — $101,413 versus $49,832 for self-hosted listings. In San Diego, the premium is 65%. In Sedona, it narrows to 23%.
Three factors explain the variation. First, selection bias: property management companies tend to operate larger, better-located properties. A company managing twenty 4BR beachfront homes will naturally show higher per-listing revenue than a portfolio of individual hosts with 1-2BR condos. Second, pricing optimization: professional managers typically deploy dynamic pricing algorithms, maintain aggressive minimum-night strategies, and optimize listing content. Third, availability management: professional listings tend to maintain higher availability (fewer owner-blocked dates), increasing bookable inventory.
The critical question for hosts is whether the gross revenue premium translates to net income after management fees. As one industry analysis noted, "Self-management typically yields higher profit margins (35-45% vs 25-35% with professional management) but requires significant time investment." A host earning $54,326 self-managed in San Diego and keeping 40% net ($21,730) may outperform one earning $89,557 through a manager who keeps 28% net ($25,076) — but only by investing 15-25 hours per week in guest communication, cleaning coordination, and maintenance.
The Amenity Premium: Hot Tubs, Pools, and the Revenue They Add
Specific amenities deliver quantifiable revenue premiums that vary by market type. AirROI data isolates the impact of two high-value amenities: hot tubs in mountain/leisure markets and pools in coastal/warm markets.
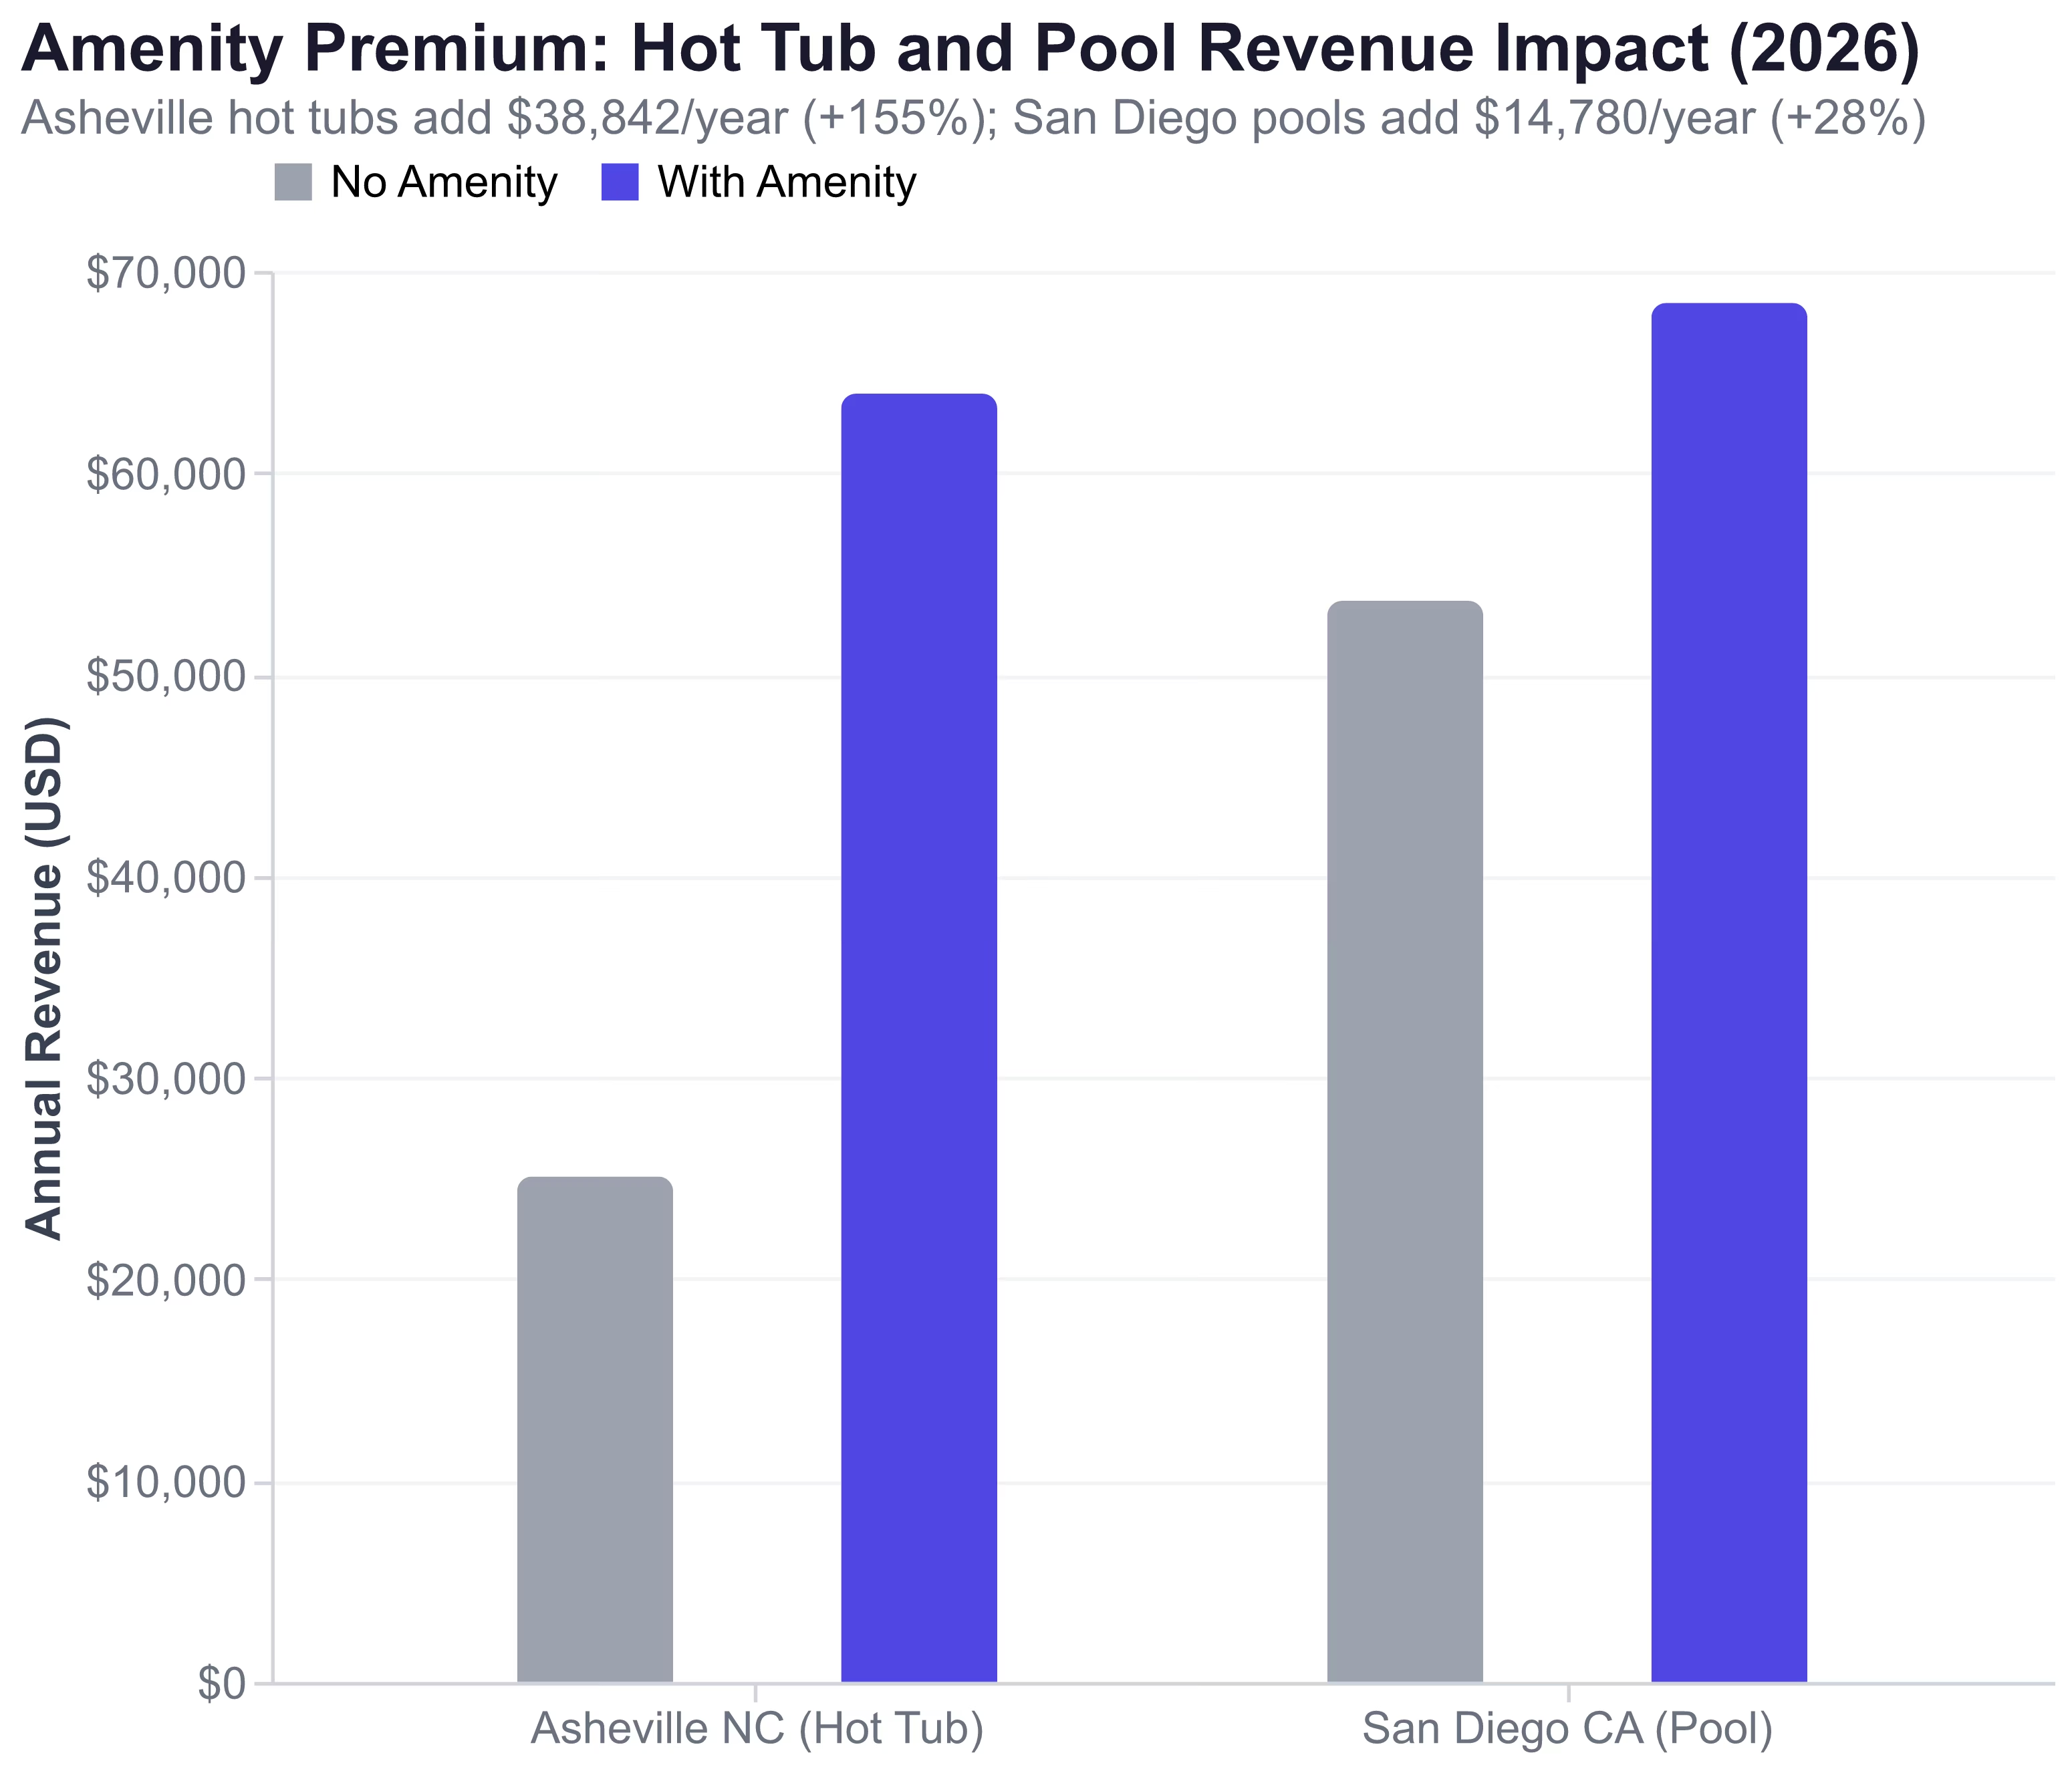
Asheville, NC: The Hot Tub Premium
| Amenity Status | Annual Revenue | ADR | Occupancy |
|---|---|---|---|
| With Hot Tub | $63,915 | $454 | 49% |
| No Pool/Hot Tub | $25,073 | $226 | 44% |
| Premium | +$38,842 (+155%) | +$228 | +5 pts |
In Asheville, a hot tub adds $38,842 per year — a 155% revenue premium. The ADR jumps from $226 to $454, and occupancy ticks up 5 percentage points. For a mountain market where guests expect a retreat experience, the hot tub is not a luxury add-on; it is the difference between a $25K listing and a $64K listing.
San Diego, CA: The Pool Premium
| Amenity Status | Annual Revenue | ADR | Occupancy |
|---|---|---|---|
| With Pool | $68,416 | $609 | 50% |
| No Pool/Hot Tub | $53,636 | $373 | 55% |
| Premium | +$14,780 (+28%) | +$236 | -5 pts |
In San Diego, pools command a 63% ADR premium ($609 vs $373) but actually reduce occupancy by 5 percentage points — likely because pool properties tend to be larger, higher-priced homes that attract a narrower guest segment. The net revenue gain is a more substantial $14,780 (28%), but still illustrates that amenity ROI is market-dependent — the Asheville hot tub is more than 2.5x as valuable as the San Diego pool.
Revenue Percentile Breakdown: Where Do You Really Stand?
Averages obscure the enormous income dispersion within any single market. AirROI's percentile data reveals what hosts at each tier actually earn — and the gap between a 25th and 90th percentile host in the same city can exceed $100,000.
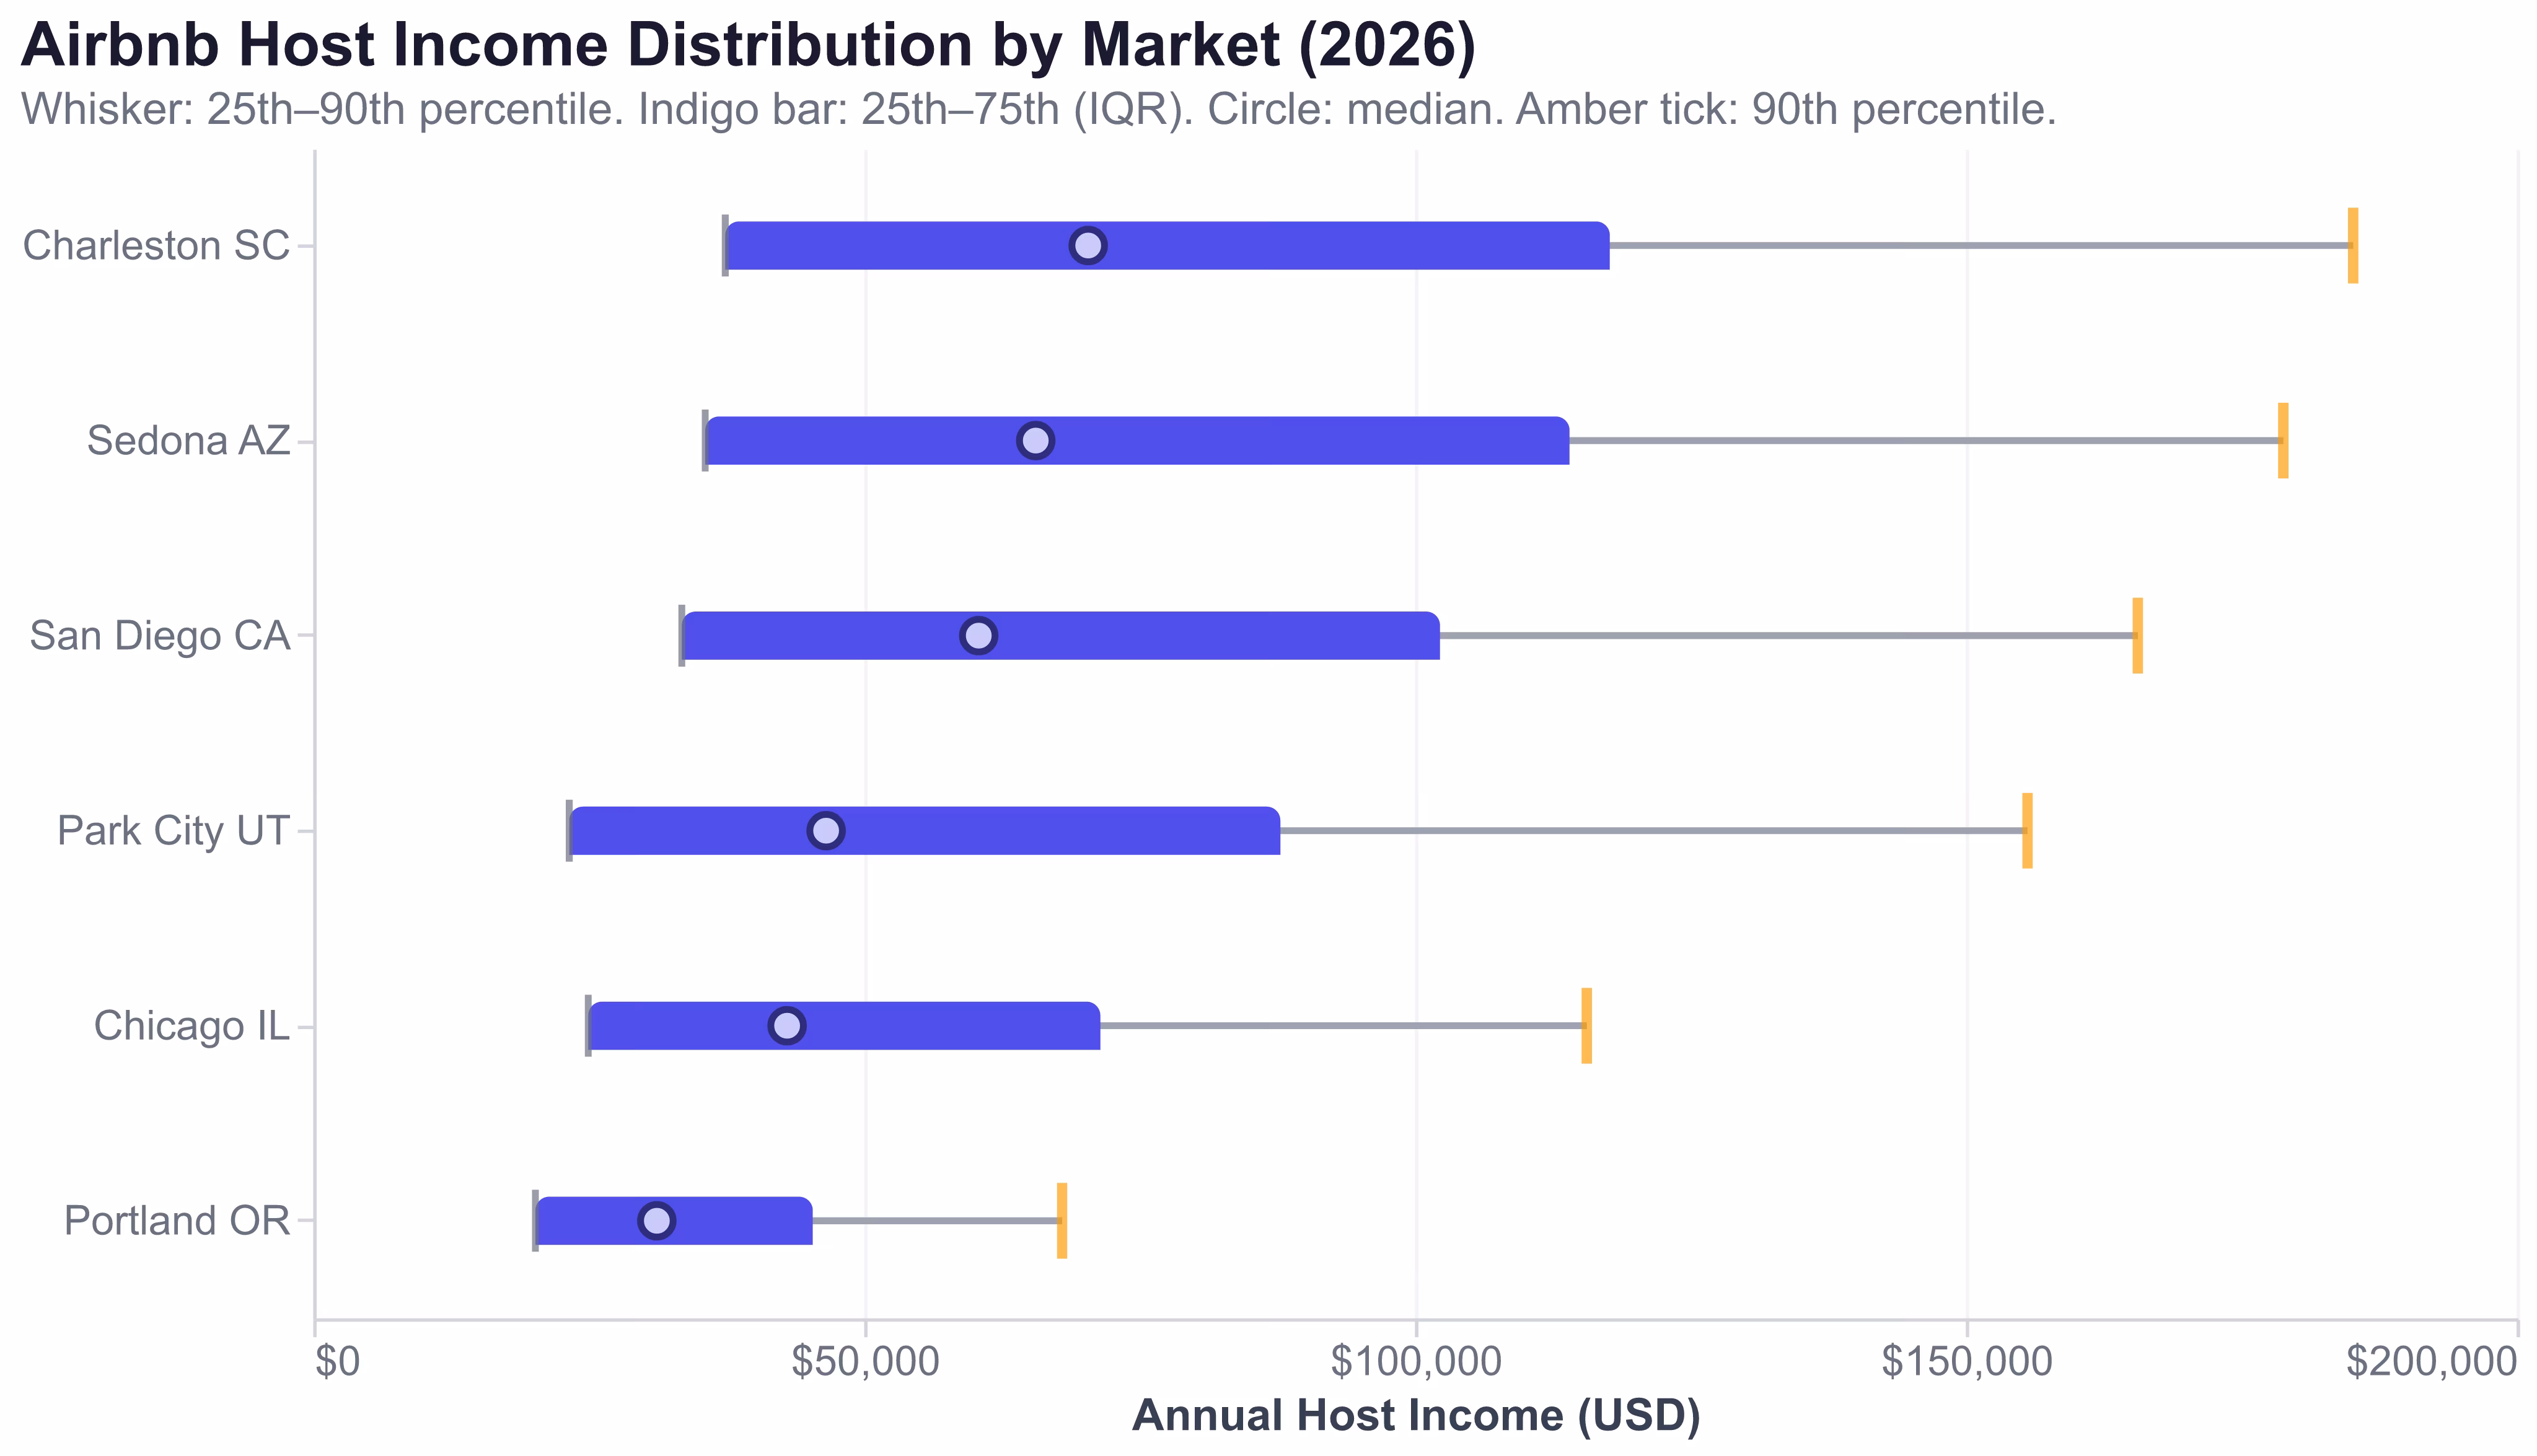
Annual Revenue by Percentile (Aggregated from Monthly Data)
| Market | 25th Pctile | Median | 75th Pctile | 90th Pctile |
|---|---|---|---|---|
| Charleston, SC | ~$37,396 | ~$70,342 | ~$117,691 | ~$185,168 |
| Sedona, AZ | ~$35,577 | ~$65,579 | ~$114,035 | ~$178,824 |
| San Diego, CA | ~$33,453 | ~$60,405 | ~$102,273 | ~$165,618 |
| Park City, UT | ~$23,236 | ~$46,551 | ~$87,783 | ~$155,601 |
| Chicago, IL | ~$24,956 | ~$43,011 | ~$71,444 | ~$115,598 |
| Portland, OR | ~$20,161 | ~$31,185 | ~$45,341 | ~$67,976 |
Source: AirROI monthly percentile data aggregated to annual estimates, April 2026 (entire-home listings)
In Charleston, the 90th percentile host earns approximately $185,168 per year — nearly 5x more than the 25th percentile host at $37,396. In Park City, the spread is even wider at 6.7x ($155,601 vs $23,236) because extreme ski-season demand concentrates revenue among properties that are fully optimized for peak pricing.
The monthly data tells an equally compelling story. Charleston's peak monthly revenue at the 90th percentile is $19,136 (April), while its trough is $10,186 (January). Park City's seasonality is far more extreme: $25,080 in February versus just $6,168 in May at the 90th percentile, and just $709 at the 25th percentile in May.
Key takeaway: Benchmarking your Airbnb income against a national "average" is meaningless. The only relevant comparison is your percentile position within your specific market. A host earning $45,000 in Portland sits near the 75th percentile; the same $45,000 in Sedona places that host below the 25th percentile.
What Separates a $25K Host from a $185K Host
The data in this article tells a clear story: the gap between low-earning and high-earning Airbnb hosts is not random luck or minor optimization. It is the compounding result of five decisions, ranked by impact:
1. Market selection (4.2x variance). Sedona at $69,897 versus Tenerife at $16,812. This single decision sets the baseline more than any other factor. Resort and leisure markets with strong tourism demand consistently outperform urban and suburban markets.
2. Bedroom count (4.6x variance). A 5BR+ in Charleston earns $159,492 versus a 1BR at $34,566. Each additional bedroom adds $18,000-$57,000 in annual revenue, with 2-3BR offering the optimal ROI balance.
3. Property type (4.4x variance). Entire homes earn $58,967 versus private rooms at $13,476 in San Diego. This is a binary decision that sets the revenue tier.
4. Amenity tier (up to 155% premium). A hot tub in Asheville transforms a $25,073 listing into a $63,915 listing. In the right market, a single amenity investment recoups its cost within one year.
5. Management style (23-104% gross premium). Professional management drives 23-104% higher gross revenue, though net income benefits are smaller after fees. The choice depends on the host's time, scale, and willingness to invest in operational systems.
A host who selects a strong resort market, purchases a 3-4BR entire home with a hot tub, and either self-manages with dynamic pricing or engages professional management is structurally positioned for the 75th-90th percentile. A host who lists a 1BR private room in a mid-tier urban market without premium amenities is structurally positioned for the 25th percentile — regardless of how beautiful their listing photos are.
The data does not lie. Airbnb income in 2026 is a function of real estate fundamentals amplified by hospitality execution.
Frequently Asked Questions
There is no single meaningful average. Airbnb's self-reported figure of $14,000/year (from 2022) includes part-time spare-room hosts, while AirDNA's 2025 estimate of $44,235 reflects more active operators. AirROI data across 15 markets shows median annual revenue ranging from $16,812 (Tenerife) to $69,897 (Sedona), with 90th percentile hosts earning $68,000-$185,000.
Monthly Airbnb income varies dramatically by season. In Park City, UT, a 90th percentile host earns $25,080 in February but just $6,168 in May. In San Diego, 90th percentile monthly revenue ranges from $10,252 (January) to $22,323 (July). Dividing annual revenue by 12 obscures the seasonal volatility that defines most STR markets.
Yes, for well-positioned properties. Airbnb booked 533 million nights in 2025, up 8% year-over-year. AirROI data shows 90th percentile hosts average $68,000-$185,000/year across 15 markets. However, 25th percentile hosts in weaker markets earn under $25,000, making profitability dependent on market selection, bedroom count, amenities, and management.
Entire homes earn 4.4x more than private rooms — $58,967 vs $13,476 annually in San Diego. Among entire homes, 3-4 bedroom properties in resort or leisure markets deliver the strongest combination of high ADR and solid occupancy. A 3BR in Charleston earns $74,663/year; a 3BR in San Diego earns $77,046.
In mountain and leisure markets, hot tubs deliver the single highest-ROI amenity premium. In Asheville, NC, listings with hot tubs earn $63,915/year vs $25,073 for properties without a pool or hot tub — a 155% revenue premium worth $38,842 annually. Pools in San Diego add a 63% ADR premium ($609 vs $373 per night).