
How Many Bedrooms Should Your Airbnb Have? Data From 8 Markets Reveals the Sweet Spot
A 5-bedroom Gatlinburg cabin generates $89,332 per year -- 3.3x what a 1-bedroom earns in the same market. Case closed: bigger is better. Except it isn't. Divide that revenue by bedroom count, and the 1-bedroom earns $27,367 per bedroom -- 53% more efficiently than the 5-bedroom's $17,866. Factor in a purchase price that's 3-5x higher, furnishing costs that quadruple, and cleaning expenses that scale non-linearly, and the "bigger is always better" advice starts failing basic math.
AirROI analyzed airbnb bedroom count revenue data across 8 diverse US markets -- Nashville, Gatlinburg, Scottsdale, Austin, Destin, Denver, Miami Beach, and Joshua Tree -- filtering by bedroom count for entire-home listings. The findings challenge conventional wisdom: 1-bedroom properties deliver the highest revenue per bedroom in 6 out of 8 markets, 3-bedrooms represent the most consistent sweet spot across market types, and the optimal property size depends far more on your market type than on any universal rule.
The "Bigger Is Better" Myth -- And the Metric That Exposes It
Total revenue always rises with bedroom count. Across all 8 markets, the pattern is unbroken: 1-bedrooms average $20,352 per year, 2-bedrooms $26,543, 3-bedrooms $39,280, 4-bedrooms $53,883, and 5+ bedrooms $90,399. An investor looking at these numbers alone would conclude that buying the largest possible property maximizes returns.
But revenue per bedroom -- total annual revenue divided by bedroom count -- tells the opposite story. This metric normalizes performance across property sizes, revealing which configurations generate the most revenue per unit of capacity (and roughly, per unit of capital deployed).
| Bedrooms | Avg Revenue | Avg Revenue/BR | Avg ADR | Avg Occupancy |
|---|---|---|---|---|
| 1 BR | $20,352 | $20,352 | $208 | 51% |
| 2 BR | $26,543 | $13,272 | $283 | 48% |
| 3 BR | $39,280 | $13,093 | $424 | 47% |
| 4 BR | $53,883 | $13,471 | $585 | 45% |
| 5+ BR | $90,399 | $18,080 | $847 | 45% |
The 1-bedroom tier leads revenue per bedroom at $20,352 -- 55% higher than the 2-bedroom's $13,272. The 5+ bedroom tier recovers to $18,080 per bedroom, driven by premium ADR, but never catches the 1-bedroom's per-unit efficiency. The 2-bedroom and 3-bedroom tiers sit in a valley where revenue per bedroom bottoms out -- the property is large enough to require substantial investment but not yet commanding the luxury premiums of 4-5+ bedroom homes.
Revenue differences between sizes are driven almost entirely by rate, not fill -- making ADR-optimized pricing the primary lever for performance at every bedroom count. -- PriceLabs 2026 Revenue Analysis
Revenue, ADR, and Occupancy by Bedroom Count: The Full 8-Market Breakdown
AirROI data reveals how the best airbnb property size for revenue shifts dramatically across market types. Here is the complete dataset:
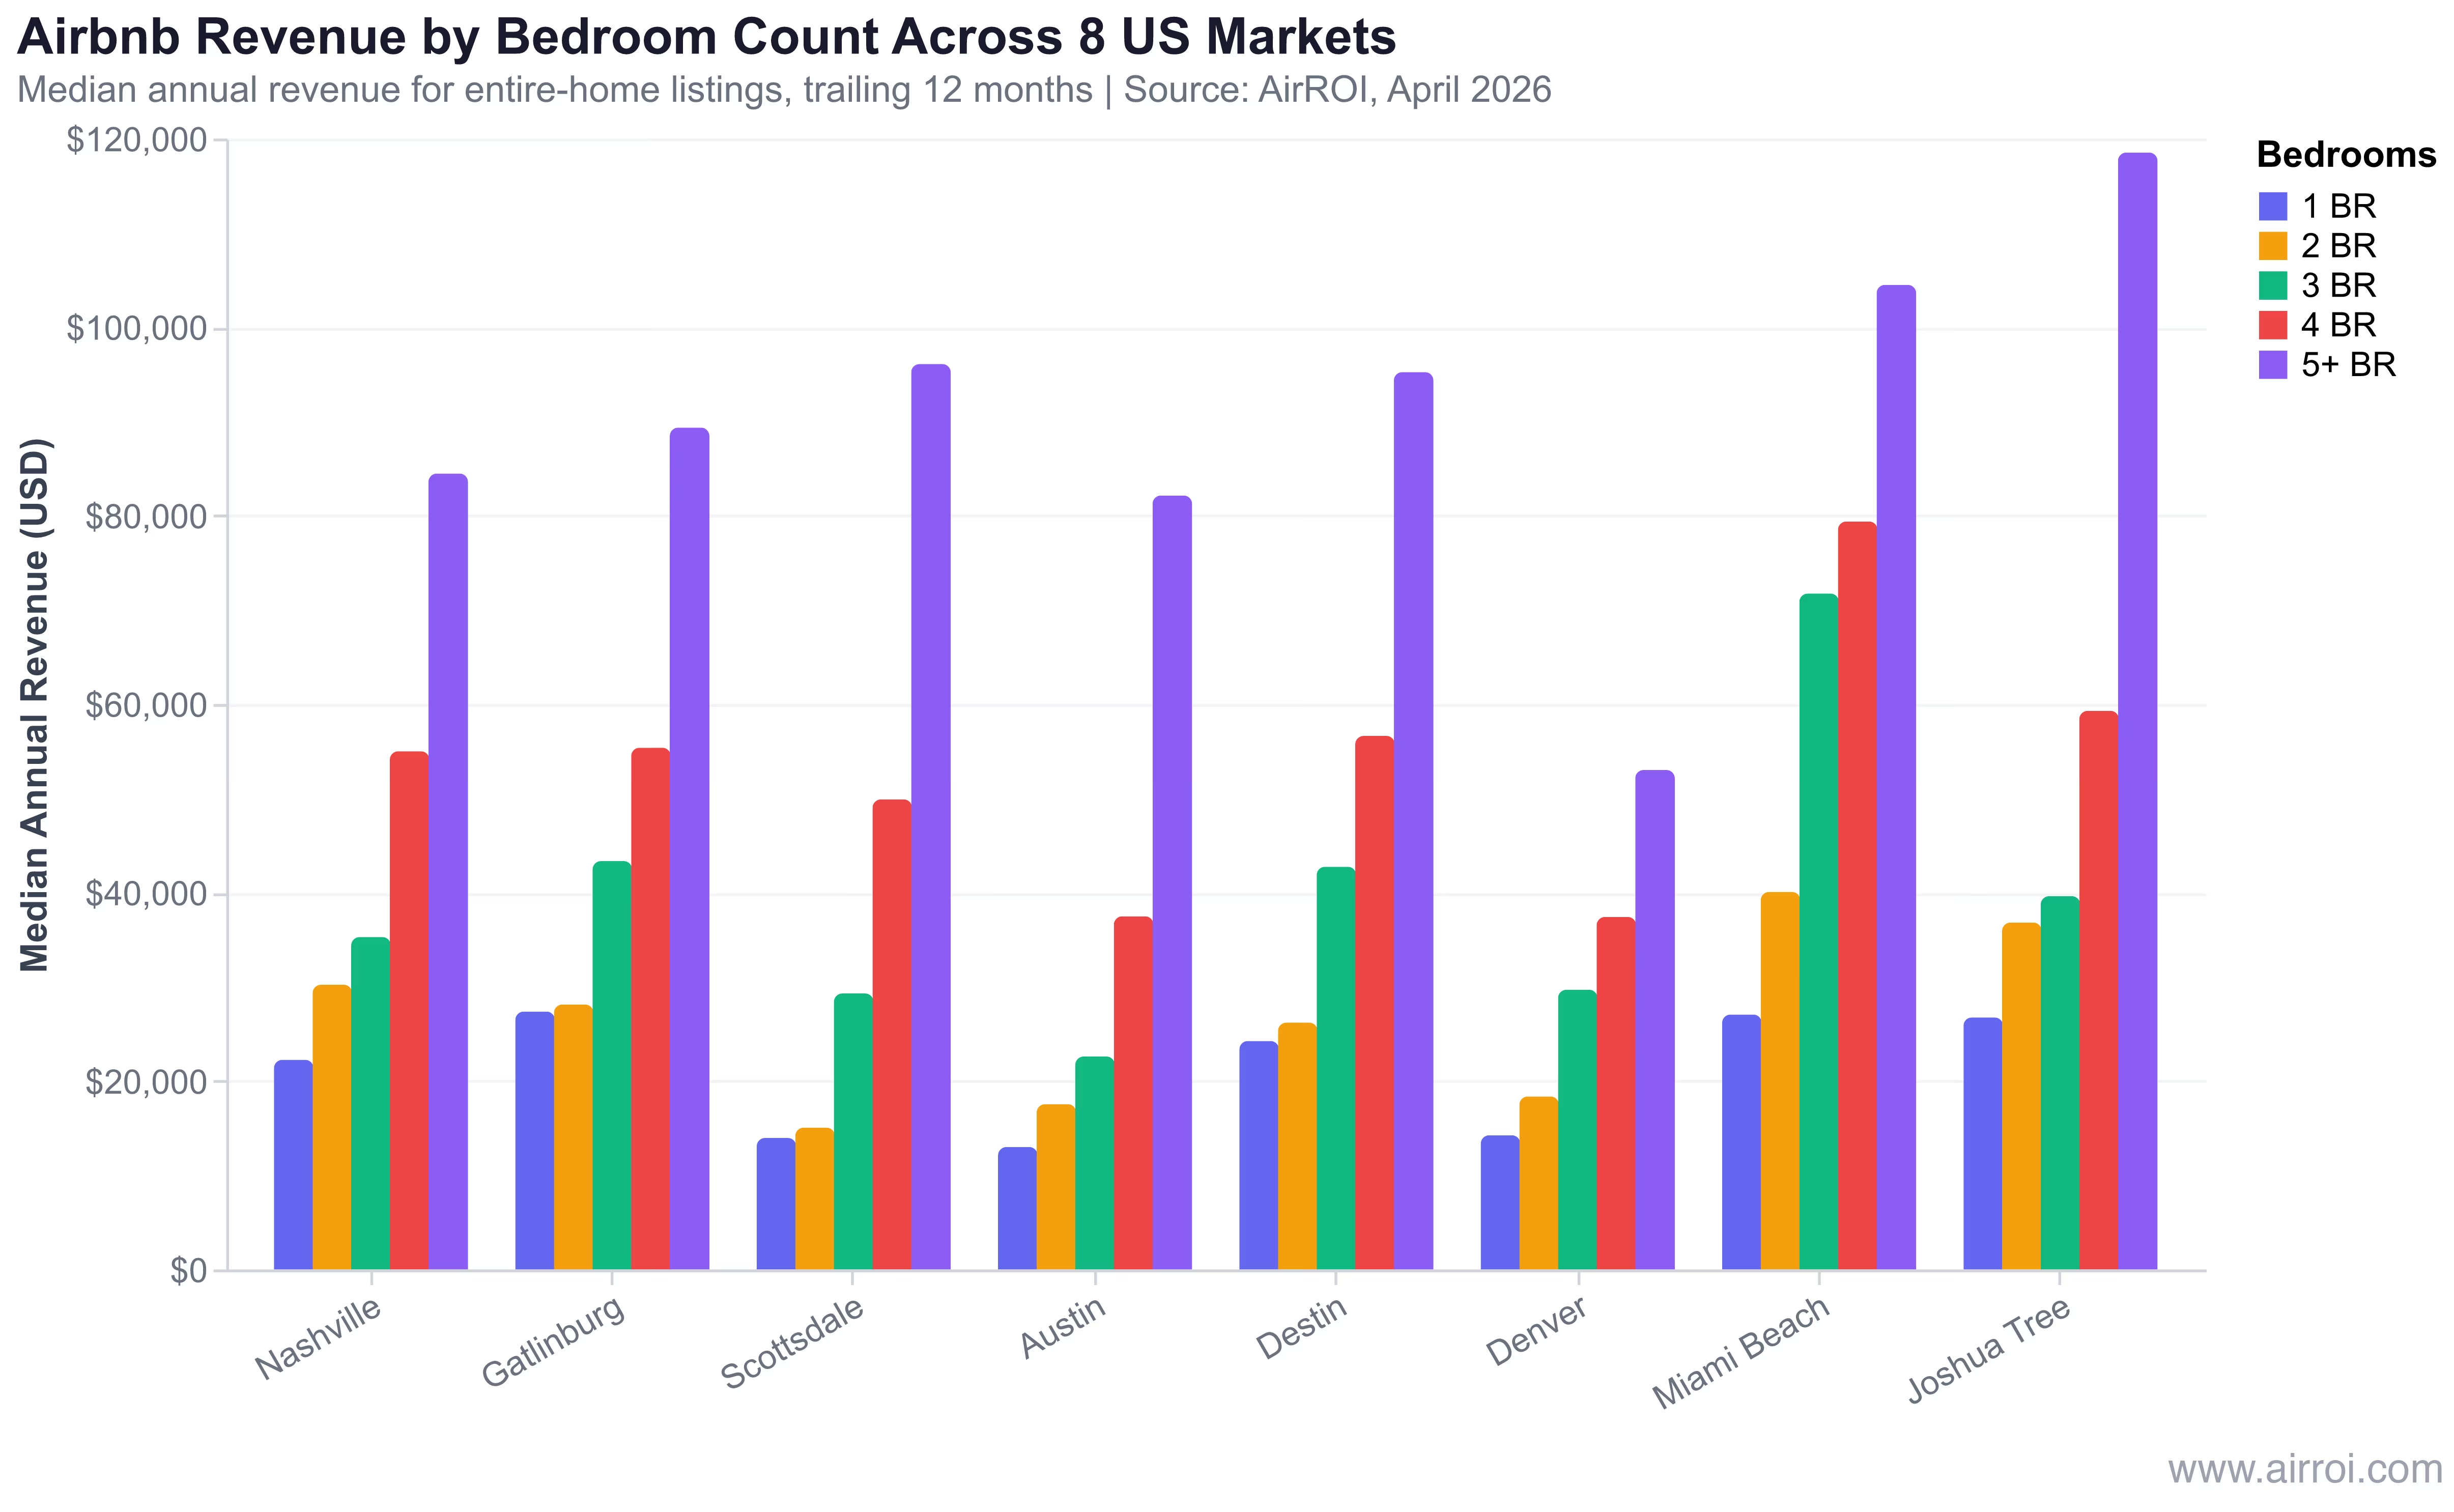
| Market | 1 BR | 2 BR | 3 BR | 4 BR | 5+ BR |
|---|---|---|---|---|---|
| Nashville | $22,248 | $30,213 | $35,274 | $54,984 | $84,453 |
| Gatlinburg | $27,367 | $28,114 | $43,334 | $55,362 | $89,332 |
| Scottsdale | $13,956 | $15,053 | $29,288 | $49,879 | $96,075 |
| Austin | $12,994 | $17,537 | $22,599 | $37,476 | $82,124 |
| Destin | $24,243 | $26,194 | $42,731 | $56,615 | $95,217 |
| Denver | $14,240 | $18,359 | $29,680 | $37,407 | $53,001 |
| Miami Beach | $27,051 | $40,063 | $71,718 | $79,366 | $104,475 |
| Joshua Tree | $26,742 | $36,812 | $39,612 | $59,276 | $118,514 |
The biggest absolute revenue jump occurs between 2-bedroom and 3-bedroom -- a 48% increase on average ($26,543 to $39,280). This inflection point reflects the shift from couples-and-solo to family-and-group demand, where larger properties command meaningfully higher nightly rates.
Revenue Per Bedroom Comparison
When normalized per bedroom, the competitive landscape changes:
| Market | 1 BR Rev/BR | 2 BR Rev/BR | 3 BR Rev/BR | 4 BR Rev/BR | 5+ BR Rev/BR |
|---|---|---|---|---|---|
| Nashville | $22,248 | $15,106 | $11,758 | $13,746 | $16,891 |
| Gatlinburg | $27,367 | $14,057 | $14,445 | $13,840 | $17,866 |
| Scottsdale | $13,956 | $7,527 | $9,763 | $12,470 | $19,215 |
| Austin | $12,994 | $8,769 | $7,533 | $9,369 | $16,425 |
| Destin | $24,243 | $13,097 | $14,244 | $14,154 | $19,043 |
| Denver | $14,240 | $9,179 | $9,893 | $9,352 | $10,600 |
| Miami Beach | $27,051 | $20,032 | $23,906 | $19,842 | $20,895 |
| Joshua Tree | $26,742 | $18,406 | $13,204 | $14,819 | $23,703 |
Bold values indicate the highest revenue-per-bedroom tier in each market. 1-bedrooms lead in Nashville, Gatlinburg, Destin, Denver, Miami Beach, and Joshua Tree (6 of 8 markets). Only Scottsdale and Austin see 5+ bedrooms take the per-bedroom crown -- both luxury-oriented markets where large properties command extreme ADR premiums ($1,015 and $947 per night, respectively).
Urban Markets: Why 2-3 Bedrooms Dominate
In Denver, Austin, Nashville, and Miami Beach, 2-3 bedroom properties deliver the strongest balance of absolute revenue, occupancy stability, and capital efficiency for most investors.
Denver exemplifies the urban pattern. One-bedroom listings achieve 58% occupancy -- the highest across all bedroom tiers and all 8 markets. But at $14,240 annual revenue, a 1-bedroom barely covers the mortgage on a $280,000 condo after operating costs. The 3-bedroom generates $29,680 -- more than double -- at 54% occupancy, providing a revenue floor that supports financing while keeping operating costs manageable.
Miami Beach presents a unique case: the 3-bedroom tier achieves $23,906 revenue per bedroom -- the highest per-bedroom efficiency of any market-tier combination across all 8 markets. At $820 ADR and 45% occupancy, Miami Beach 3-bedrooms serve the luxury group travel segment (destination weddings, friend groups, family reunions) that commands premium rates in a supply-constrained environment (just 214 three-bedroom listings, or 5% of the market).
Nashville's 4-bedroom tier stands out at $54,984 annual revenue, driven by the overlap between family travelers and bachelorette party groups. With 1,342 four-bedroom listings generating $519 ADR, Nashville's 4BR segment offers substantial absolute revenue without the extreme capital requirements of 5+ bedroom properties.
Leisure Markets: Where Bigger Actually Pays Off
In Gatlinburg, Destin, Scottsdale, and Joshua Tree, larger properties reward investors disproportionately -- if they can absorb the acquisition cost.
Gatlinburg's 5+ bedroom cabins generate $89,332 per year at $785 ADR and 46% occupancy. With only 415 competing 5+ bedroom listings (12% of Gatlinburg's supply), these properties operate in a supply-scarce environment. The 3-bedroom tier generates a respectable $43,334, but faces 829 competitors (23% of supply). For a leisure market investor choosing between one 5BR cabin or two 3BR cabins, the math is close: $89,332 versus $86,668 combined -- but the single large property faces half the competition.
Joshua Tree offers the starkest supply-demand imbalance. The 5+ bedroom tier contains just 39 listings generating $118,514 annually -- the highest absolute revenue of any market-bedroom combination in this analysis. At $1,029 ADR, these properties serve the luxury desert retreat segment. But with only 39 competitors, this is also the thinnest market segment, making comparable data limited and revenue projections less certain.
Scottsdale's luxury orientation rewards scale at every level. The progression from 1BR ($13,956) to 5BR+ ($96,075) represents a 6.9x revenue multiple -- the steepest across all 8 markets. Scottsdale 5BR+ properties command $1,015 ADR, driven by snowbird season, golf groups, and spring training demand. Investors with the capital to enter this segment face 602 competitors, more than Gatlinburg or Joshua Tree's 5BR+ tiers, but still just 14% of Scottsdale's total supply.
Where Competition Clusters -- And Where Gaps Exist
Supply density determines how crowded your competitive set is at each bedroom tier. AirROI data reveals distinct patterns:
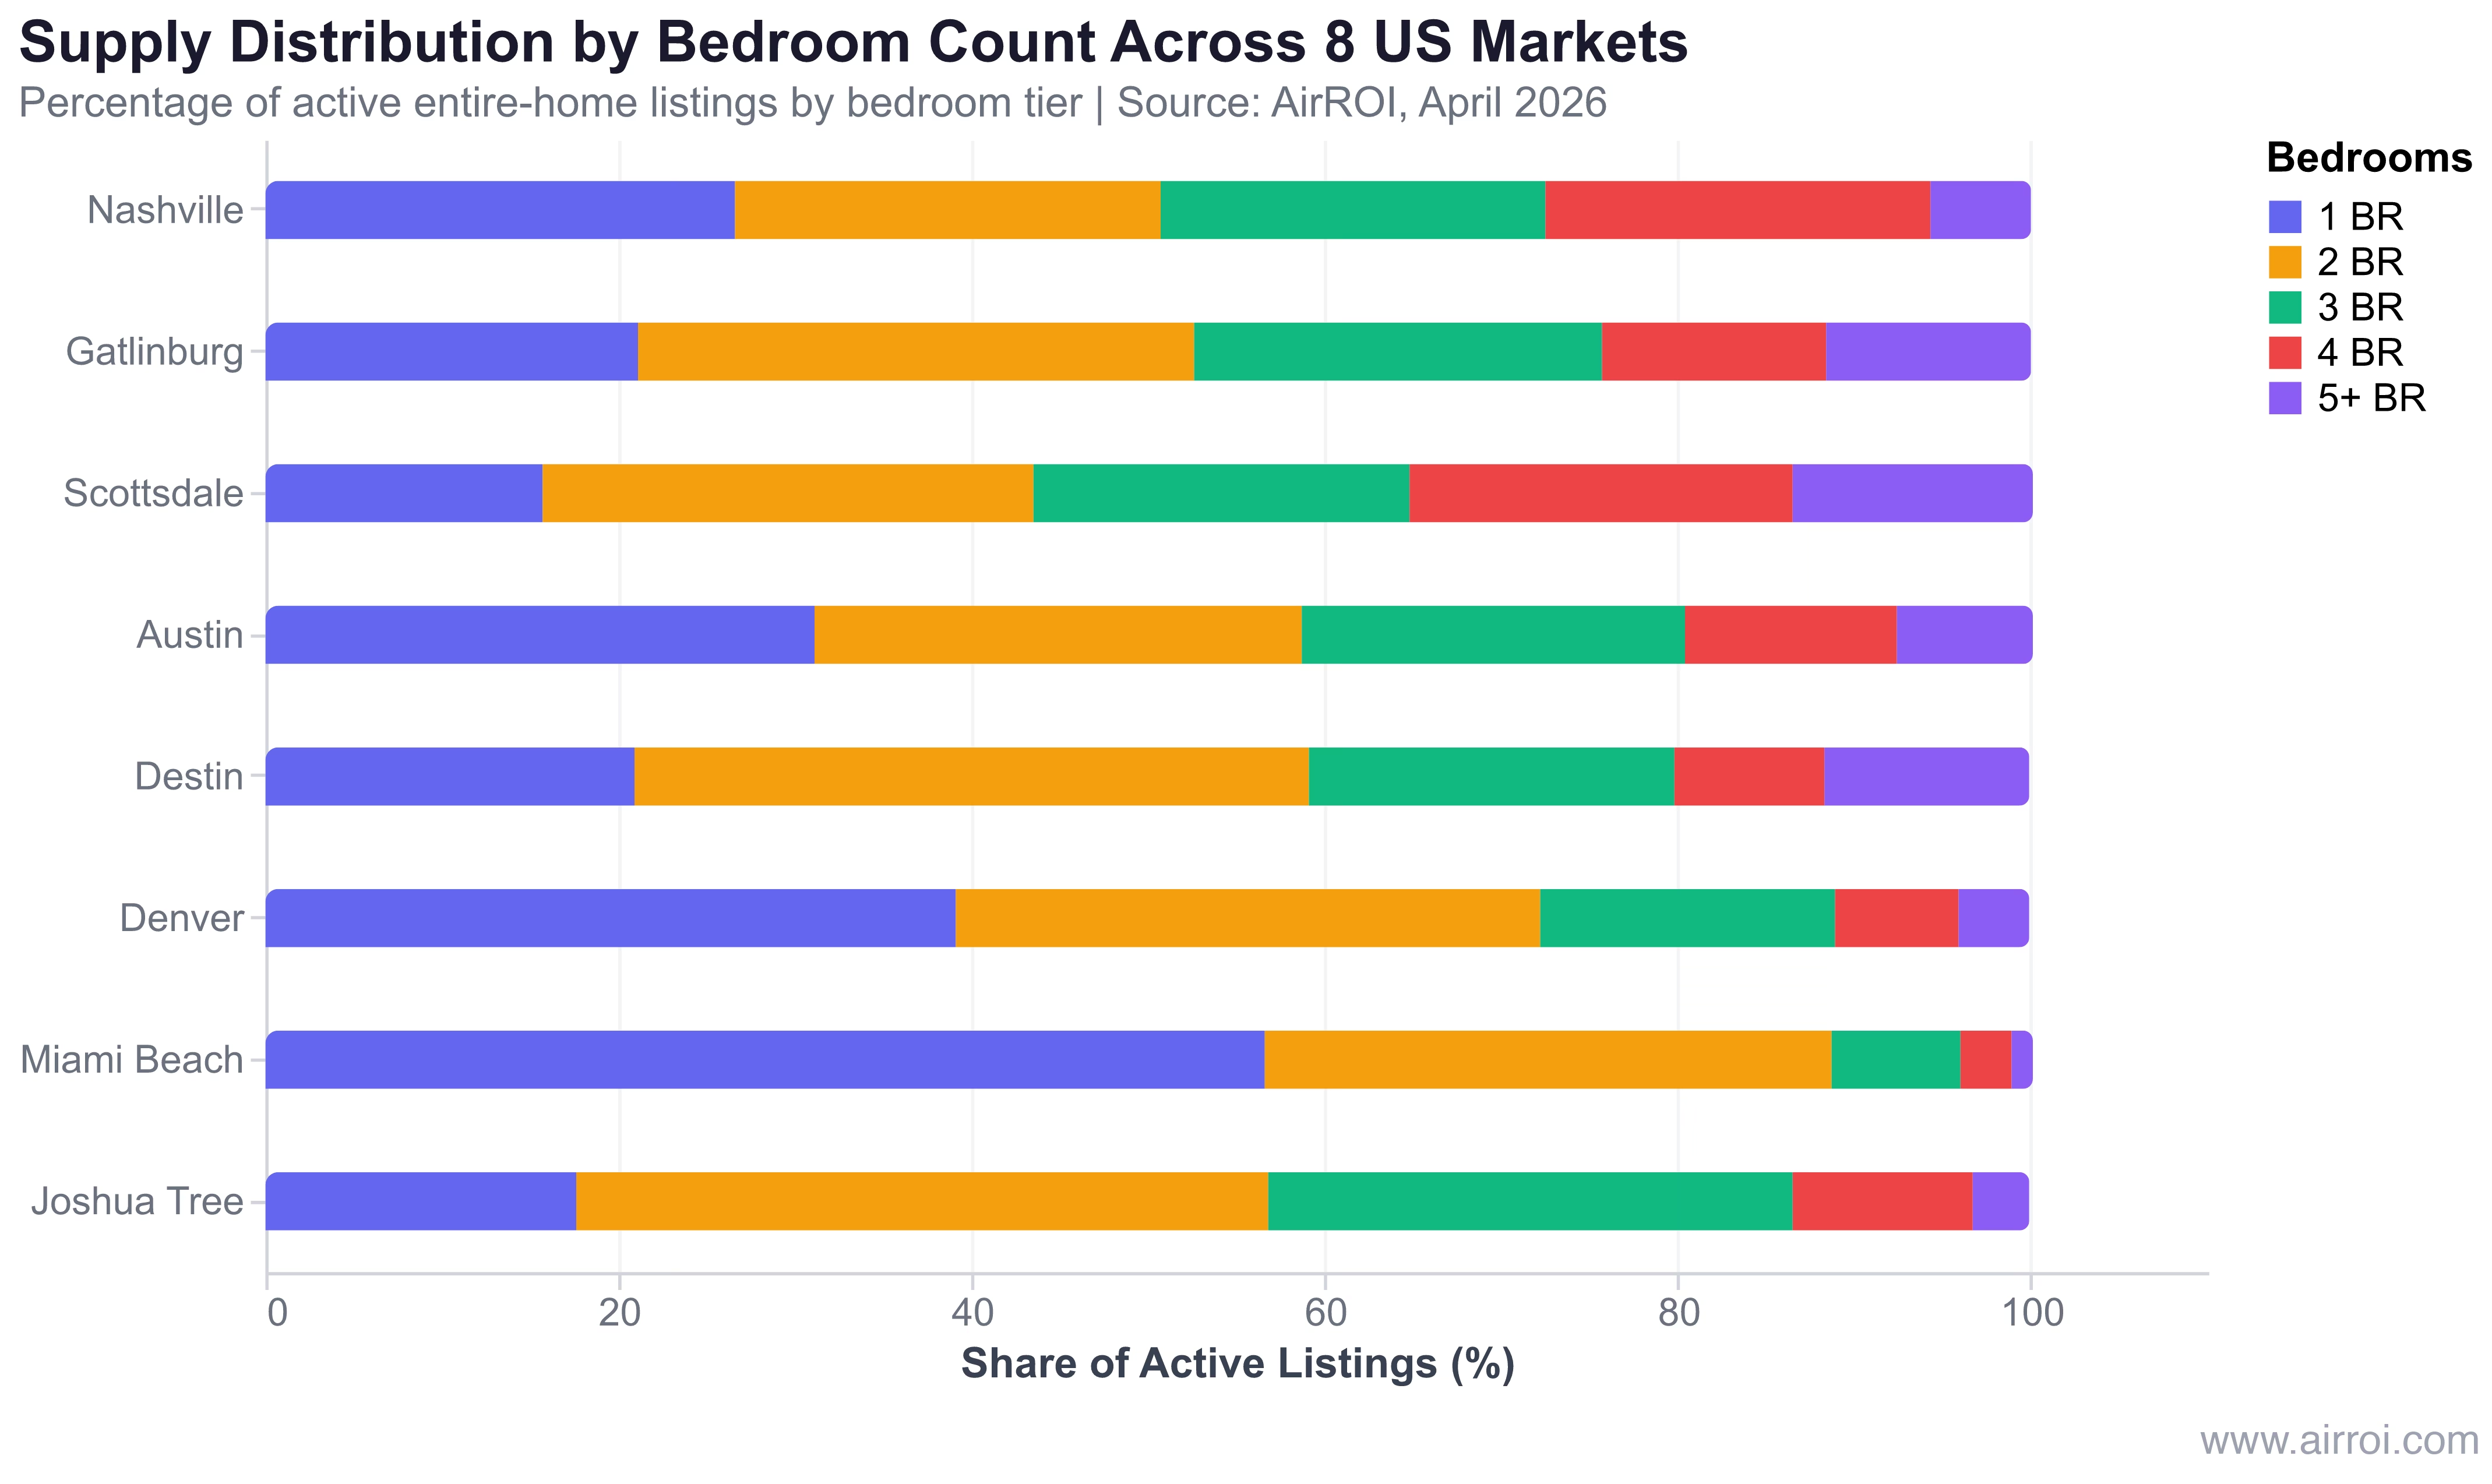
Urban markets concentrate supply at 1-2 bedrooms. Denver's 1-bedroom tier accounts for 39% of all listings; Miami Beach's 1-bedroom tier reaches 43%. These are the most competitive segments, where hundreds of similar listings compete on price, photos, and reviews. Adding another 1-bedroom to Miami Beach means competing against 1,664 existing listings.
Leisure markets spread supply more evenly but compress at 5+ bedrooms. Gatlinburg distributes listings across all tiers (21% / 31% / 23% / 13% / 12%), while Destin clusters at 2-bedrooms (38%). The universal finding: 5+ bedroom properties represent just 1-14% of supply across all 8 markets, making this the least competitive tier regardless of market type.
The supply gap creates pricing power. With fewer competitors at the 5+ bedroom tier, large property operators face less pressure to discount during shoulder seasons. Booking lead times confirm this: 5+ bedroom properties across all 8 markets average 76-day lead times versus 38 days for 1-bedrooms, indicating that guests plan further ahead and are less likely to comparison-shop at the last minute.
| Market | Most Crowded Tier | Least Crowded Tier | 5+ BR Supply Share |
|---|---|---|---|
| Nashville | 1 BR (27%) | 5+ BR (6%) | 350 listings |
| Gatlinburg | 2 BR (31%) | 5+ BR (12%) | 415 listings |
| Scottsdale | 2 BR (28%) | 5+ BR (14%) | 602 listings |
| Austin | 1 BR (26%) | 5+ BR (6%) | 635 listings |
| Destin | 2 BR (38%) | 5+ BR (12%) | 454 listings |
| Denver | 1 BR (39%) | 5+ BR (4%) | 136 listings |
| Miami Beach | 1 BR (43%) | 5+ BR (1%) | 35 listings |
| Joshua Tree | 2 BR (39%) | 5+ BR (3%) | 39 listings |
The Hidden Costs of Bedrooms: Why Revenue Isn't Profit
Higher revenue from larger properties comes with proportionally higher -- and sometimes disproportionately higher -- costs that erode the apparent advantage.
| Cost Category | 1 BR | 3 BR | 5+ BR |
|---|---|---|---|
| Avg Annual Revenue | $20,352 | $39,280 | $90,399 |
| Operating Costs (55%) | $11,194 | $21,604 | $49,720 |
| Furnishing (amortized 5yr) | $2,300 | $8,000 | $16,000 |
| Est. Net Operating Income | $6,858 | $9,676 | $24,679 |
The Investor's Bedroom Count Decision Framework
Choosing the best airbnb property size for revenue requires matching bedroom count to your specific market, budget, and guest persona. Here is the framework:
Step 1: Identify your market type.
- Urban (Denver, Austin): 2-3 bedrooms -- strong year-round demand, manageable operating costs
- Leisure (Gatlinburg, Destin): 3-5+ bedrooms -- family and group demand drives premium rates
- Luxury (Scottsdale, Miami Beach): 3-5+ bedrooms -- high ADR premiums reward scale
- Niche (Joshua Tree): 2-3 bedrooms for volume, 5+ for luxury boutique positioning
Step 3: Calculate revenue per bedroom for your target market. If 1-bedrooms earn $14,240/BR and 3-bedrooms earn $9,893/BR in Denver, the 1-bedroom is more capital-efficient -- but the 3-bedroom generates enough absolute revenue to service a mortgage.
Step 4: Factor acquisition cost. Compute gross yield (annual revenue / purchase price) for each bedroom tier. A $200K 2-bedroom generating $18,000/yr yields 9% gross. A $500K 4-bedroom generating $37,000/yr yields 7.4%. The smaller property wins on capital efficiency.
Frequently Asked Questions
The optimal Airbnb bedroom count depends on your market type. In urban markets like Denver and Austin, 2-3 bedroom properties deliver the best balance of revenue and capital efficiency. In leisure markets like Gatlinburg and Destin, 4-5+ bedroom properties generate premium returns because families and groups drive demand. AirROI data across 8 US markets shows 3-bedroom properties are the most consistent performers overall, generating $39,280 median annual revenue with moderate competition.
Bigger properties always generate higher total revenue -- a 5BR+ property averages $90,399 per year versus $20,352 for a 1BR across 8 US markets. But on a revenue-per-bedroom basis, 1-bedroom properties lead in 6 out of 8 markets analyzed by AirROI. Once you factor in acquisition costs that scale 3-5x, furnishing budgets of $60,000-$100,000+ for large properties, and higher operating expenses, the ROI advantage of bigger properties narrows considerably.
Revenue per bedroom divides a property's annual revenue by its bedroom count, normalizing performance across different property sizes. It matters because a $90,000-per-year 5-bedroom property generating $18,000 per bedroom may be less capital-efficient than a $40,000-per-year 2-bedroom generating $20,000 per bedroom -- especially when the 5-bedroom requires 3-4x higher acquisition cost. AirROI uses this metric to help investors compare apples to apples across property sizes.
Yes, but only modestly. AirROI data across 8 US markets shows occupancy declines from 51% for 1-bedroom properties to 45% for 5+ bedrooms -- a drop of just 6 percentage points. Revenue scaling between bedroom counts is driven almost entirely by higher nightly rates (ADR), not higher occupancy. A 5BR+ property in Scottsdale commands $1,015 per night versus $162 for a 1BR, making pricing strategy the dominant variable.
It depends on your market and risk tolerance. In Gatlinburg, two 3-bedroom cabins generate $86,668 combined versus $89,332 for one 5BR+ cabin -- nearly identical revenue but with diversified risk. Two smaller properties offer higher combined occupancy (48% vs 46%) and protection against single-property vacancy. One large property benefits from supply scarcity (5BR+ represents just 12% of Gatlinburg's listings) and lower per-unit management overhead. Use AirROI Atlas to compare supply density at each bedroom tier in your target market.