
How to Start an Airbnb Business in 2026: What the Data Says About Who Succeeds
More than 100 guides explain how to start an Airbnb business. They all say "research your market," "furnish nicely," and "price competitively." Not one of them shows you what that research actually looks like with real numbers. The median US Airbnb host earns $13,800 per year. The top quartile in Nashville earns $34,931. That gap is not luck -- it is three decisions made before a single night is listed: which market, which property type, and how much to actually budget for launch.
We analyzed AirROI data across 14 markets in 5 countries -- from Nashville to Lisbon, Joshua Tree to Medellin -- to build the guide we wish existed when we started. Every recommendation below is backed by specific numbers from 20M+ short-term rental listings. No "8 easy steps." Just what the data reveals about who succeeds and who burns through their savings before the first review is posted.
Supply Growth Is the Number You Are Not Checking
The single best predictor of whether a new Airbnb listing will reach profitability is not the market's average daily rate or even its occupancy rate. It is the supply growth rate -- how fast the number of active listings is increasing. A market can have strong demand, but if supply is growing faster, revenue per listing declines for everyone.
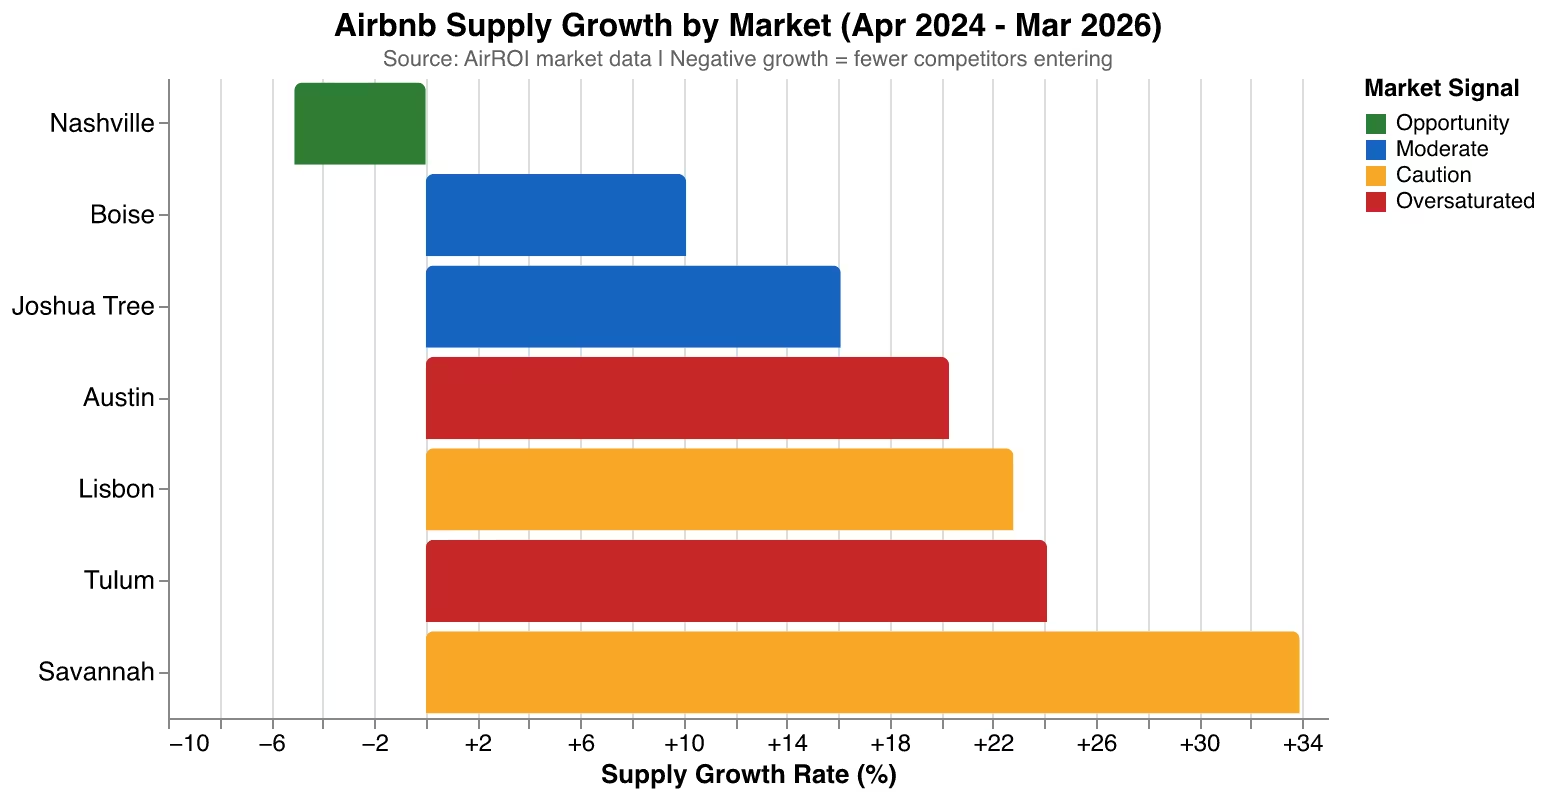
AirROI data from April 2024 to March 2026 tells a clear story across 14 markets:
| Market | Listings (Apr 2024) | Listings (Mar 2026) | Growth Rate | Signal |
|---|---|---|---|---|
| Nashville-Davidson, TN | 6,271 | 5,949 | -5.1% | Opportunity |
| Joshua Tree, CA | 1,064 | 1,235 | +16.1% | Moderate |
| Boise, ID | 1,198 | 1,319 | +10.1% | Moderate |
| Canmore, AB | -- | 1,867 | Stable | Strong market |
| Bend, OR | -- | 1,997 | Stable | Outdoor recreation |
| Savannah, GA | 1,942 | 2,600 | +33.9% | Caution |
| San Juan, PR | -- | 4,170 | Moderate | US territory |
| Austin, TX | 7,749 | 9,322 | +20.3% | Oversaturated |
| Kissimmee, FL | -- | 9,890 | Moderate | Theme park demand |
| Lisbon, Portugal | 11,393 | 13,995 | +22.8% | Caution |
| Tulum, Mexico | 6,451 | 8,002 | +24.1% | Oversaturated |
| Porto, Portugal | -- | 9,284 | Moderate | Low-cost entry |
| Medellin, Colombia | -- | 14,284 | High supply | Lowest revenue |
| Scottsdale, AZ | -- | 4,720 | Moderate | Luxury seasonal |
Nashville's supply dropped 5.1% over two years -- hosts are leaving, competition is thinning, and per-listing revenue is strengthening. Compare that to Austin, where 1,573 new listings flooded the market (+20.3%), pushing average occupancy down to 45%. Tulum tells an even starker story: supply surged 24.1% while occupancy collapsed to just 34%, meaning two-thirds of available nights go unbooked.
The actionable takeaway: before committing to any market, check its supply growth trend on AirROI Atlas. Markets growing supply faster than 15% annually without corresponding demand increases will compress your revenue.
Revenue by Property Type: What the Data Says to Buy
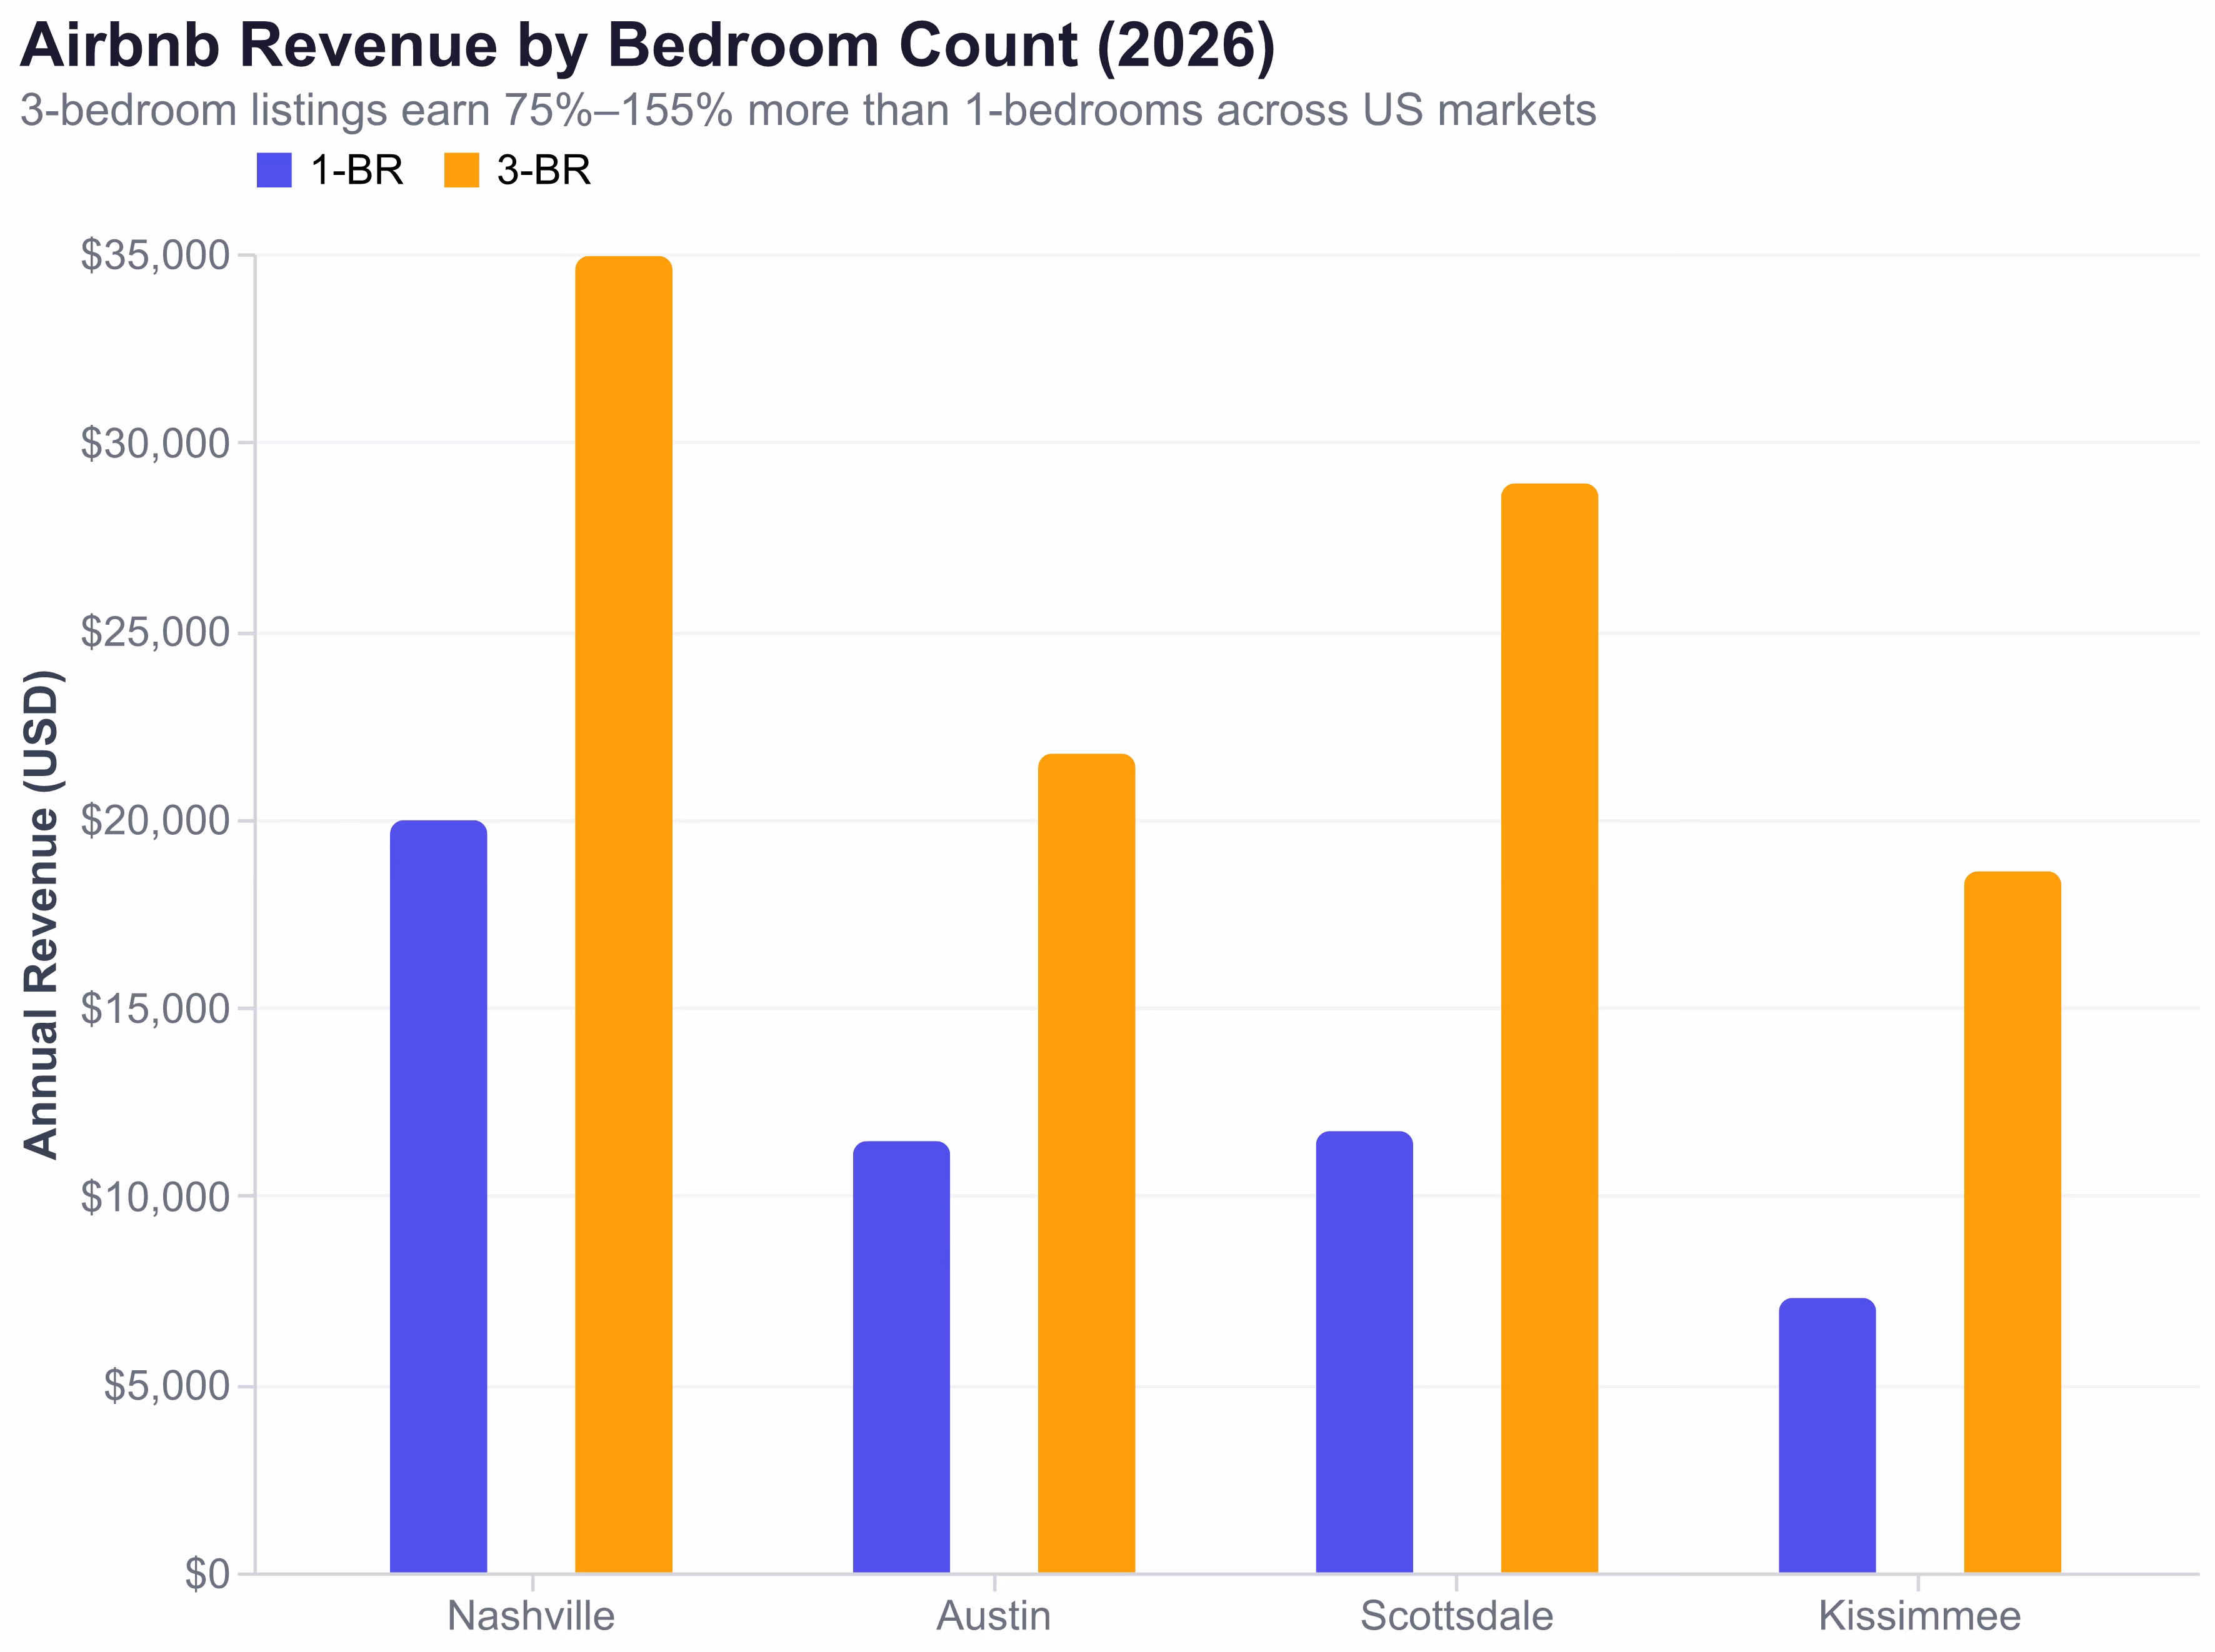
Three-bedroom entire homes earn 75-155% more annual revenue than 1-bedroom units across every US market in our dataset. The pattern holds whether the market is driven by tourism, events, or family travel -- and 3BRs face less competition in most cities.
In Nashville-Davidson, AirROI data shows 3-bedroom listings earn $34,931 annually -- 75% more than 1-bedroom listings at $19,961 -- while competing against 26% fewer active listings (1,341 vs. 1,814). The ADR gap is even wider: $368 per night for a 3BR versus $196 for a 1BR.
| Market | 1-BR Revenue | 3-BR Revenue | Premium | 1-BR Listings | 3-BR Listings |
|---|---|---|---|---|---|
| Nashville | $19,961 | $34,931 | +75% | 1,814 | 1,341 |
| Austin | $11,445 | $21,726 | +90% | 2,801 | 1,806 |
| Scottsdale | $11,711 | $28,898 | +147% | 796 | 950 |
| Kissimmee | $7,287 | $18,604 | +155% | 791 | 1,894 |
In Kissimmee's theme-park-driven market, the bedroom count effect is dramatic: a 5-bedroom property generates $31,153 annually versus $7,287 for a 1-bedroom -- a 4.3x multiplier. Each bedroom step adds roughly $6,000-$12,000 in annual revenue because Kissimmee's guest profile is families who need space.
Joshua Tree offers an interesting nuance. The 3BR earns $40,189 compared to $36,502 for a 2BR -- only a 10% premium. In niche, design-driven markets where the experience matters more than the bedroom count, the revenue gap narrows. A beautifully designed 2BR cabin can outperform a generic 3BR.
According to industry analysis, each additional bedroom adds $12,000 to $25,000 in annual revenue in strong markets, and hosts who optimize pricing monthly earn 40% or more than those who set rates once and forget them.
The exception to the "bigger is better" rule applies in expensive urban markets. A 1-bedroom condo in a city where median home prices exceed $500K may deliver better revenue per dollar invested than a 3-bedroom house -- even though the absolute revenue is lower. Match your bedroom count to the market's dominant guest profile: families need 3+, couples need 1-2, groups need 4+.
Know Your Revenue Ceiling Before You Sign Anything
Annual Airbnb revenue ranges from $10,540 in Medellin to $68,999 in Canmore -- a 6.5x spread across the 14 markets in our analysis. The most expensive mistake new hosts make is budgeting based on hope rather than data. Before purchasing or leasing any property, establish your revenue ceiling -- the realistic maximum that comparable listings in your target market actually earn.
AirROI data across 14 markets breaks down as follows:
| Market | Annual Revenue | ADR | Occupancy | Active Listings (avg/mo) |
|---|---|---|---|---|
| Canmore, AB | $68,999 | $335 | 63% | 1,867 |
| Joshua Tree, CA | $50,173 | $336 | 48% | 1,277 |
| Scottsdale, AZ | $47,693 | $424 | 49% | 4,720 |
| Nashville, TN | $44,651 | $356 | 47% | 6,763 |
| Savannah, GA | $39,067 | $311 | 48% | 2,605 |
| Bend, OR | $36,122 | $306 | 48% | 1,997 |
| Kissimmee, FL | $34,848 | $282 | 50% | 9,890 |
| San Juan, PR | $34,241 | $226 | 53% | 4,170 |
| Austin, TX | $29,690 | $300 | 45% | 9,978 |
| Lisbon, Portugal | $26,313 | $173 | 56% | 14,444 |
| Boise, ID | $25,327 | $189 | 53% | 1,391 |
| Porto, Portugal | $20,969 | $144 | 53% | 9,284 |
| Tulum, Mexico | $14,219 | $220 | 34% | 9,058 |
| Medellin, Colombia | $10,540 | $96 | 46% | 14,284 |
Several patterns emerge. Canmore dominates because it combines resort-level ADR ($335) with the highest occupancy in the dataset (63%) and limited supply (1,867 listings). That is the formula: strong pricing power plus high occupancy plus constrained competition.
Tulum serves as a cautionary tale. Its $220 ADR looks attractive on paper, but 34% occupancy means two-thirds of available nights go empty. The result: just $14,219 in annual revenue despite 9,058 active listings -- a market drowning in supply.
The True Startup Cost: A $15K-$25K Reality Check
"Most Airbnb startup cost guides underestimate by 30-50%. They mention furniture and forget the smart lock, professional photos, initial supplies, and the dozen other things needed before going live." -- STR Numbers analysis, 2026
A typical 2-bedroom Airbnb costs $15,000 to $25,000 to launch from scratch. Studios and 1-bedrooms start at $8,000 to $15,000. Here is where the money goes:
| Category | Cost Range | Notes |
|---|---|---|
| Furnishing & decor | $8,000-$15,000 | 70-80% of total; quality matters for reviews and ADR |
| Professional photography | $200-$500 | Professional photos increase bookings by up to 40% |
| Smart locks & tech | $500-$1,000 | Keyless entry, WiFi upgrade, smart thermostat |
| Initial supplies | $500-$1,000 | Linens, towels, kitchen essentials, toiletries |
| Insurance (STR-specific) | $800-$2,000/year | Standard homeowner's insurance does not cover STR activity |
| Permits & licenses | $50-$500 | Varies dramatically by city; some require annual renewal |
| Safety equipment | $150-$300 | Fire extinguishers, CO detectors, first aid kit |
| Extra linen sets | $300-$600 | You need 2-3 sets per bed for turnover efficiency |
| Operating reserve | $1,500-$3,000 | First 1-2 months of mortgage/rent before revenue starts |
| Total (2BR) | $12,000-$24,400 | Budget $15K-$25K to account for overruns |
International markets offer dramatically lower entry costs. In Porto, Portugal, furnishing a 1-bedroom apartment runs approximately EUR 8,000 ($8,800). In Medellin, Colombia, complete furnishing can cost under $5,000. Combined with property prices 50-70% below US markets, international entry may deliver superior gross yields despite lower absolute revenue.
Price Correctly From Day One
Pricing your listing 10-15% below market median for the first 30-60 days generates the initial bookings and reviews that determine your long-term search ranking. This matters more than ever because Airbnb has significantly weakened or eliminated the new listing boost -- the algorithm feature that previously gave new listings 30 days of elevated search visibility. According to Homesberg's analysis of the 2025-2026 algorithm changes, new listings now start with a baseline trust score and must earn increased visibility through demonstrated performance.
This shift makes your first 30-60 days critical. The strategy:
- Research comps before you list. Pull comparable listings in your market from AirROI Atlas -- same bedroom count, similar location, similar amenities. Note their ADR and occupancy.
- Launch 10-15% below market median. The goal in your first month is not maximum revenue -- it is generating bookings and reviews. Five-star reviews compound: each one increases your search ranking and conversion rate.
- Enable Instant Book. Airbnb's algorithm favors listings with frictionless booking. New hosts who enable Instant Book see faster initial traction.
- Raise rates after 5+ reviews. Once you have a review base, gradually increase to market rate. Hosts who reach market-rate pricing by month 3-4 outperform those who start high and sit empty.
- Adopt dynamic pricing. Hosts who adjust rates monthly based on demand, seasonality, and local events earn 40%+ more than set-and-forget hosts. See our ADR pricing strategy guide for a detailed framework.
Month-by-Month: What Your First Year Actually Looks Like
New Airbnb listings take 6 to 12 months to reach consistent monthly profitability. Here is a realistic timeline based on market data and host experiences:
| Period | Occupancy | Revenue (2BR, avg market) | Cash Flow Status |
|---|---|---|---|
| Month 1-2 | 0-15% | $0-$500 | Negative: startup costs + mortgage |
| Month 3-4 | 25-35% | $800-$1,500 | Negative: building reviews, below-market pricing |
| Month 5-6 | 40-45% | $1,500-$2,200 | Near breakeven on monthly costs |
| Month 7-9 | 45-55% | $2,000-$3,000 | Cash-flow positive (before accounting for startup costs) |
| Month 10-12 | Market average (45-55%) | $2,000-$3,500 | Consistent profitability; seasonal patterns emerge |
Budget for 3 to 6 months of negative cash flow before your listing generates enough bookings to cover monthly expenses. The timeline accelerates in high-occupancy markets: Canmore (63% occupancy) and Lisbon (56%) reach sustainable booking velocity faster than Tulum (34%) or Austin (45%).
Seasonality will surprise you. A host who launches in January in a summer-driven market may see 15% occupancy for months and panic. That is normal. AirROI data on booking lead times helps set expectations: Kissimmee guests book an average of 62 days ahead, while Austin guests book just 38 days ahead. Knowing your market's booking window prevents the "why am I empty?" anxiety that causes new hosts to slash rates prematurely.
The hosts who thrive in Year 1 share three traits: they budgeted conservatively, they priced for bookings (not ego), and they used comparable data to set expectations rather than aspirations. Consider building a cash reserve equal to at least 4 months of mortgage or rent payments before launching -- this buffer prevents the desperation pricing that traps undercapitalized hosts in a low-rate spiral.
The Markets With the Best Entry Points in 2026
The best entry markets in 2026 combine three signals: occupancy above 50%, supply growth below 15%, and revenue that covers typical startup costs within 12 months. Based on AirROI data, six markets stand out:
Nashville-Davidson, TN -- Supply declined 5.1% while the market generates $44,651 in median annual revenue. Hosts are leaving the market, creating openings for well-run properties. The 3BR sweet spot ($34,931 revenue) benefits from Nashville's year-round tourism and event demand.
Joshua Tree, CA -- Supply growth is stabilizing after years of rapid expansion. The market generates $50,173 in annual revenue with a design-driven guest profile that rewards unique properties. Its 1,277 active listings keep competition manageable.
Boise, ID -- At 53% occupancy with 10.1% supply growth, Boise is emerging without the saturation pressure of larger markets. Median revenue of $25,327 is lower, but entry costs are proportionally cheaper, and the supply-to-demand ratio remains healthy with just 1,391 active listings.
San Juan, PR -- As a US territory, San Juan requires no passport and offers Act 60 tax incentives. At 53% occupancy and $34,241 annual revenue with 4,170 listings, it combines beach-market appeal with regulatory accessibility.
Porto, Portugal -- For international investors, Porto delivers $20,969 annual revenue with 53% occupancy at dramatically lower property costs. A 1-bedroom in Porto's historic center can be acquired and furnished for under EUR 160K total -- yielding gross returns that most US markets cannot match.
Canmore, Alberta -- The highest-revenue market in our dataset at $68,999, driven by 63% occupancy and proximity to Banff National Park. Entry costs are higher (Canadian mountain resort pricing), but the revenue ceiling justifies premium investment.
Starting an Airbnb business in 2026 is not about following a generic checklist. It is about making three data-informed decisions -- market, property type, and budget -- before you spend a dollar. The hosts who treat those decisions as data problems, not gut-feel gambles, are the ones earning $45K-$69K annually instead of the $13,800 median.
Every number in this guide came from AirROI data that you can access yourself. Research your target market's supply growth. Run your specific property through the revenue calculator. Compare your startup budget against the realistic ranges above. Then decide.
Frequently Asked Questions
A typical 2-bedroom Airbnb costs $15,000 to $25,000 to launch, including furnishing ($8,000-$15,000), professional photography ($200-$500), smart locks and technology ($500-$1,000), initial supplies, insurance ($800-$2,000/year), and permits. Studios and 1-bedrooms can start for $8,000-$15,000. Most published startup guides underestimate true costs by 30-50%.
Most new Airbnb listings take 6 to 12 months to reach consistent profitability. Markets with occupancy rates above 50% -- such as Canmore at 63%, Lisbon at 56%, and Boise at 53% -- reach breakeven faster. Budget for 3 to 6 months of negative cash flow before your listing generates enough bookings to cover monthly expenses.
Markets with stable or declining supply growth combined with strong demand offer the best opportunity. AirROI data highlights Nashville (-5.1% supply growth, $44,651 revenue), Joshua Tree (supply stabilizing, $50,173 revenue), Boise (+10.1% growth, 53% occupancy), and San Juan, PR (53% occupancy, US territory with tax advantages).
Three-bedroom entire homes deliver the best revenue-to-investment ratio in most US markets. In Nashville, 3-bedroom listings earn $34,931 annually versus $19,961 for 1-bedrooms -- a 75% premium. In Kissimmee, 5-bedroom properties earn 4.3 times more than 1-bedrooms ($31,153 vs. $7,287), reflecting the family travel market's demand for space.
Yes, but only with data-driven market selection and realistic expectations. The median US Airbnb host earns $13,800 per year, while top performers in strong markets earn $45,000 to $69,000. Success in 2026 depends on choosing markets where supply growth is stable or declining, selecting the right property type, and pricing competitively from day one.