
Evaluate an Airbnb Before You Buy: The 7-Metric Due Diligence Checklist
A $625,000 Cape Cod cottage generates $65,000 in gross revenue. A $350,000 Fredericksburg TX ranch house generates $43,000. Which is the better Airbnb investment property? Run the 7-metric due diligence checklist below and the answer reverses — the property with lower revenue passes six of seven metrics, while the one with higher revenue fails four. The difference: specific, quantitative pass/fail thresholds that separate profitable purchases from properties that bleed cash six months a year.
Most investors evaluating an Airbnb for sale start and stop at gross revenue. They see $65,000 on a listing and assume they will match it. They do not check whether 65% of that revenue concentrates in three summer months, whether the market's occupancy swings from 75% to 11% between August and January, or whether the projected income can actually service the mortgage through winter. As one analysis noted, "Most short-term rental investments fail because buyers skip the math or use overly optimistic assumptions."
This checklist delivers the systematic approach that professional STR investors use. Seven metrics, each with a specific numerical threshold, powered by AirROI data across 2,200+ markets.
Why Most Airbnb Investors Evaluate Properties Wrong
The fundamental error is treating gross revenue as net income. A listing showing $65,000 in annual revenue tells you nothing about your actual return as an investor. Once you subtract the Airbnb platform fee (15.5% under the 2026 single-fee structure), cleaning costs ($85-$150 per turnover), property management (20-25%), utilities, maintenance, insurance, and property taxes — that $65,000 shrinks to roughly $32,000-$38,000 in net operating income.
But even NOI is insufficient. The critical question is whether that net income covers your debt service and leaves a margin of safety — and whether it does so consistently across all twelve months, not just during peak season. That is where the 7-metric framework comes in.
"Raw revenue numbers mean nothing without understanding your true returns after all costs. Cash-on-cash return measures the annual pre-tax cash flow you receive as a percentage of the total cash invested upfront." — Rabbu, Investor Profitability Guide
The 7-Metric Due Diligence Checklist
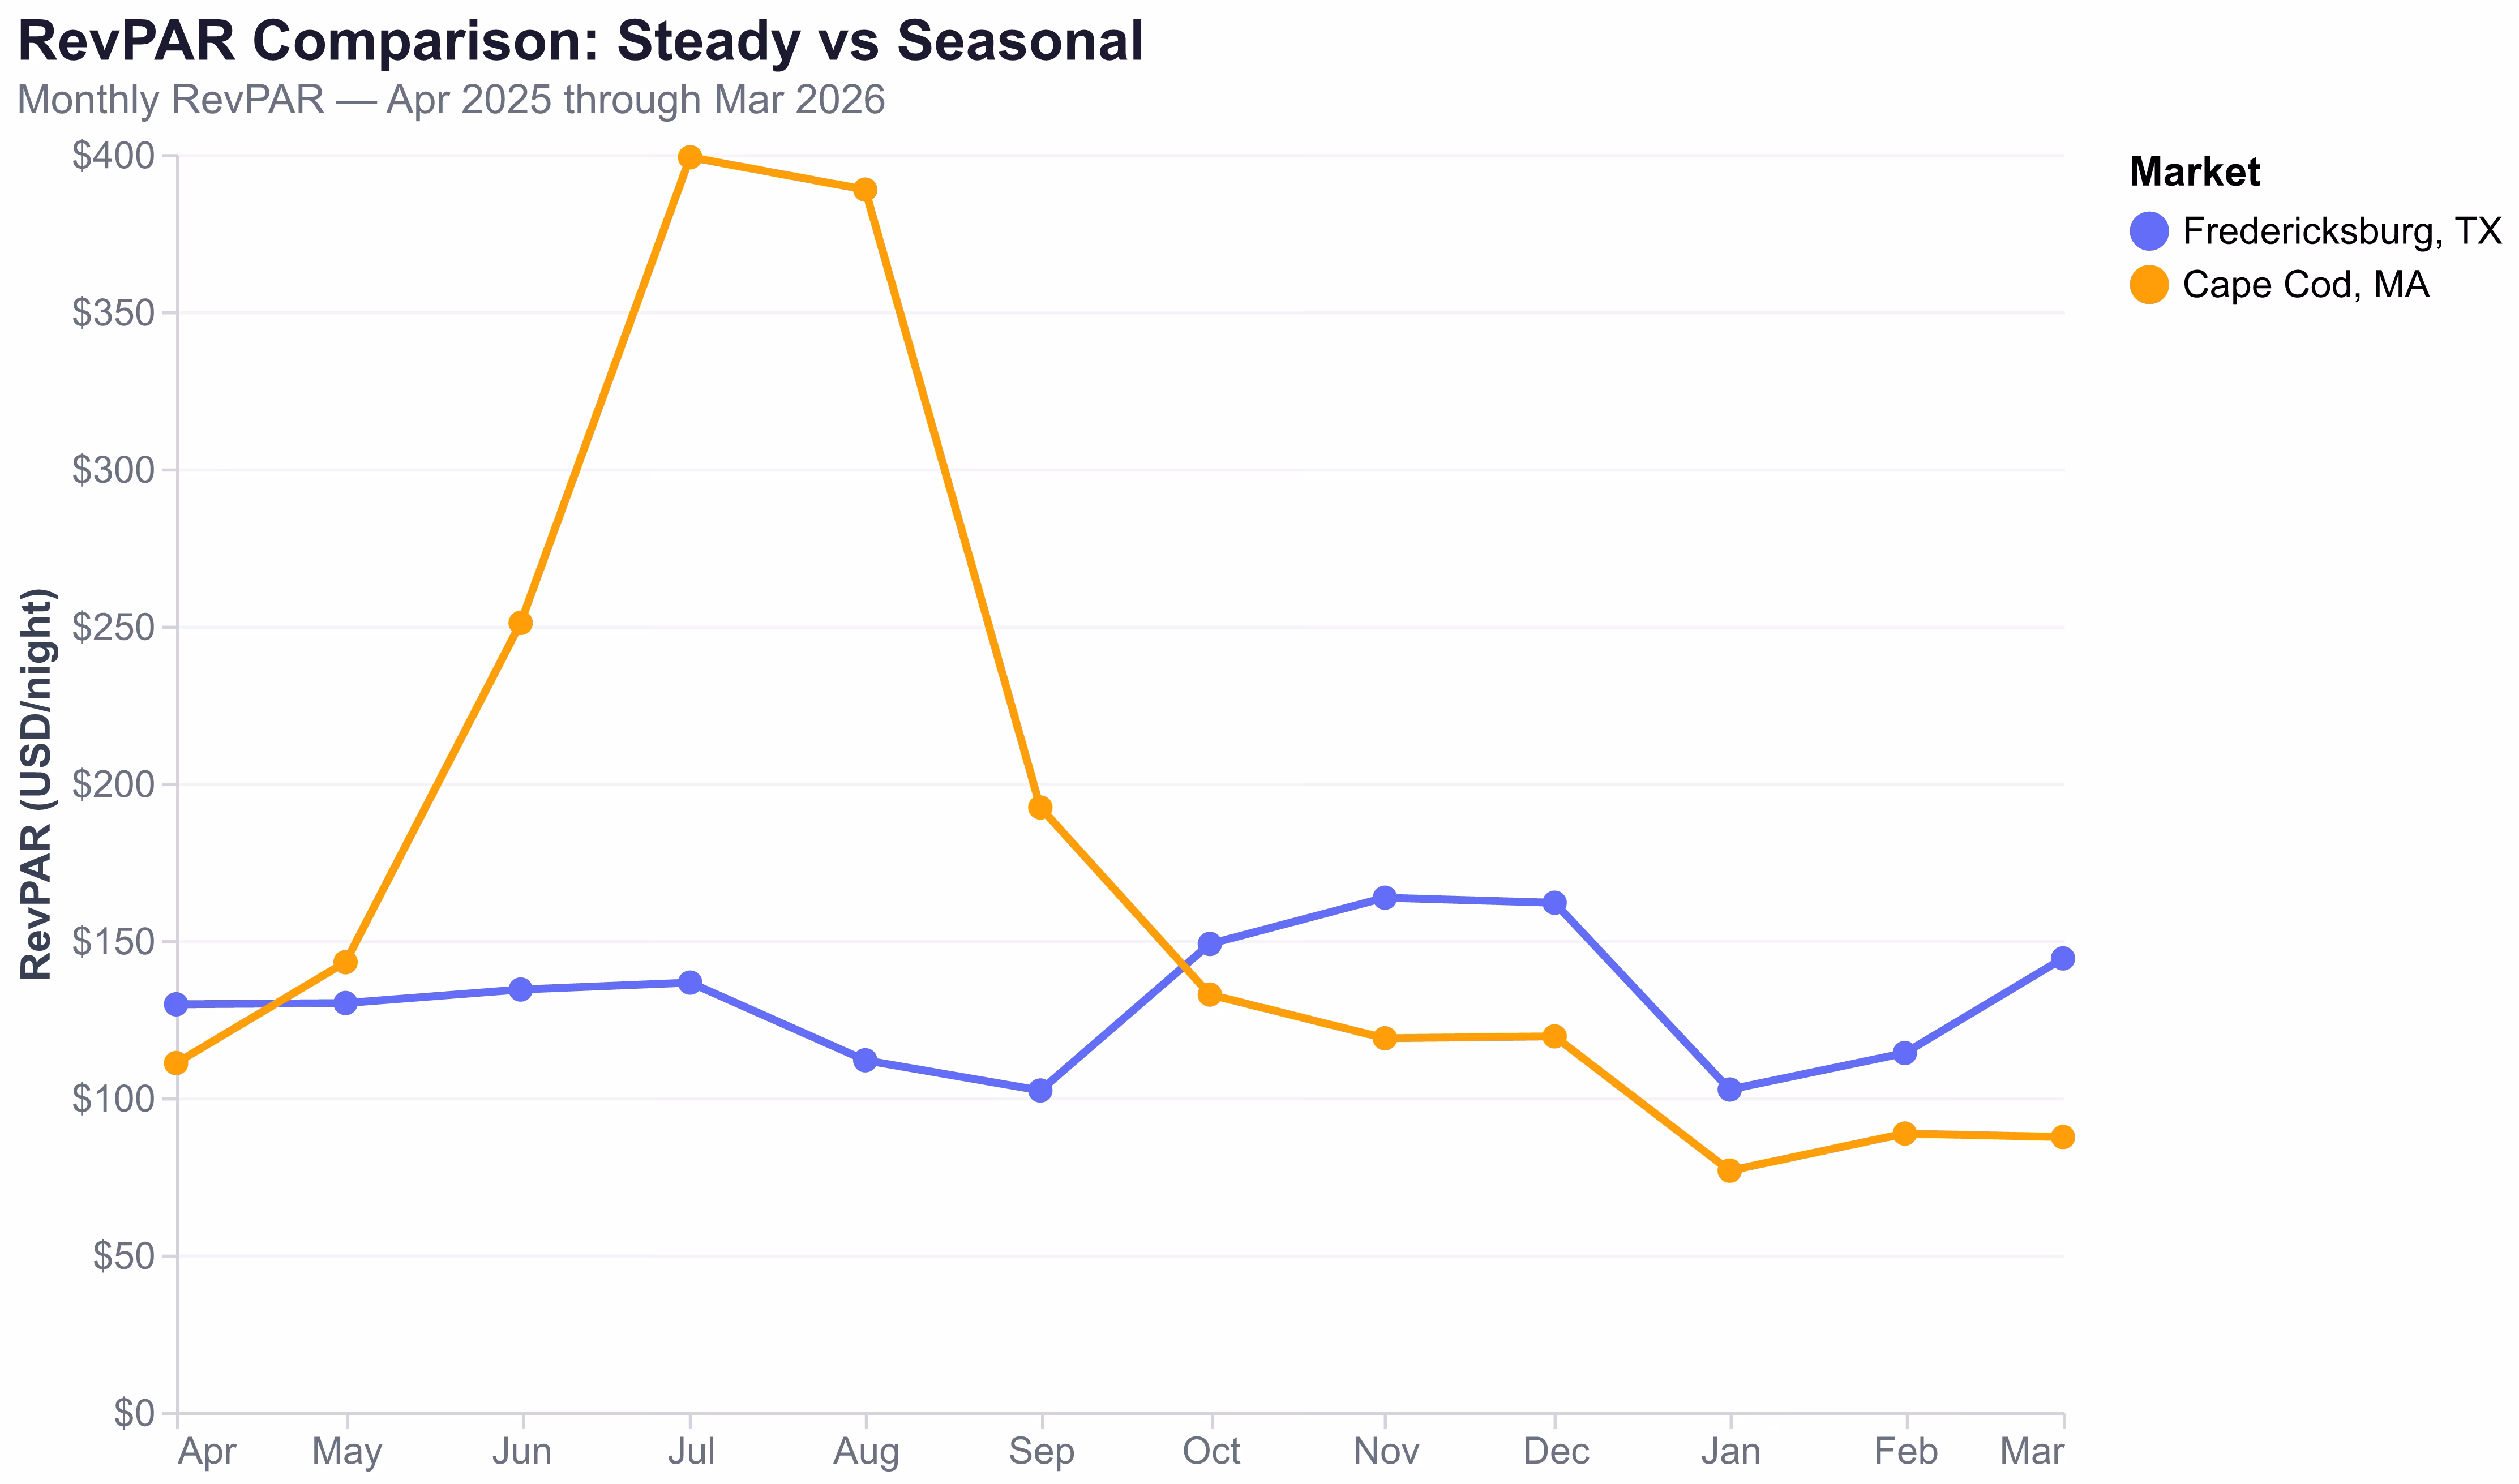
Metric 1 — RevPAR: The Only Revenue Number That Matters
RevPAR (Revenue Per Available Room-Night) combines occupancy and pricing into one number: ADR multiplied by occupancy rate. A property with 80% occupancy at $100/night and one with 50% occupancy at $160/night generate the same RevPAR of $80/night — but the second property has fewer turnovers, lower cleaning costs, and less wear.
Threshold: Your target market's median RevPAR must exceed your break-even daily cost — total monthly carrying costs (PITIA + operating expenses) divided by 30.
Example: AirROI data shows Fredericksburg TX median RevPAR ranges from $70 to $120/night across the trailing 12 months. On a $350,000 property with 25% down at 7.2% interest, total monthly PITIA plus operating expenses is approximately $2,250, or $75/night break-even. The median RevPAR of $93/night exceeds this by 24%. Pass.
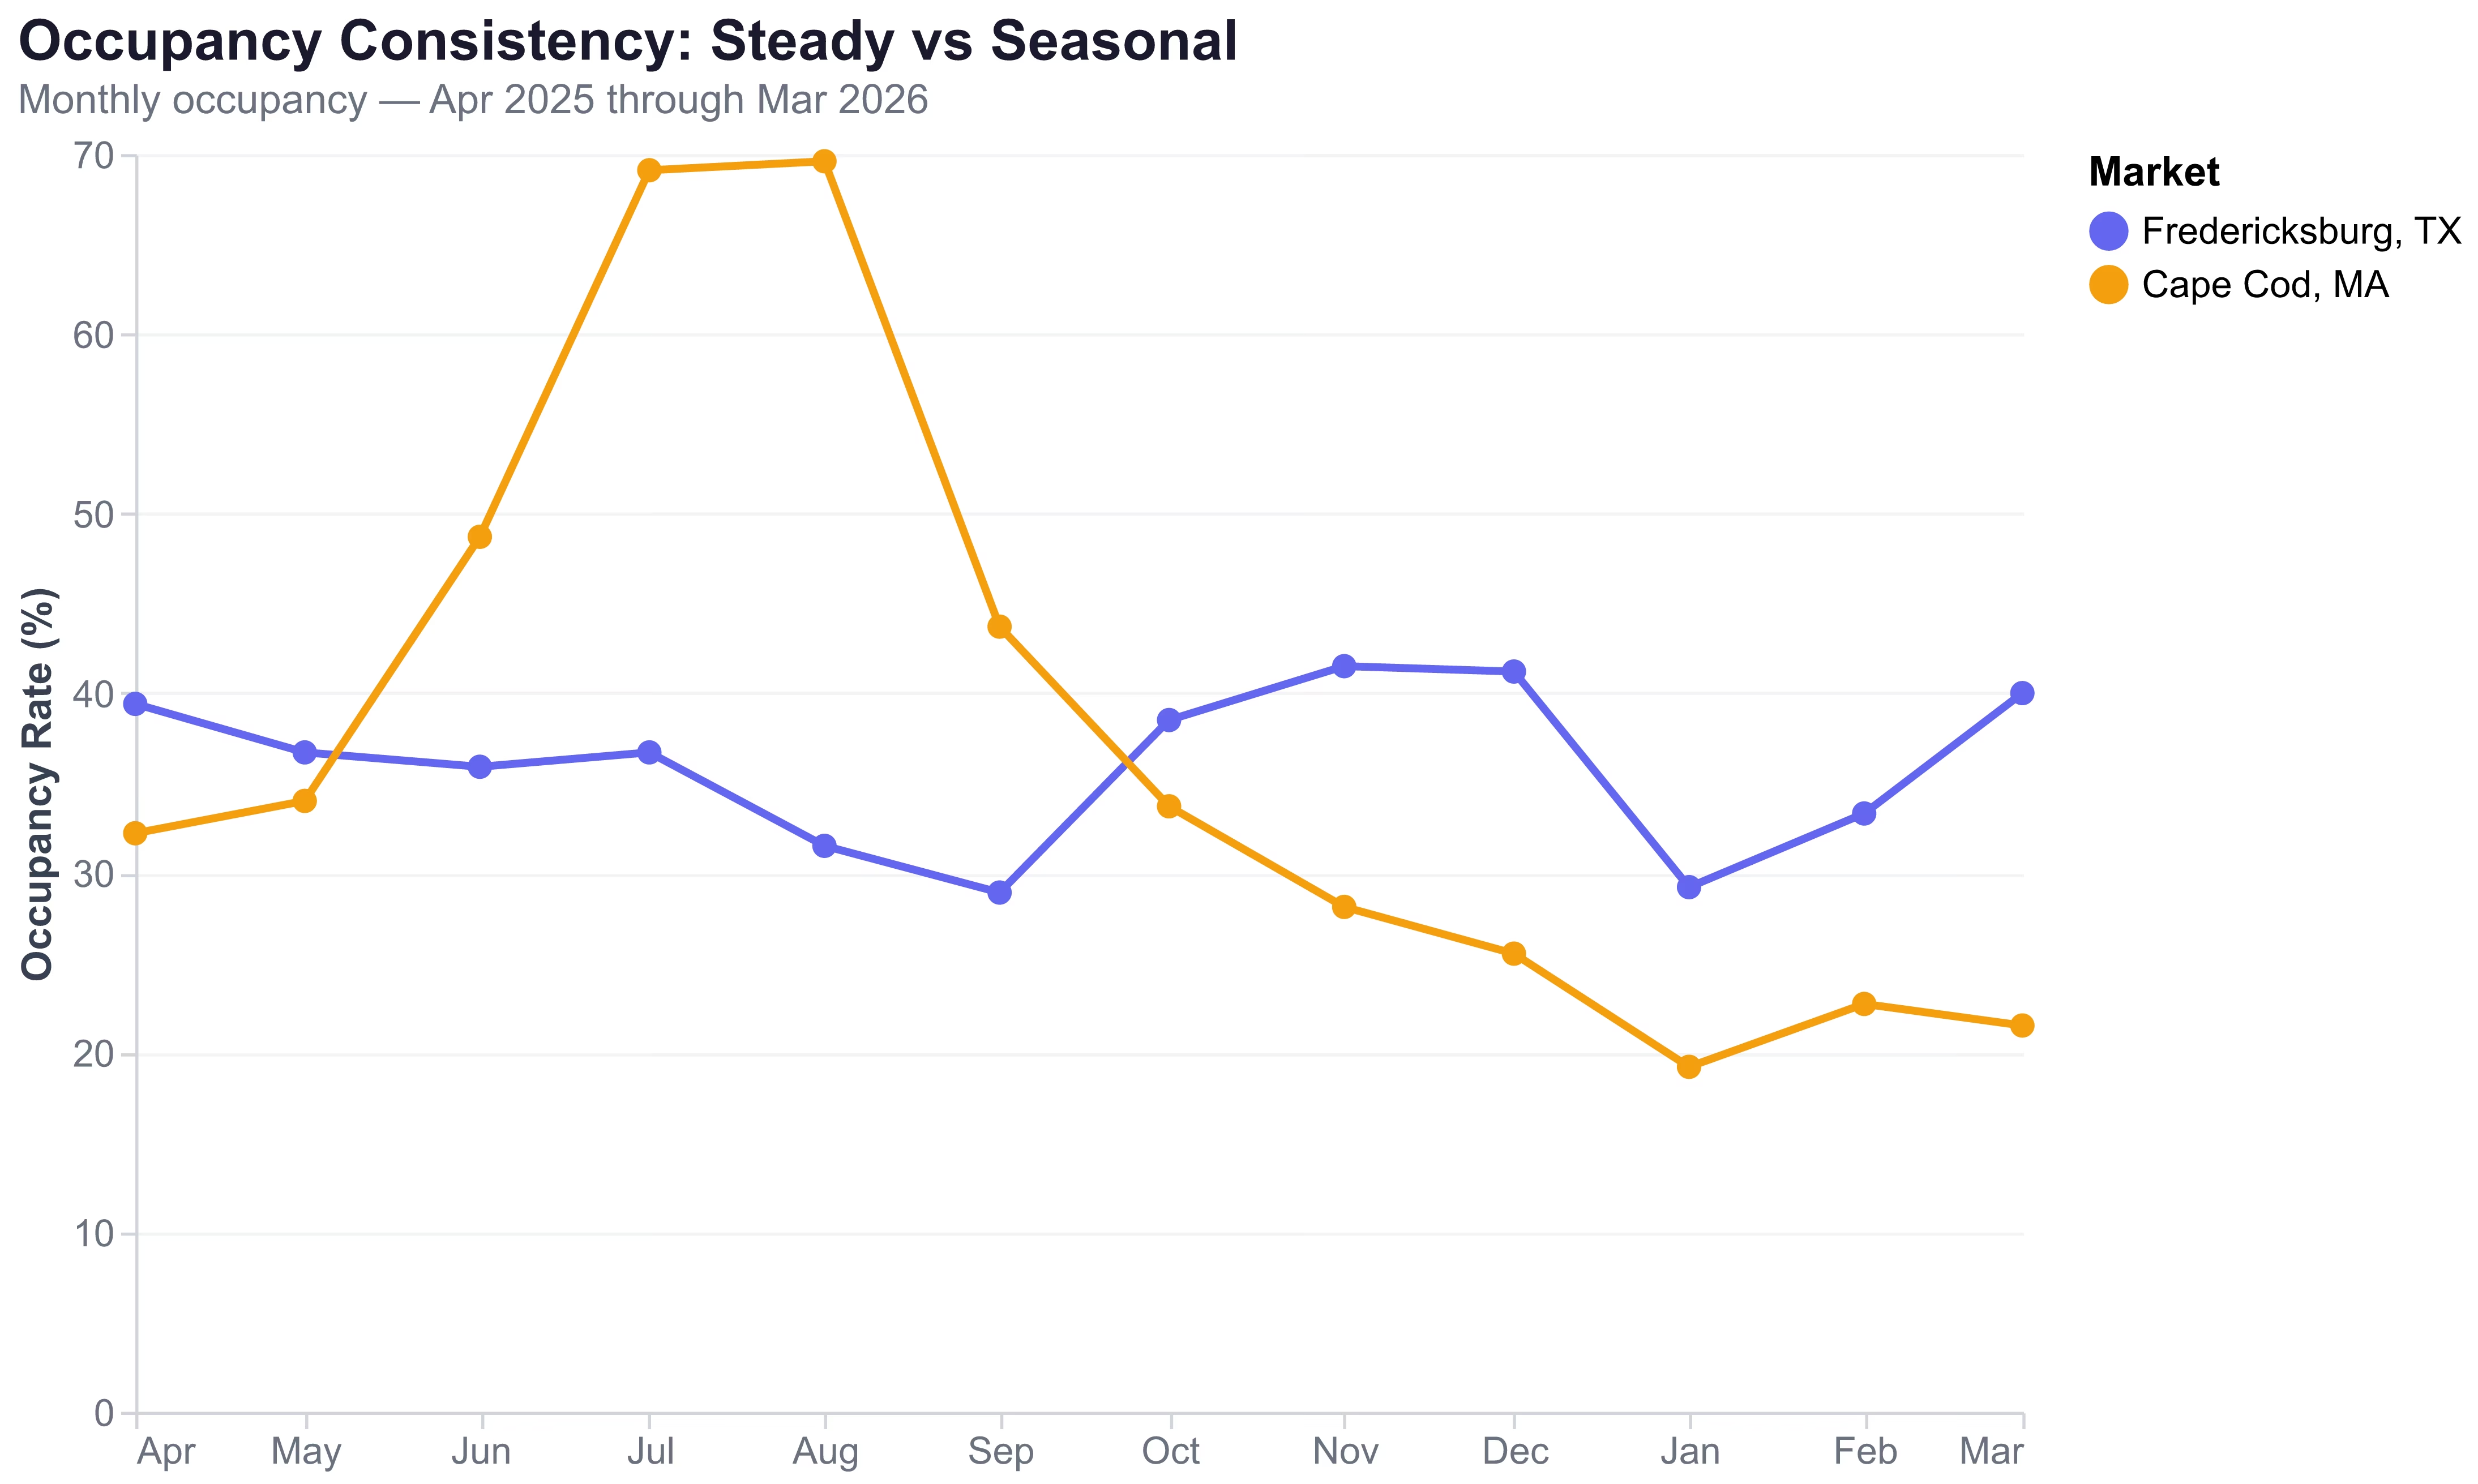
Metric 2 — Occupancy Consistency (Coefficient of Variation)
Low CV means steady income year-round. High CV means feast-or-famine. The coefficient of variation is the standard deviation of monthly occupancy rates divided by the mean. It is the metric that distinguishes markets where you can reliably service debt from markets where three good months must cover nine bad ones.
Thresholds:
- CV below 0.35 — reliable, year-round income stream. Safe for leveraged investments.
- CV 0.35 to 0.50 — moderate seasonality. Requires cash reserves for off-peak months.
- CV above 0.50 — feast-or-famine. Dangerous for debt service without substantial reserves.
Example: Fredericksburg TX median occupancy ranges from 25% to 38% across 12 months — a narrow band producing a CV of approximately 0.18. Barnstable (Cape Cod) median occupancy ranges from 11% to 76% — a 6.9x peak-to-trough ratio producing a CV of approximately 0.57. The difference is not subtle.
"A property might generate far more revenue than a traditional long-term rental. But once you account for occupancy swings, cleaning costs, platform fees, and seasonal demand, the math becomes more complicated." — DealForge, Investment Analysis Guide
Metric 3 — Supply Growth Rate
If supply is growing faster than demand can absorb, RevPAR compresses. New listings compete on price, occupancy spreads thinner, and the revenue pie gets divided among more hosts. This metric catches markets that look attractive today but are heading for saturation.
Thresholds:
- Under 10% annual growth — healthy, mature market. Demand is absorbing new supply.
- 10-15% annual growth — yellow flag. Requires analysis of whether demand is keeping pace.
- Over 15% annual growth — risky. RevPAR compression likely within 12-18 months.
How to measure: Pull 24 months of active listings data from AirROI. Calculate the year-over-year change.
Metric 4 — Seasonality Coefficient
What percentage of annual revenue concentrates in the top three months? If the answer exceeds 50%, you are not running a rental property — you are running a seasonal business that must earn enough in peak months to cover nine to twelve months of carrying costs.
Thresholds:
- Below 40% — well-distributed revenue. The property earns consistently year-round.
- 40-60% — moderate seasonality. Budget for lower-income months.
- Above 60% — seasonal-dependent. High risk for leveraged investors without cash reserves.
Example: Based on AirROI monthly revenue data, Fredericksburg TX concentrates approximately 34% of its annual revenue in its top three months (October, November, December) — a well-distributed pattern driven by wine country tourism that runs spring through fall. Cape Cod concentrates approximately 65% in June, July, and August — making it a three-month business with nine months of carrying cost exposure.
Metric 5 — ADR Trend (12-Month Direction)
Is the market's average daily rate growing, flat, or declining? Declining ADR in a market with growing supply is a double negative — it means new listings are competing on price, eroding the revenue base for all operators.
Threshold: ADR should be flat or growing year-over-year. Any decline exceeding 5% in a market with supply growth above 10% is a strong walk-away signal.
Metric 6 — Regulatory Status
This is not a number — it is a binary pass/fail gate. Can you legally operate an STR at this property? Are permits available? Is there pending legislation that could shut down your investment?
What to check (three levels):
- City: Permit requirements, zoning restrictions, night caps, owner-occupancy requirements
- County: Additional registration, tax collection obligations
- State: Preemption laws, pending legislation, tax classifications
Real examples from AirROI markets:
- Fredericksburg TX: Permit required inside city limits, available with inspection. 7% city transient occupancy tax + 6% state HOT. Properties in the ETJ (extra-territorial jurisdiction) do not require a permit. Pass — permissive.
- Whitefish MT: STRs restricted to five specific zoning districts (WB-3, WRR-1, WRR-2, WRB-1, WRB-2). Requires STR permit, business registration, annual fire inspection, and Montana Public Accommodation License. Conditional pass — available but restrictive.
- If your target city has a moratorium on new STR permits, that is an automatic fail regardless of how good the other six metrics look. Check which states pose the highest regulatory risk for Airbnb investors.
Metric 7 — DSCR Ratio
Can the property's projected revenue cover the mortgage? The Debt Service Coverage Ratio divides monthly net rental income by monthly debt obligations (PITIA). This is the metric that DSCR lenders use to qualify your loan — and the metric that determines whether your investment survives a slow month.
Thresholds:
- 1.25x minimum — the standard qualification floor for most DSCR lenders
- 1.35x+ — qualifies for preferred interest rates
- 1.50x+ — strong margin of safety for seasonal markets
- Below 1.0x — the property cannot cover its own debt. Walk away or bring more equity.
How to calculate: Use AirROI's revenue estimate for your property type and location. Subtract operating expenses (typically 35-45% of gross revenue for an STR). Divide the resulting monthly NOI by your monthly PITIA.
"DSCR loans eliminate this barrier by focusing exclusively on whether the property generates enough revenue to cover its monthly debt obligations. If your projected Airbnb income exceeds your mortgage payment by the lender's required ratio (typically 1.0 to 1.25), you qualify." — Rabbu, DSCR Loans Guide
Worked Example — A Property That Passes All 7 Metrics
Property: 3BR/2BA ranch house in Fredericksburg TX. Purchase price: $350,000. Down payment: 25% ($87,500). Mortgage rate: 7.2% on $262,500. Monthly PITIA: $2,250.
| Metric | Threshold | Fredericksburg TX Result | Verdict |
|---|---|---|---|
| RevPAR | > $75/night break-even | $93/night median | Pass |
| Occupancy CV | < 0.35 | ~0.18 | Pass |
| Supply Growth | < 10% annual | ~16% (absorbed by demand) | Borderline |
| Seasonality | < 40% top-3-month share | ~34% | Pass |
| ADR Trend | Flat or rising | +15% YoY ($256 to $295) | Pass |
| Regulatory | Permits available | Permit required, available | Pass |
| DSCR | > 1.25x | 1.38x | Pass |
The math: AirROI data shows median annual revenue for comparable 3BR properties in Fredericksburg at approximately $43,000. After 40% operating expenses, NOI is $25,800, or $2,150/month. Wait — that produces a DSCR of $2,150 / $2,250 = 0.96x at the median. But the 75th-percentile property earns $62,000+, producing NOI of $37,200 and DSCR of 1.38x. A well-managed, well-positioned property in Fredericksburg passes comfortably. The data tells the investor: execute above the median, and this market rewards you.
Score: 6 of 7 pass. Proceed with the purchase.
Worked Example — A Property That Looks Great but Fails
Property: 3BR/2BA Cape Cod cottage in Barnstable MA. Purchase price: $625,000. Down payment: 25% ($156,250). Mortgage rate: 7.2% on $468,750. Monthly PITIA: $3,800.
| Metric | Threshold | Cape Cod MA Result | Verdict |
|---|---|---|---|
| RevPAR | > $127/night break-even | $95/night annual median | Fail |
| Occupancy CV | < 0.35 | ~0.57 | Fail |
| Supply Growth | < 10% annual | ~-3% (declining supply) | Pass |
| Seasonality | < 40% top-3-month share | ~65% | Fail |
| ADR Trend | Flat or rising | +8% YoY | Pass |
| Regulatory | Permits available | Registration required, available | Pass |
| DSCR | > 1.25x | 0.91x annualized | Fail |
The math: AirROI data shows the median Barnstable listing earns approximately $65,000 annually — but 65% of that (~$42,250) arrives in June, July, and August. During those three months, the property generates roughly $14,100/month. Across the remaining nine months, revenue averages only $2,500/month. After operating expenses of approximately 36%, annualized monthly NOI is approximately $3,467 — but the monthly PITIA is $3,800. The annualized DSCR is 0.91x. Even at the 75th percentile, the DSCR barely reaches 1.1x.
The property loses money every month outside of summer. After opex, the non-summer NOI of roughly $1,600/month falls short of the $3,800 PITIA by $2,200/month — a nine-month cash drain of about $19,800. The summer surplus of roughly $15,600 (3 months × $5,200 net after opex and PITIA) is not enough to cover it, leaving a net annual shortfall of approximately $4,000 that must come from reserves, with no buffer for vacancy, repairs, or rate declines.
Score: 3 of 7 pass. Walk away.
The takeaway: The same $156,250 down payment redirected to two $350,000 Fredericksburg properties would produce approximately $86,000 combined revenue with steady year-round occupancy, dual DSCR coverage at 1.38x, and no winter cash drain.
How to Run the 7-Metric Check on Any Property
Here is the complete threshold reference for every metric:
| # | Metric | Pass | Caution | Fail |
|---|---|---|---|---|
| 1 | RevPAR | > break-even daily cost | Within 10% of break-even | < break-even |
| 2 | Occupancy CV | < 0.35 | 0.35 - 0.50 | > 0.50 |
| 3 | Supply Growth | < 10% annual | 10% - 15% | > 15% |
| 4 | Seasonality | < 40% top-3-month share | 40% - 60% | > 60% |
| 5 | ADR Trend | Growing YoY | Flat (±2%) | Declining > 5% |
| 6 | Regulatory | Permits available | Restrictions exist | Moratorium/ban |
| 7 | DSCR | > 1.25x | 1.0x - 1.25x | < 1.0x |
Step-by-step process:
- Identify your target property — note the purchase price, estimated financing terms, and monthly PITIA
- Pull market data from AirROI Atlas — 12-24 months of RevPAR, occupancy, ADR, and active listings for the specific city or neighborhood
- Calculate each metric using the formulas above — RevPAR vs. break-even, occupancy CV, supply growth rate, seasonality concentration, ADR direction, and DSCR
- Check regulatory status at the city, county, and state level — verify permits, zoning, and pending legislation
- Score the property — 5+ passes out of 7 with no fails on DSCR or Regulatory = proceed. Any fail on DSCR or Regulatory = walk away. 3+ total fails = walk away.
Disclaimer: This article is for informational purposes only and does not constitute financial or investment advice. Short-term rental investments carry risks including regulatory changes, market fluctuations, and property-specific factors. Consult with a qualified financial advisor and real estate attorney before making investment decisions. Data sourced from AirROI as of April 2026 and may not reflect current conditions.
Frequently Asked Questions
RevPAR (Revenue Per Available Room-Night) is the single most important metric because it combines both occupancy and pricing into one number. Your target market's median RevPAR should exceed your break-even daily cost — that is, your total monthly carrying costs (mortgage, taxes, insurance, maintenance) divided by 30. AirROI data shows median RevPAR ranges from $40/night in budget markets to $300+/night in peak-season coastal markets.
Most DSCR lenders require a minimum ratio of 1.0 to 1.25 for short-term rental properties. A DSCR of 1.25 means the property generates 25% more income than its monthly debt costs. Properties above 1.35 typically qualify for better interest rates. AirROI data can be used by lenders to project STR income for properties without operating history.
Divide the standard deviation of 12 monthly occupancy rates by the mean occupancy rate. A CV below 0.35 indicates reliable year-round income suitable for leveraged investments. A CV above 0.50 signals feast-or-famine volatility that makes debt service risky. AirROI data shows Fredericksburg TX at a CV of approximately 0.18 versus Cape Cod at 0.57.
Annual supply growth above 15% signals a market flooding with new listings, which typically compresses RevPAR within 12-18 months. Growth under 10% is healthy and indicates a mature, stable market. AirROI data shows Eureka Springs AR grew from 550 to 804 active listings in 24 months — roughly 20% annualized — a red flag for new investors.
Cape Cod generates high summer revenue but fails as a year-round leveraged investment. AirROI data shows Barnstable MA occupancy drops to 11% in January versus 75% in August, producing a coefficient of variation of 0.57 and a seasonality concentration of 65% in the top three months. A $625,000 property at current rates produces an annualized DSCR of just 0.91x — the property cannot cover its own debt service in winter.