
Worst States for Airbnb Investing 2026: AirROI Data Reveals a More Nuanced Picture
TurboTenant's report captures real regulatory challenges. But ranking states by regulatory burden and cost of entry alone tells an incomplete story. AirROI data across 10 US markets adds the missing layer -- actual STR performance data -- and reveals that some of the most regulated states contain the country's highest-earning short-term rental markets, while states with low barriers can still produce mediocre returns when oversupply compresses rates.
The Viral List: What TurboTenant Measured (and What They Missed)
TurboTenant's methodology considers real factors: regulatory complexity, permit requirements, home prices relative to nightly rates, HOA restrictions, insurance costs, and local sentiment toward STRs. According to the report, "starting an Airbnb in one of the country's worst states can turn an already unpredictable scenario into a losing battle." The typical Airbnb host earned an estimated $14,000 in 2023, per Airbnb's own data -- a number that underscores how tight margins already are before regulatory costs layer on.
Their five "worst" states, ranked:
- New York -- strictest registration laws in the US (Local Law 18)
- Hawaii -- high home prices, resort-zone restrictions, minimum stay requirements
- California -- $833,000 median home price, patchwork city-by-city regulations
- Colorado -- licensing caps in resort towns, primary-residence rules in Denver
- Nevada -- Clark County permit chaos, owner-occupancy requirements in Las Vegas
What the report gets right: these are genuinely challenging regulatory environments. What it misses: RevPAR, occupancy rates, ADR trends, and revenue data -- the metrics that actually determine whether an investment produces returns. The report itself concedes this gap, noting that in California, profitability "depends on where you plan to operate, how strict local laws are, and how much competition you face in your specific market." That market-level variation is exactly what state-level rankings obscure.
AirROI State Scorecard: The Revenue Data Behind Each "Worst" State
AirROI data tells a more nuanced story. We pulled market summaries for major markets in all five "worst" states plus control markets in Tennessee and Arizona -- states widely considered favorable for STR investing.
| Market | State | RevPAR | ADR | Occupancy | Annual Revenue | Active Listings |
|---|---|---|---|---|---|---|
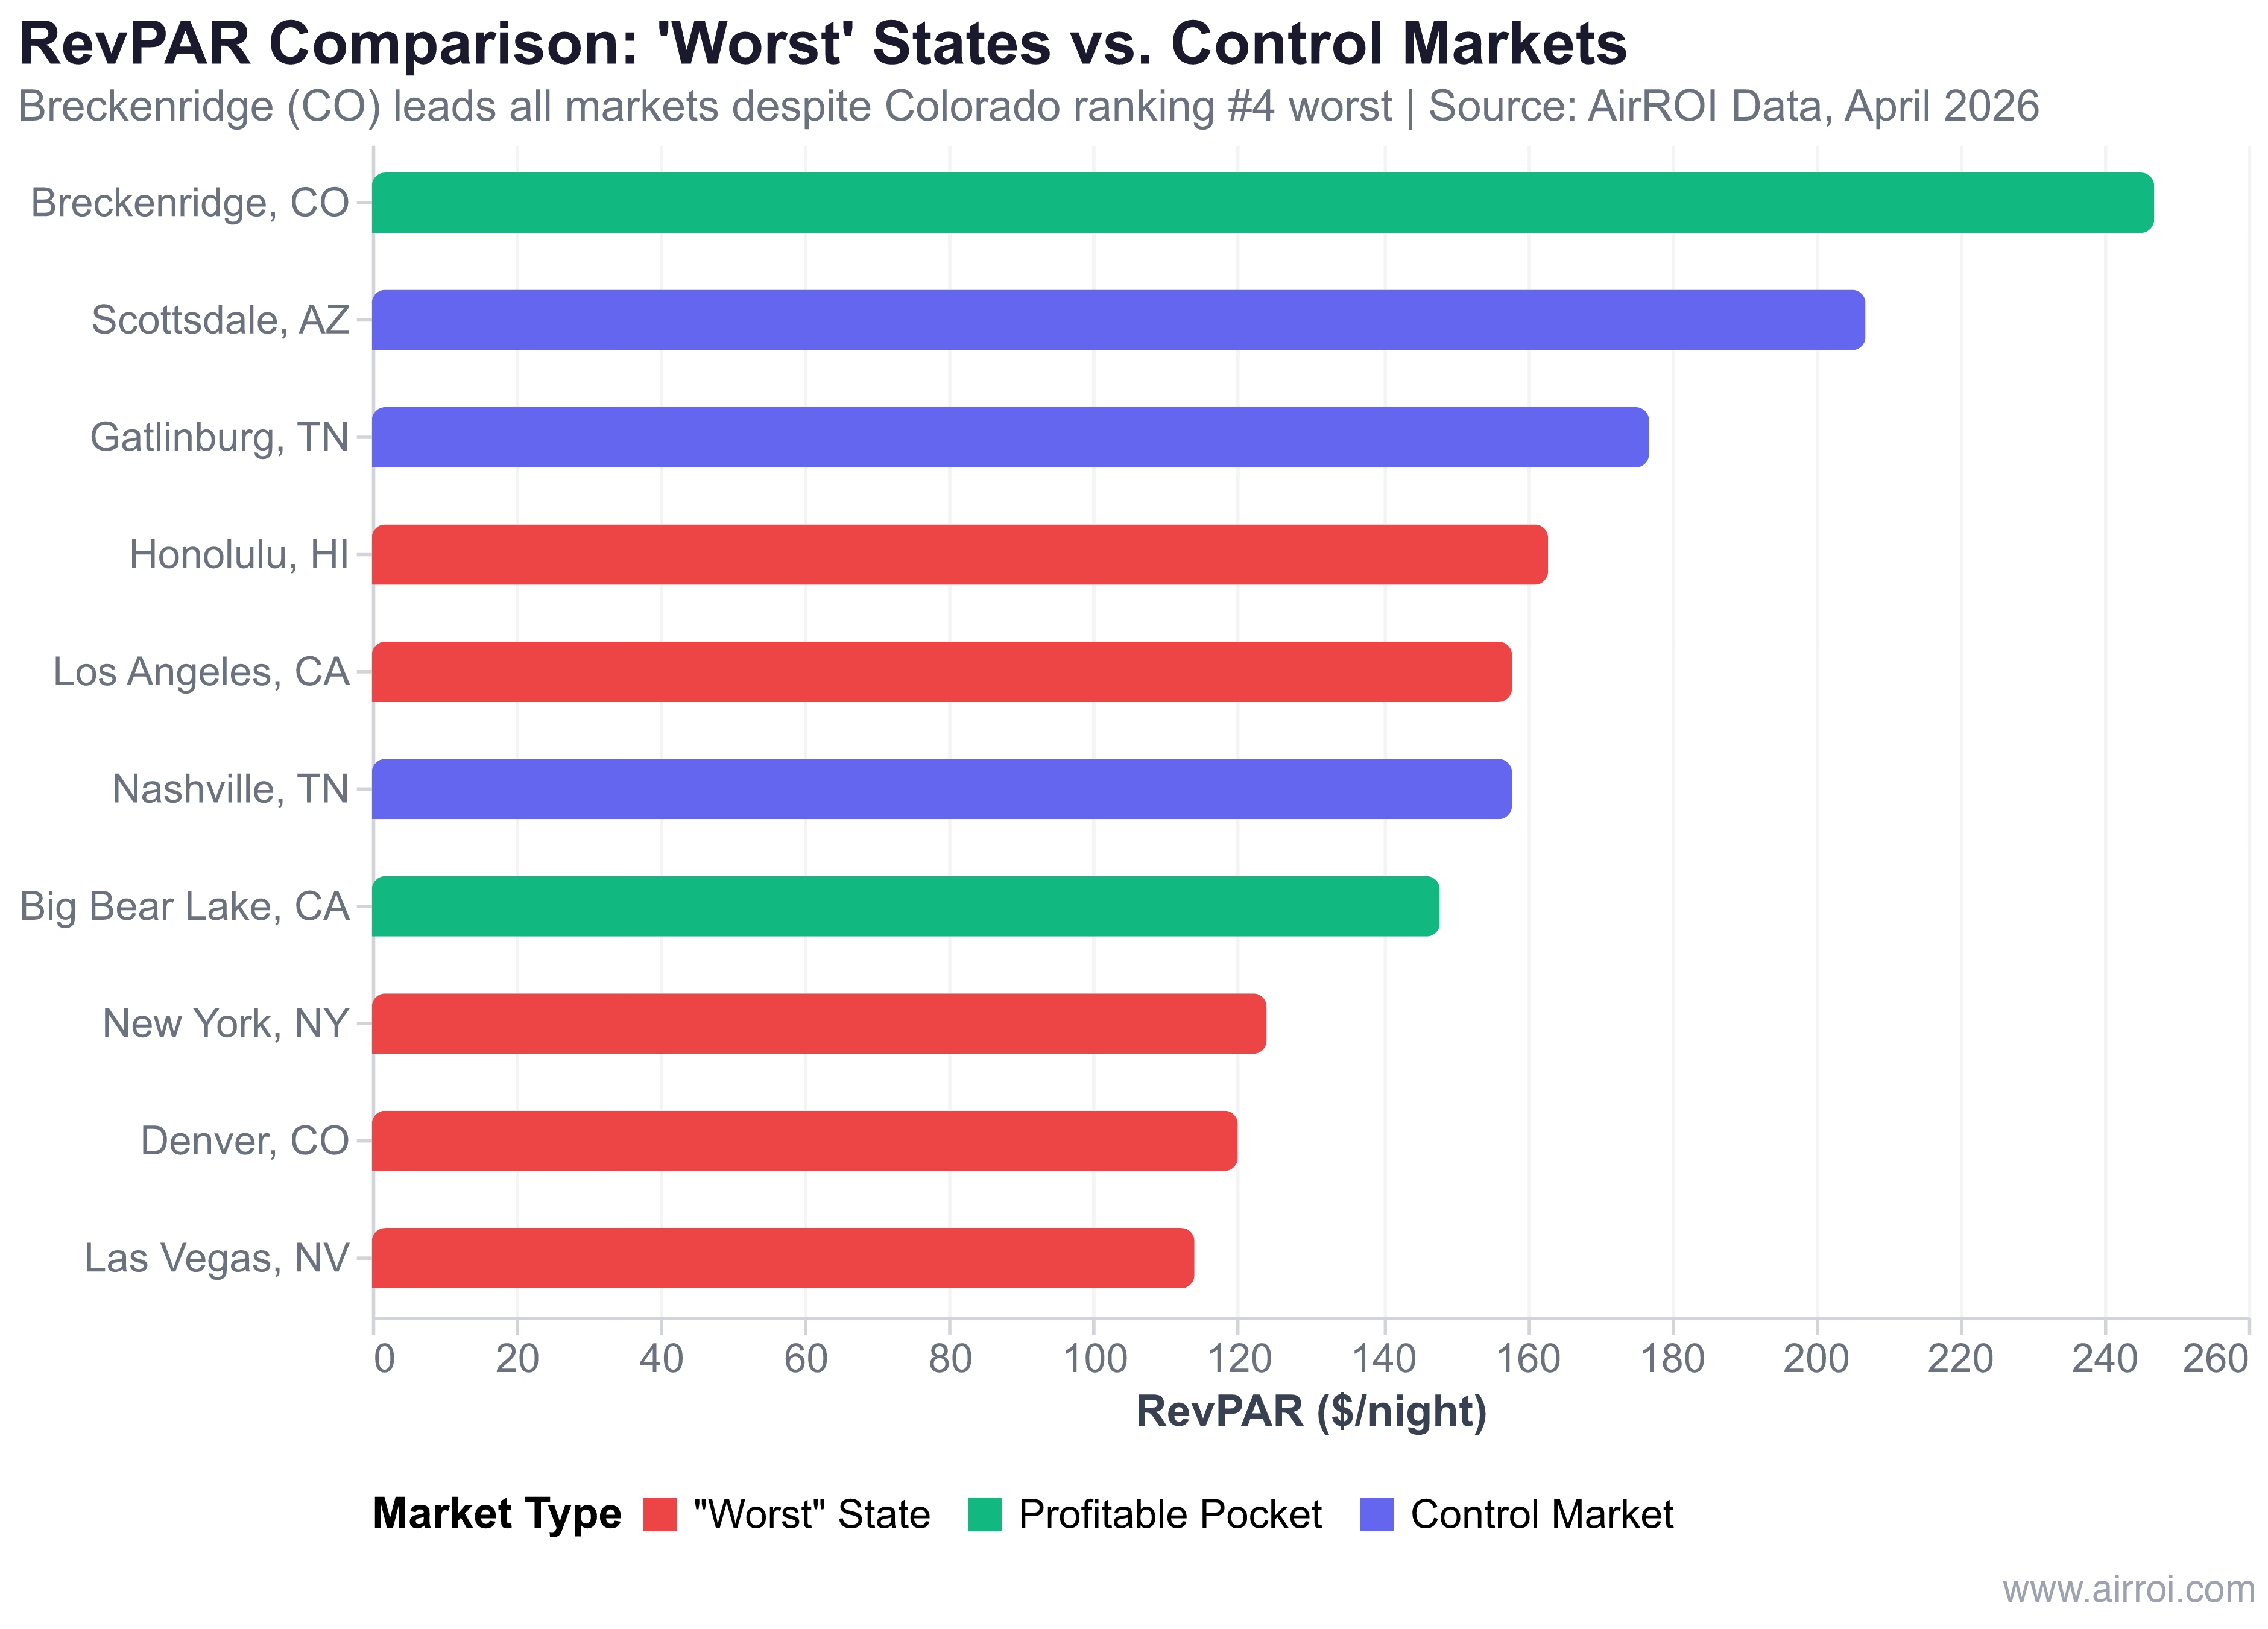
| Breckenridge | CO (worst #4) | $247 | $574 | 42% | $46,676 | 3,224 |
| Scottsdale | AZ (control) | $207 | $413 | 49% | $34,246 | 4,689 |
| Gatlinburg | TN (control) | $177 | $367 | 48% | $40,582 | 3,787 |
| Honolulu | HI (worst #2) | $163 | $265 | 61% | $32,255 | 5,920 |
| Los Angeles | CA (worst #3) | $158 | $317 | 48% | $19,213 | 11,301 |
| Nashville | TN (control) | $158 | $347 | 47% | $34,583 | 6,845 |
| Big Bear Lake | CA (worst #3) | $148 | $477 | 31% | $27,665 | 3,222 |
| New York | NY (worst #1) | $124 | $225 | 51% | $13,779 | 12,475 |
| Denver | CO (worst #4) | $120 | $218 | 54% | $18,843 | 4,132 |
| Las Vegas | NV (worst #5) | $114 | $271 | 42% | $15,215 | 3,658 |
Source: AirROI market summary data, April 2026. Revenue and RevPAR reflect trailing 12-month median values.
The data reveals three patterns that a regulation-focused methodology alone does not capture:
Pattern 1: "Worst" state markets outperform "safe" state markets. Breckenridge ($247 RevPAR) beats every control market tested. Honolulu ($163 RevPAR) matches Nashville ($158) while delivering the highest occupancy rate of any market in the table at 61%.
Pattern 2: Revenue varies more within states than between them. Colorado contains both the highest RevPAR market (Breckenridge at $247) and a below-average one (Denver at $120) -- a 2.1x gap within the same state. California shows a similar spread between Big Bear Lake ($477 ADR) and the Los Angeles city average ($317 ADR).
Pattern 3: Low regulation does not guarantee strong returns. Nashville posts $158 RevPAR with 6,845 active listings -- nearly identical per-night revenue to Los Angeles, but with over twice the listing density relative to metro population. More supply, same RevPAR.
State-by-State Breakdown
The Profitable Pockets Paradox: $247 RevPAR in a "Worst" State
The most counterintuitive finding in our analysis is that heavily regulated states contain some of the highest-RevPAR markets in the country. This is not despite the regulation -- it is partially because of it.
Regulation creates supply compression. When a market caps licenses, raises compliance costs, or restricts who can operate, the supply of legal STRs shrinks. Fewer listings competing for the same demand means higher ADR and stronger RevPAR for those who remain. This is the compliance moat -- the competitive advantage that accrues to legally operating hosts in restricted markets.
Breckenridge exemplifies this dynamic. The town's 2,200-license cap means new entrants face a waitlist while existing operators benefit from constrained supply. At $574 ADR, Breckenridge listings command rates that would be unsustainable in an open market with unlimited supply. The result: $46,676 in median annual revenue -- higher than Gatlinburg ($40,582), Scottsdale ($34,246), and Nashville ($34,583), all markets with lighter regulatory environments.
Honolulu tells a similar story. Despite Hawaii's restrictive zoning and high entry costs, the 5,920 active listings that operate legally in Honolulu post 61% occupancy -- the highest of any market we tested. That occupancy drives $32,255 in annual revenue on a $265 ADR, competitive with many mainland resort markets.
According to AirDNA, the most desirable investment markets in 2026 average over $40,000 in annual revenue potential and post an average yield of 13.7%. Breckenridge exceeds both thresholds despite sitting in TurboTenant's fourth-worst state.
The States the Data Says You Should Actually Worry About
If regulation alone does not make a state "worst" for STR investing, what does? The data points to a more fundamental risk: oversaturation without compensating demand.
The real risk factors for STR investors are not state-level regulations -- they are:
- Rapid supply growth without demand growth -- markets adding 8-10%+ annual listings while revenue stays flat
- Declining ADR trends -- pricing power erosion from increased competition
- Hotel competition in urban markets -- Las Vegas, Nashville, and other convention-driven cities where hotel inventory dwarfs STR supply
- No regulatory moat -- easy-entry markets where any new competitor can list tomorrow
Ironically, some of the states TurboTenant warns against offer protection from these risks precisely because their regulations limit supply growth. Colorado's license caps, California's permitting requirements, and New York's registration mandates all function as supply constraints that benefit compliant operators.
The 4-Dimension STR State Scorecard Framework
To go beyond headline rankings, investors can evaluate any state using a data-driven framework with four dimensions. Here is how the five flagged states score:
| Dimension | New York | Hawaii | California | Colorado | Nevada |
|---|---|---|---|---|---|
| Revenue Performance | Low ($124 RevPAR city; strong upstate) | Strong ($163 RevPAR, 61% occ.) | Mixed ($158 RevPAR LA; $477 ADR Big Bear) | Split ($247 Breck; $120 Denver) | Weak ($114 RevPAR, 42% occ.) |
| Regulatory Friction | Extreme (LL18, 90%+ reduction) | High (resort-zone only, min stays) | High (patchwork, SB 346 enforcement) | High in cities, moderate in resorts | Chaotic (194 of 13,800 permitted) |
| Cost of Entry | $576K median (high) | $743K median (very high) | $833K median (highest US) | $560K median (high) | ~$420K median (moderate) |
| Supply Dynamics | Contracting (LL18 enforcement) | Stable (zoning limits) | Mixed (enforcement tightening) | Capped in resorts, growing in cities | Uncertain (injunction pending) |
How to Use This Framework
Dimension 2: Regulatory Friction. High friction is not automatically bad. Assess whether you can realistically achieve compliance, and whether compliance creates a supply moat. Markets where compliance is expensive but achievable -- like Breckenridge's license system -- reward those who navigate the process.
Dimension 3: Cost of Entry. Calculate gross yield: divide annual revenue by median home price. Breckenridge's $46,676 revenue on a $800K+ property yields ~5.8% gross. Las Vegas's $15,215 on a $420K property yields ~3.6%. The "cheaper" market delivers worse returns.
The $72 billion US short-term rental market is projected to grow at 7.4% CAGR through 2030, according to Research Nester data cited by Lodgify. But that growth will not be evenly distributed -- it will concentrate in markets with strong demand fundamentals and manageable supply, regardless of which state they sit in.
The bottom line: state-level "worst" and "best" labels are too coarse for investment decisions. Breckenridge and Denver are both in Colorado, but they operate in entirely different regulatory and economic environments. Los Angeles and Big Bear Lake are both in California, but their STR performance profiles diverge dramatically. The 4-dimension scorecard framework lets investors evaluate specific markets rather than writing off entire states based on headline rankings.
Frequently Asked Questions
TurboTenant's March 2026 report ranks New York, Hawaii, California, Colorado, and Nevada as the worst states based on regulatory burden and cost of entry. However, AirROI data reveals that markets within these states -- like Breckenridge, CO ($247 RevPAR) and Honolulu ($163 RevPAR) -- outperform many markets in supposedly safer states.
California's $833,000 median home price and patchwork city-by-city regulations make entry difficult. But Big Bear Lake generates $477 ADR and $27,665 annual revenue, and coastal markets remain strong. California's new SB 346 (effective January 2026) increases enforcement, which may benefit compliant operators through supply compression.
NYC's Local Law 18 reduced short-term rental listings by over 90% since September 2023, eliminating most investor-owned STRs. Compliant hosts operating registered primary residences face dramatically less competition. Meanwhile, upstate markets like the Hamptons, Lake Placid, and the Catskills operate under entirely different regulatory frameworks.
AirROI data shows heavily regulated markets like Breckenridge ($247 RevPAR) and Honolulu ($163 RevPAR, 61% occupancy) produce strong per-listing returns because regulations limit supply. Compliance creates a competitive moat -- legal operators face less competition. Nashville, with lighter regulation, posts $158 RevPAR with nearly twice the active listings.
Use a four-dimension scorecard: (1) Revenue performance -- RevPAR above $150 and occupancy above 45%, (2) Regulatory friction -- permit requirements and compliance costs, (3) Cost of entry -- median home price versus annual revenue potential, (4) Supply dynamics -- listing growth rate versus revenue growth rate. AirROI Atlas provides market-level data for all four dimensions.