
Is Airbnb Profitable in 2026? We Analyzed 15 US Markets -- Here's the Honest Answer
Google "is Airbnb profitable" and you will find a SERP full of contradictions. Mashvisor says "absolutely yes" with no cost model. Reddit threads split 50/50 with anecdotes instead of analysis. And everyone else hedges with "it depends" without specifying what it depends on. None of them did the math. We did.
Based on AirROI's analysis of trailing-twelve-month data across 15 major US markets and 160,000+ active listings, the answer is: Airbnb is profitable in 10 of 15 US markets we analyzed when you account for all costs including mortgage on a median-priced home. Without mortgage, every US market produces positive net operating income. The gap between the best and worst markets approaches $50,000 per year -- Broken Bow, OK generates +$29,446 in annual net profit while Denver, CO loses -$19,939. The question is not whether Airbnb is profitable. The question is where.
The Complete Airbnb Operating Cost Model Nobody Else Publishes
Most "is Airbnb profitable" articles cite revenue figures and stop there. Revenue is not profit. A property generating $40,000 in annual revenue can still lose $15,000 after expenses. Here is the full cost model for a typical 2-bedroom whole-home STR listing, built from actual operator data and industry benchmarks.
| Expense Category | Annual Cost | How It's Calculated |
|---|---|---|
| Cleaning | $6,250 - $12,500 | $125 per turnover x 50-100 turnovers per year |
| Utilities | $3,000 - $4,800 | $250-$400/month (electric, water, gas, internet, trash) |
| Maintenance | 5% of revenue | Higher guest wear means more repairs than owner-occupied |
| Airbnb host service fee | 3% of revenue | Applied to all bookings (rising to 15.5% under new single-fee structure) |
| STR insurance | $2,500 | STR-specific policies cost $2,000-$3,000 vs. $1,200 for standard homeowners |
| Supplies & consumables | $1,200 | $100/month: toiletries, linens, coffee, cleaning products |
| Property taxes | 1% of home value | Ranges from $1,500 in Oklahoma to $15,000+ in California |
| Total operating expenses | $15,500 - $38,000+ | Highly market-dependent |
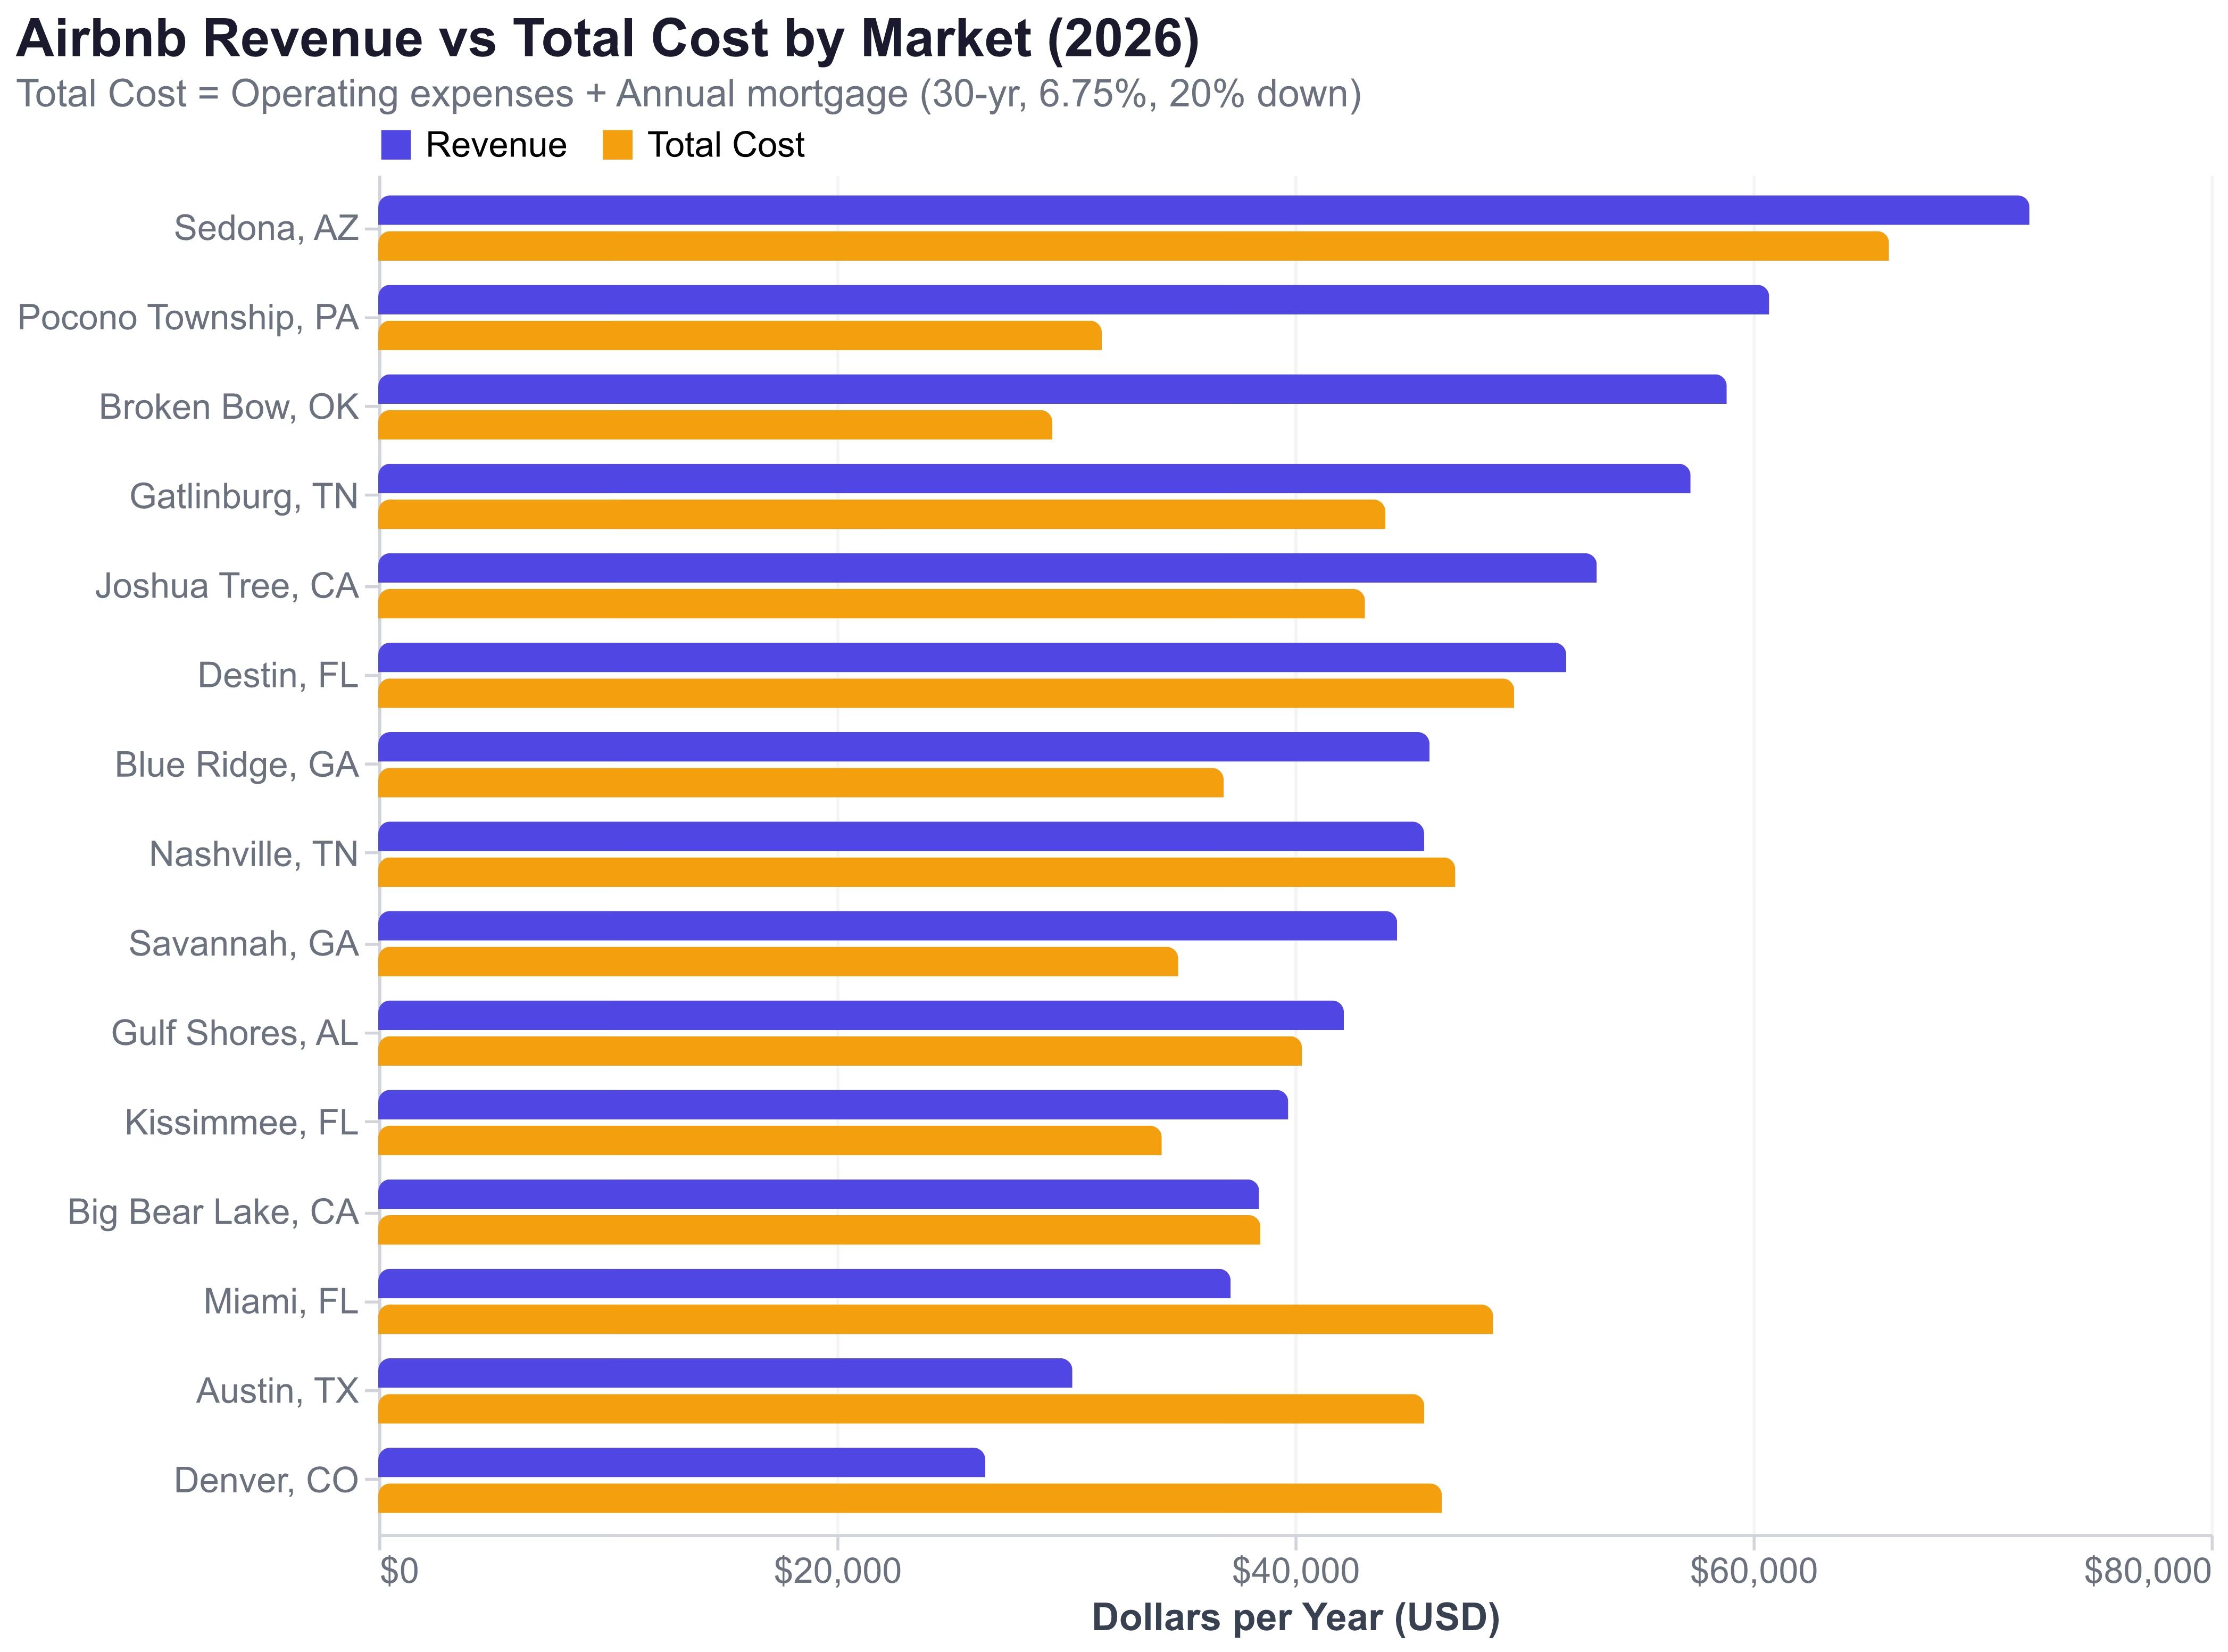
The mortgage is the profitability killer in expensive markets. For this analysis, we model a 30-year fixed mortgage at 6.75% (the April 2026 national average) with 20% down payment on each market's median home price. In San Francisco, that mortgage alone costs $78,996 per year -- more than double the market's median STR revenue of $36,218.
The Profitability Scorecard: 15 US Markets Ranked by Net Cash Flow
This is the table no competing article provides: actual revenue data from AirROI, a complete operating cost estimate, mortgage on the median home price, and the resulting net profit or loss.
| Market | Annual Revenue | Operating Costs | Annual Mortgage | Net Profit/Loss |
|---|---|---|---|---|
| Broken Bow, OK | $58,869 | $15,407 | $14,016 | +$29,446 |
| Pocono Township, PA | $60,724 | $16,010 | $15,576 | +$29,138 |
| Gatlinburg, TN | $57,291 | $15,930 | $28,032 | +$13,329 |
| Joshua Tree, CA | $53,199 | $15,106 | $27,969 | +$10,124 |
| Savannah, GA | $44,482 | $13,120 | $21,802 | +$9,560 |
| Blue Ridge, GA | $45,893 | $13,546 | $23,360 | +$8,987 |
| Sedona, AZ | $72,087 | $19,225 | $46,728 | +$6,134 |
| Kissimmee, FL | $39,725 | $12,401 | $21,802 | +$5,522 |
| Destin, FL | $51,861 | $15,327 | $34,263 | +$2,271 |
| Gulf Shores, AL | $42,154 | $13,855 | $26,473 | +$1,826 |
| Big Bear Lake, CA | $38,456 | $12,039 | $26,473 | -$56 |
| Nashville, TN | $45,657 | $14,000 | $33,017 | -$1,360 |
| Miami, FL | $37,211 | $12,542 | $36,131 | -$11,462 |
| Austin, TX | $30,300 | $11,399 | $34,263 | -$15,362 |
| Denver, CO | $26,497 | $10,616 | $35,820 | -$19,939 |
Source: AirROI trailing-twelve-month market data (April 2026). Operating costs estimated per the model above. Mortgage: 30-year fixed at 6.75%, 20% down on median home price. International markets (Lisbon, Tulum, Cancun, Bangkok) excluded from this table due to different financing structures.
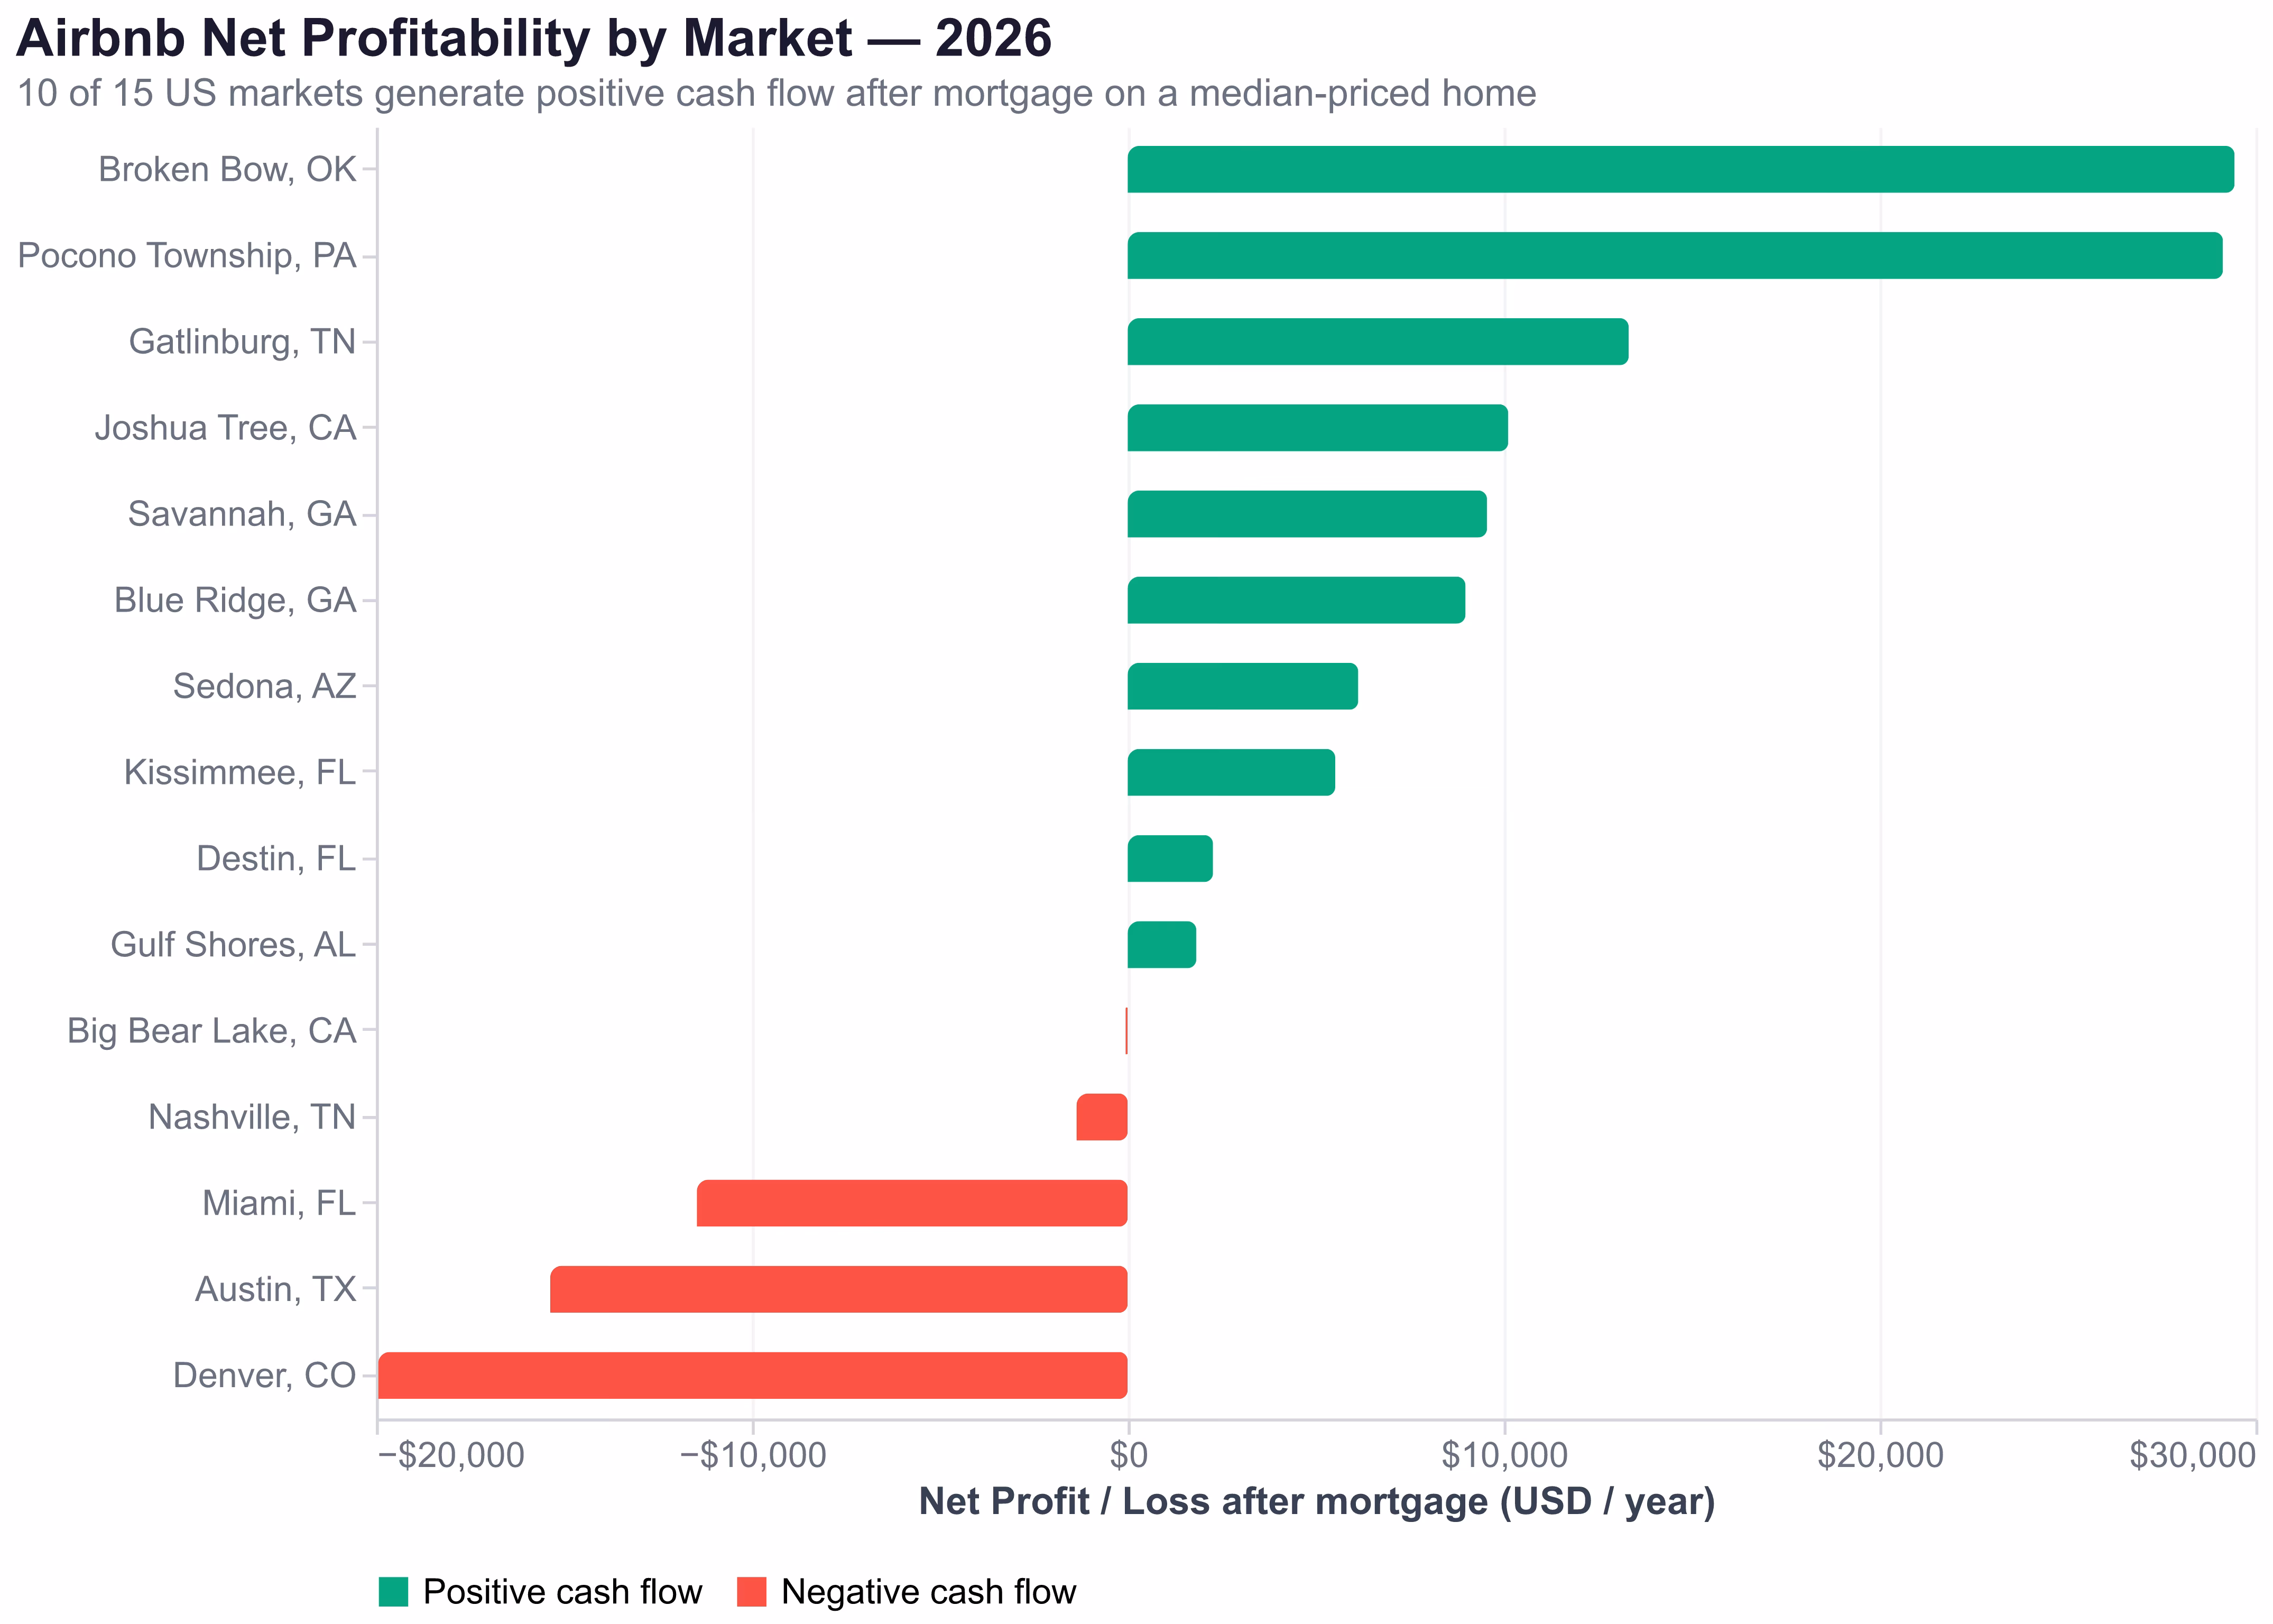
The pattern is striking. 10 of 15 markets clear comfortable profit margins when buying at the median home price with conventional financing, led by Broken Bow (+$29,446) and Pocono Township (+$29,138). Two more (Big Bear Lake, Nashville) sit essentially at breakeven. Only three expensive coastal markets -- Miami, Austin, and Denver -- still lose more than $10,000 per year at median entry prices.
The critical insight: without a mortgage, every US market we analyzed is profitable. A paid-off property in Sedona generates $52,862 in net operating income. A financed one still clears +$6,134. The mortgage payment remains the single biggest variable in profitability -- but revenue has caught up with costs in most markets, flipping the math decisively in favor of STR investment outside the most expensive coastal cities.
Where Airbnb Is Clearly Profitable in 2026
The markets where STR investment generates strong positive cash flow share three characteristics: home prices below $500,000, strong leisure demand driven by outdoor recreation, and limited hotel inventory that forces visitors toward vacation rentals.
Broken Bow, Oklahoma: +$29,446/year
Pocono Township, Pennsylvania: +$29,138/year
With median home prices around $250,000 and an ADR north of $550, the Poconos deliver returns essentially tied with Broken Bow. The 39% occupancy rate reflects seasonal demand (ski season and summer), but the high ADR compensates. At $60,724 in annual revenue against $31,586 in total costs, this market clears $29,138 per year -- a 58% cash-on-cash return on a $50,000 down payment.
Gatlinburg and Joshua Tree: +$13,329 and +$10,124/year
Gatlinburg generates $57,291 in annual revenue -- more than enough to cover a $450,000 property's costs and leave $13,329 in annual profit. The Great Smoky Mountains National Park (the most-visited US national park) sustains strong ADR of $378 across 4,000+ listings. Joshua Tree's desert-aesthetic demand drives 48% occupancy and $53,199 in revenue against $27,969 in mortgage costs, clearing $10,124 per year. Both markets benefit from buyers who purchase below median or add high-ROI amenities like hot tubs.
Savannah and Blue Ridge: +$9,560 and +$8,987/year
Two Southeast markets round out the clearly-profitable tier. Savannah combines affordable entry ($400K median) with strong revenue from year-round tourism and wedding demand. Blue Ridge's North Georgia cabin inventory rides the same mountain-vacation wave as Gatlinburg, but with lower entry costs, producing a similar profit margin.
Where Airbnb Still Loses Money in 2026
A minority of markets -- high-cost coastal cities with regulatory friction -- continue to lose money at median entry prices. They share a common pattern: home prices that rose faster than achievable STR revenue, often combined with restrictive licensing or oversupply.
San Francisco: -$55,778/year (excluded from chart -- off-scale)
Denver, Colorado: -$19,939/year
Denver's $26,497 median STR revenue is the lowest among major US metro areas in our analysis. With a $575,000 median home price and strict STR licensing requirements, the math does not work for investment purchases. A 54% occupancy rate sounds strong, but an ADR of just $222 -- lower than Broken Bow ($469) or Destin ($476) -- drives revenue too low to cover costs. The 14.3-day average minimum night stay suggests the market has substantially shifted toward mid-term rentals.
Austin, Texas: -$15,362/year
Miami, Florida: -$11,462/year
Miami's 9,751 active listings drive a competitive market where ADR averages $294 and occupancy sits at 50%. That combination produces $37,211 in annual revenue -- solid in isolation, but insufficient against a $580,000 median home price. The annual mortgage of $36,131 alone nearly matches revenue before a single operating dollar is spent. Miami's appeal as an STR market is real, but the entry price has risen faster than rental income.
New York City: mid-term-only market (not charted)
New York's Local Law 18, which took effect in September 2023, effectively banned most traditional STR operations. Median annual revenue sits at $22,677 -- among the lowest in our US dataset. With a 25.8-day average minimum stay, the market has functionally become a mid-term rental market, not a short-term one. The 18,880 "active listings" are mostly 30+ day stays, not the nightly Airbnb model investors envision.
International Markets: A Different Cost Structure
International markets deserve separate consideration because mortgage structures, property prices, and operating costs differ substantially from the US model.
Lisbon, Portugal generates $26,313 in annual revenue with an impressive 56% occupancy rate -- the highest in our analysis. At a median ADR of $173 (USD equivalent), Lisbon's revenue-per-listing is modest, but operating costs in Portugal run approximately 40% lower than US markets. For a foreign investor purchasing a $400,000 apartment with Portuguese financing, the numbers work better than before. For EU residents who benefit from lower mortgage rates (averaging 3.5-4% in the eurozone) or who purchase properties outright, Lisbon's high occupancy and year-round tourist demand make it one of the more attractive international STR markets.
Tulum, Mexico ($14,219 annual revenue) and Cancun ($12,050) still face oversupply. Tulum's 10,088 active listings compete for a demand base that produces only 34% occupancy at an ADR of $220. Cancun fares better on occupancy (42%) but with an ADR of just $125. Both markets were flooded with condo developments marketed specifically to STR investors during 2021-2023, and supply has overwhelmed demand. For US investors, the currency risk and property management logistics compound the financial challenges.
Bangkok, Thailand at $7,215 annual revenue illustrates how low ADR markets ($73/night) generate insufficient revenue for foreign investors despite reasonable occupancy (45%). Bangkok remains attractive for local operators with low cost structures, but the numbers do not work for international STR investment at current exchange rates.
Airbnb vs. Long-Term Rental: Where the STR Premium Disappeared
The assumption that STR always beats long-term rental (LTR) income is nuanced, not absolute. In leisure markets, STR crushes LTR. In expensive regulated coastal cities, LTR still wins.
| Market | STR Net (No Mortgage) | Est. LTR Net (No Mortgage) | STR Premium |
|---|---|---|---|
| Broken Bow, OK | $43,462 | $12,240 | +255% |
| Gatlinburg, TN | $41,361 | $14,280 | +189% |
| Sedona, AZ | $52,862 | $25,500 | +107% |
| Nashville, TN | $31,657 | $20,400 | +55% |
| Miami, FL | $24,669 | $23,460 | +5% |
| Austin, TX | $18,901 | $18,360 | +3% |
| Denver, CO | $15,881 | $20,400 | -22% |
| San Francisco, CA | $23,091 | $35,700 | -35% |
STR net = annual revenue minus operating costs. LTR net = annual rent minus estimated 15% operating costs. Both exclude mortgage.
The pattern now reads clearly. STR outperforms LTR decisively in leisure and resort markets where travelers have no long-term rental alternative -- Broken Bow (+255%), Gatlinburg (+189%), Sedona (+107%). Nashville clears a comfortable +55% premium. In Austin and Miami, the two models now produce roughly equivalent net yields, with STR having a slight edge. Only in regulated coastal cities like Denver (-22%) and San Francisco (-35%) does LTR still beat STR on net yield.
What Separates Profitable Hosts From Unprofitable Ones
The scorecard above uses market medians. In every market, top-quartile operators earn 50-100% more than the median. In Broken Bow, median revenue is $58,869 -- but the 75th percentile likely exceeds $80,000. That $20,000-plus difference is entirely controllable. Here is what profitable hosts do differently.
Buy Below Median Price
The single highest-leverage decision is acquisition price. Every $50,000 below median home price reduces annual mortgage costs by $3,114 and moves the profitability needle by that same amount. In Austin, buying a property for $480,000 instead of $550,000 cuts $4,360 off the annual mortgage -- flipping a -$15,362 loss to -$11,002, and a below-median-plus-above-median-revenue combination can turn breakeven.
Invest in Revenue-Driving Amenities
Use Dynamic Pricing
Self-Manage When Margins Are Thin
Property management fees of 15-30% of gross revenue are the difference between profit and loss in marginally viable markets. On a $35,000/year STR, that fee is $5,250-$10,500 -- enough to flip Blue Ridge from break-even to deeply negative. Self-management requires 10-20 hours per month but preserves the full margin.
Diversify With Mid-Term Stays
Leverage the STR Tax Loophole
Choose the Right Bedroom Count
The Bottom Line
Is Airbnb profitable in 2026? Yes -- in most US markets we analyzed, when you invest outside the most expensive coastal cities. The data across 15 major US markets is now unambiguous on that point: leisure and mid-market cabin/cottage destinations deliver $9,000-$29,000 in annual net profit after all costs including mortgage on a median-priced home. Only a handful of expensive or regulated urban markets (San Francisco, Denver, Austin, Miami) still produce losses at median entry prices. And STR still beats long-term rental decisively in leisure markets, with LTR only winning in regulated coastal cities.
Before you invest, run the numbers for your specific market and property. The difference between Broken Bow (+$29,446/year) and Denver (-$19,939/year) is not luck -- it is data.
Disclaimer: This analysis is for informational purposes only and does not constitute investment advice. Operating costs are estimated based on industry benchmarks and may vary by property. Median home prices and mortgage rates are approximate and subject to change. Always conduct property-specific due diligence before making investment decisions.
Frequently Asked Questions
Airbnb is profitable in the majority of US markets when you invest outside the largest coastal cities. AirROI data across 15 major US markets shows that 10 of them produce positive cash flow when accounting for all operating costs plus a mortgage on a median-priced home. Without mortgage, every US market in our analysis shows positive net operating income. The answer depends on where you invest and what you pay for the property.
The median whole-home Airbnb listing generates $45,657 in annual revenue across the 15 US markets analyzed by AirROI. Operating costs consume $11,000 to $19,000 of that, leaving $16,000 to $53,000 in net operating income before mortgage. With a mortgage on a median-priced home, most US markets now produce a net profit of $2,000 to $29,000 per year.
Based on AirROI data, the most profitable markets for new STR investment are Broken Bow, OK (net profit of +$29,446/year) and Pocono Township, PA (+$29,138/year). These markets share low home prices relative to rental demand, strong outdoor recreation appeal, and limited hotel competition. Gatlinburg, TN (+$13,329) and Joshua Tree, CA (+$10,124) are the next strongest.
In resort and vacation markets, STR revenue exceeds long-term rental income by 100-255%. In expensive coastal urban markets like Denver and San Francisco, STR still produces 22-35% less net income than long-term rental after accounting for higher operating costs. The STR premium holds decisively in leisure-driven markets and in most mid-priced urban markets, but breaks down in regulated coastal cities.
The five most underestimated Airbnb costs are cleaning at $125 per turnover ($6,250 to $12,500 per year), STR-specific insurance at $2,500 per year, maintenance at 5% of revenue due to higher guest wear, utilities running 30-50% higher than owner-occupied homes, and Airbnb's host service fee of 3% (rising to 15.5% under the new single-fee structure for most hosts).