
Airbnb Off-the-Map 2026: AirROI Data Reveals Which Rural Markets Actually Deliver Returns
Airbnb's first-ever America Off-the-Map list spotlights 20 rural destinations where short-term rentals are "driving new opportunities for tourism." The company reports that 86% of travelers are interested in rural getaways, and hosts in hotel-free areas earned $9.9 billion in 2025. It is a compelling narrative. AirROI tested it with data. Across the 10 Airbnb Off-the-Map destinations with sufficient listing counts for analysis, median annual revenue averages $20,814 -- and five of them earn less than the $13,800 national host average. For investors evaluating these best rural Airbnb markets in 2026, the gap between Airbnb's travel-inspiring list and investable reality is substantial.
What Airbnb's Off-the-Map List Tells You (and What It Doesn't)
Airbnb's Off-the-Map list identifies 20 lesser-known destinations across four categories: mountain escapes (Alexandria NH, Dubois WY, Fairview UT, Haines AK, Pine Creek Gorge PA, Snowflake AZ, Stanley VA), waterfront gems (Arnaudville LA, Cedar Key FL, Fort Peck Lake MT, Naalehu HI, Sekiu WA, Sodus Point NY), historic towns (Coarsegold CA, Goldfield NV, Pinos Altos NM, Wilmington IL), and wide open plains (Matador TX, Monte Vista CO). Released on March 23, 2026, it is the platform's first curated rural destination list.
The supporting data points are genuine. According to Airbnb, 63% of the United States lacks hotel infrastructure, and 64% of U.S. Airbnb guests traveled less than 300 miles in 2025. As Laura Spanjian, Airbnb's Global Head of Policy, stated: "America Off the Map highlights rural, off-the-beaten-path destinations where Airbnb hosts are creating new opportunities for tourism."
The Revenue Reality: AirROI Data for 10 Off-the-Map Markets
AirROI analyzed every Off-the-Map destination with enough active listings to produce reliable market-level data. Ten of the 20 destinations met this threshold. The results reveal a 2.4x revenue gap within Airbnb's own curated list.
| Market | State | Median Revenue | ADR | Occupancy | RevPAR | Active Listings |
|---|---|---|---|---|---|---|
| Dubois | WY | $30,997 | $291 | 44% | $136 | 94 |
| Coarsegold | CA | $26,263 | $365 | 41% | $147 | 130 |
| Fairview | UT | $24,225 | $236 | 42% | $100 | 21 |
| Haines | AK | $20,402 | $262 | 44% | $116 | 53 |
| Taos | NM | $19,628 | $239 | 44% | $97 | 318 |
| Town of Sodus | NY | $18,763 | $303 | 36% | $115 | 86 |
| Naalehu | HI | $16,653 | $154 | 50% | $80 | 51 |
| Cedar Key | FL | $14,834 | $203 | 36% | $77 | 223 |
| Monte Vista | CO | $13,277 | $162 | 46% | $77 | 26 |
| Snowflake | AZ | $13,098 | $151 | 38% | $56 | 26 |
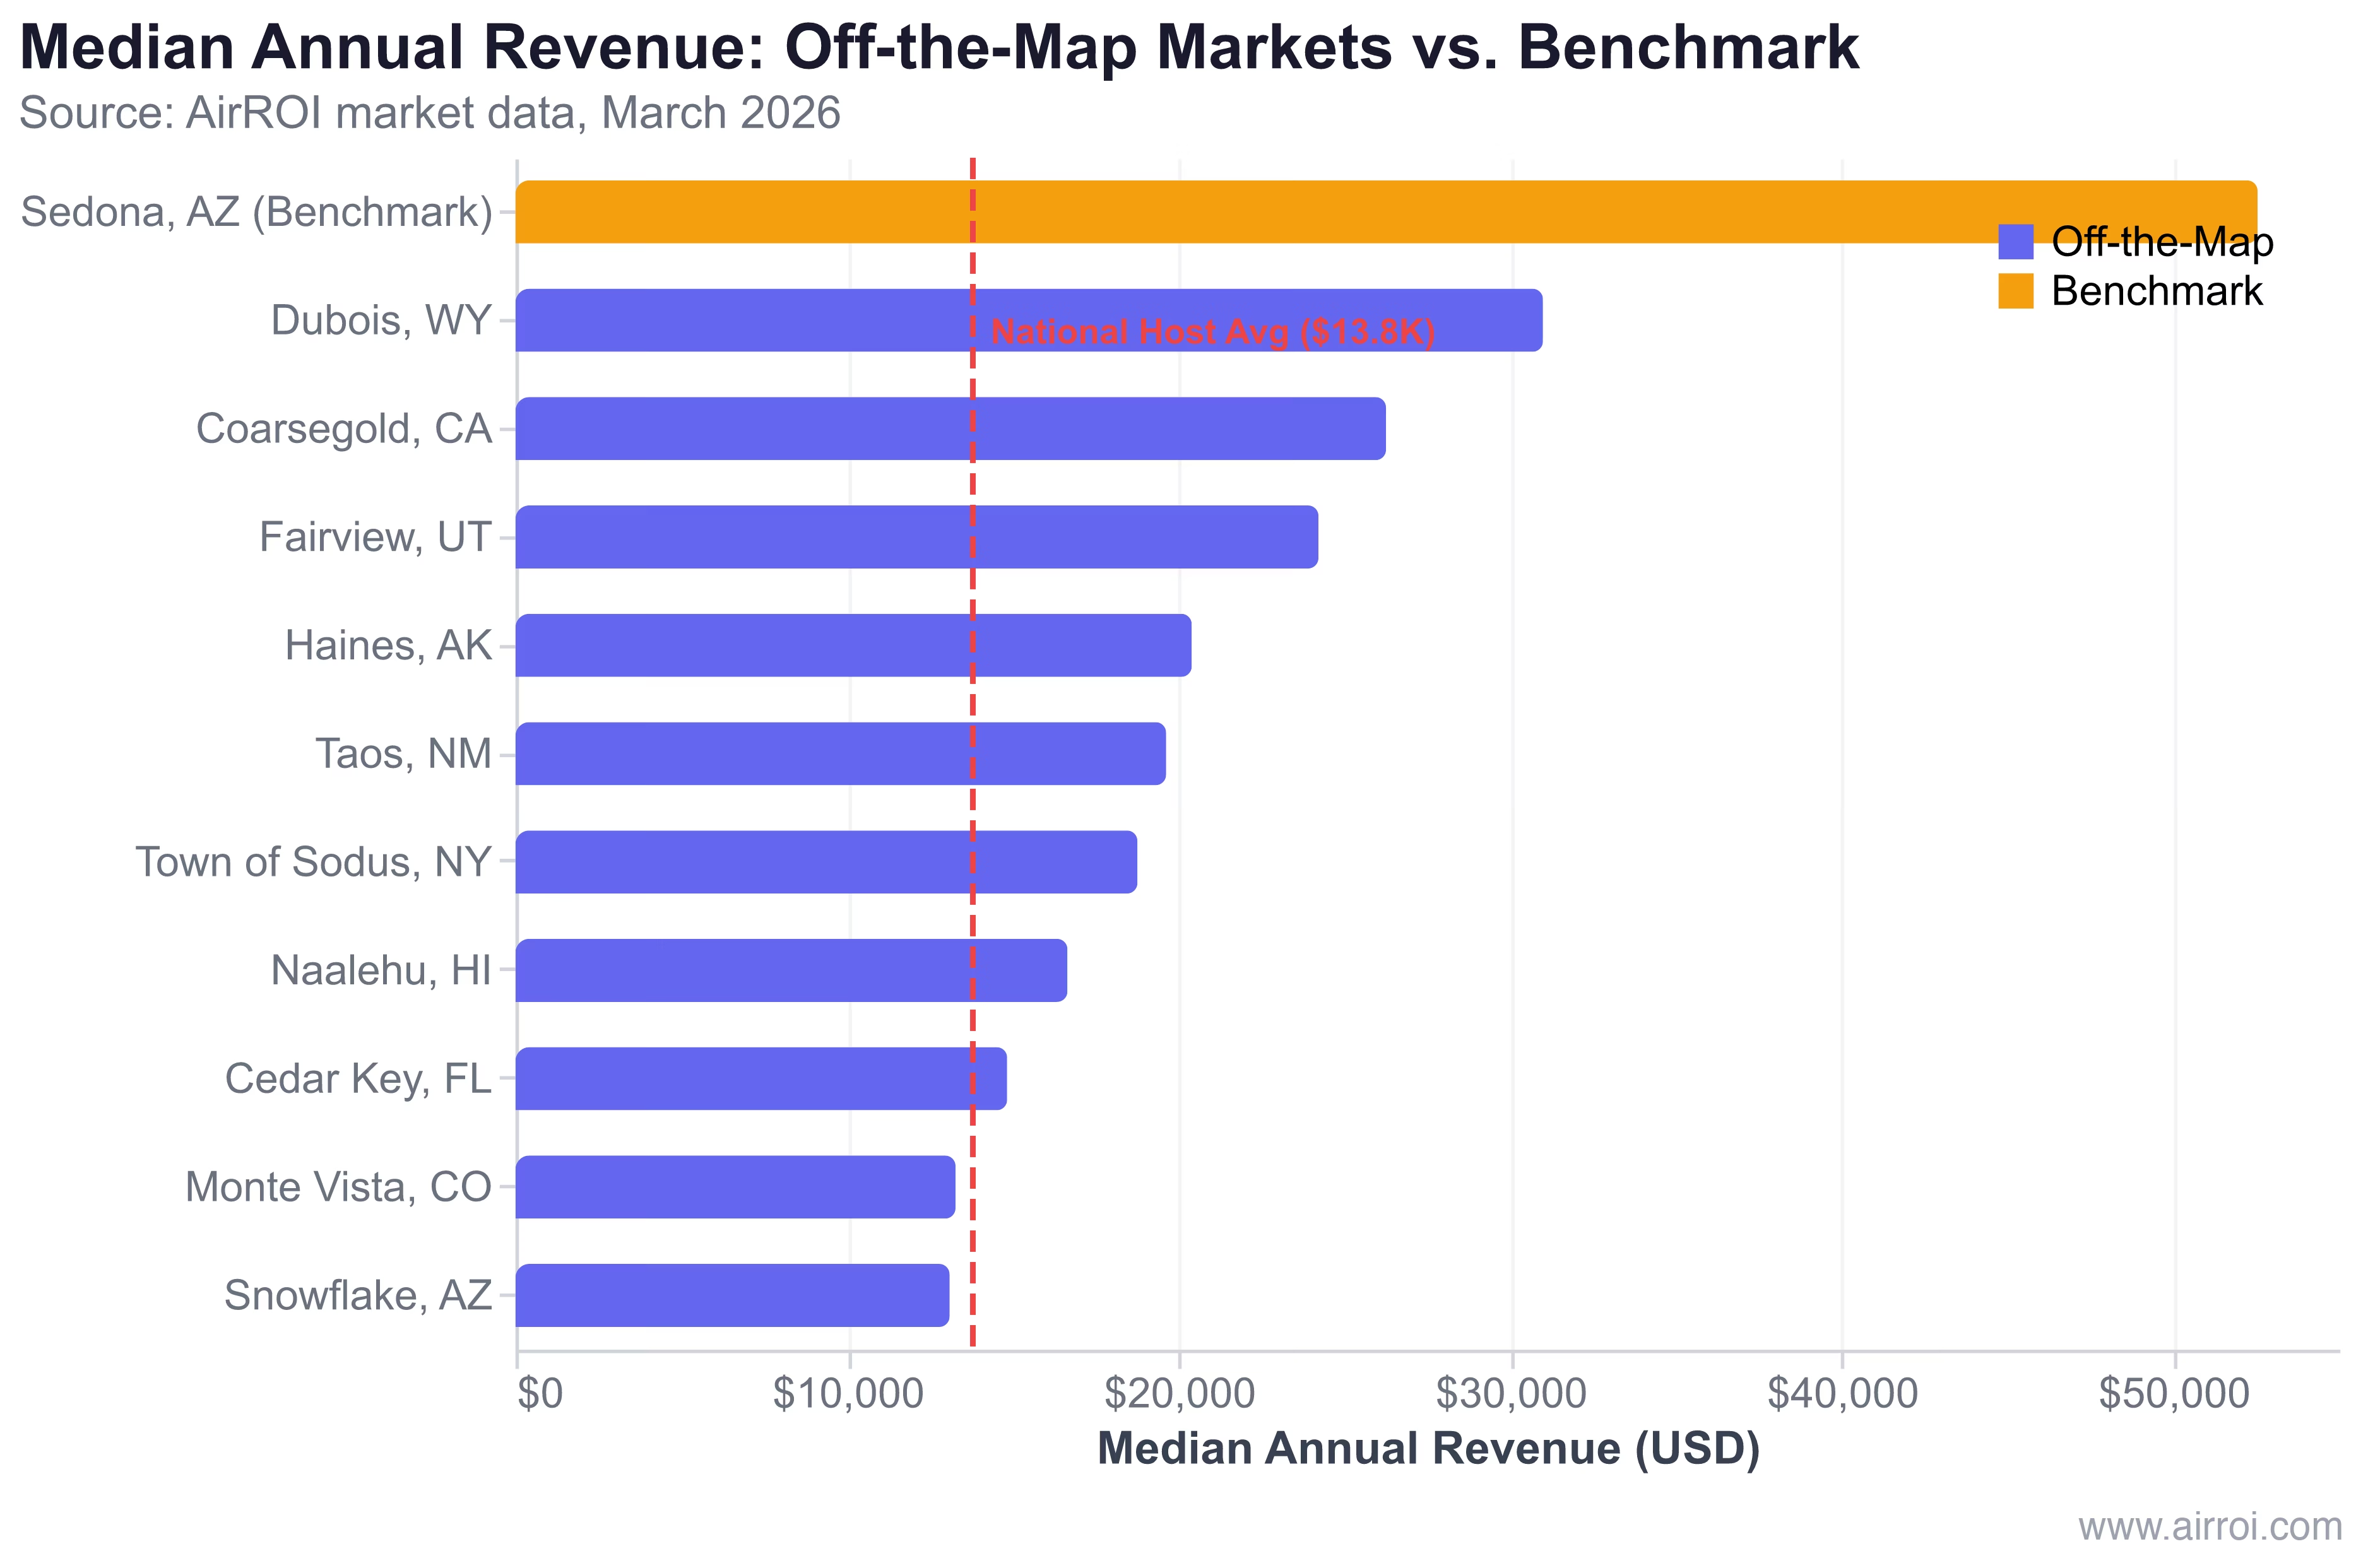
The top performer, Dubois, Wyoming, generates $30,997 in median annual revenue with a $291 ADR -- driven by its position between Yellowstone National Park and Jackson Hole at a fraction of either market's property prices. At the bottom, Snowflake, Arizona earns $13,098 with a $56 RevPAR, making it one of the weakest-performing markets on the entire list.
For benchmark context: Sedona, Arizona -- an established leisure market -- generates $52,553 in median annual revenue with 1,765 active listings and a $431 ADR. Even Dubois, the best Off-the-Map performer, delivers 59% of Sedona's revenue. The remaining nine markets fall further behind. As Truvi's 2026 short-term rental analysis notes, "Just because an area is rural doesn't guarantee bookings. Research seasonal patterns, local attractions, and existing competition."
Seasonality Risk: The 5-Month Revenue Desert
Rural markets are not just lower-revenue -- they are dramatically more seasonal. AirROI's monthly occupancy data reveals that most Off-the-Map destinations operate as 4-6 month businesses with extended periods of sub-35% occupancy.
| Market | Peak Occupancy | Trough Occupancy | Peak-to-Trough Ratio | Peak Season |
|---|---|---|---|---|
| Dubois, WY | 65% (Jul) | 31% (Jan/Mar) | 2.1x | Jun-Sep |
| Haines, AK | 59% (Jul) | 24% (Dec) | 2.5x | Jul-Aug |
| Cedar Key, FL | 58% (Mar) | 26% (Sep) | 2.2x | Feb-Apr |
| Coarsegold, CA | 58% (Jul) | 25% (Jan) | 2.3x | May-Aug |
| Taos, NM | 52% (Jul) | 31% (Jan) | 1.7x | May-Oct |
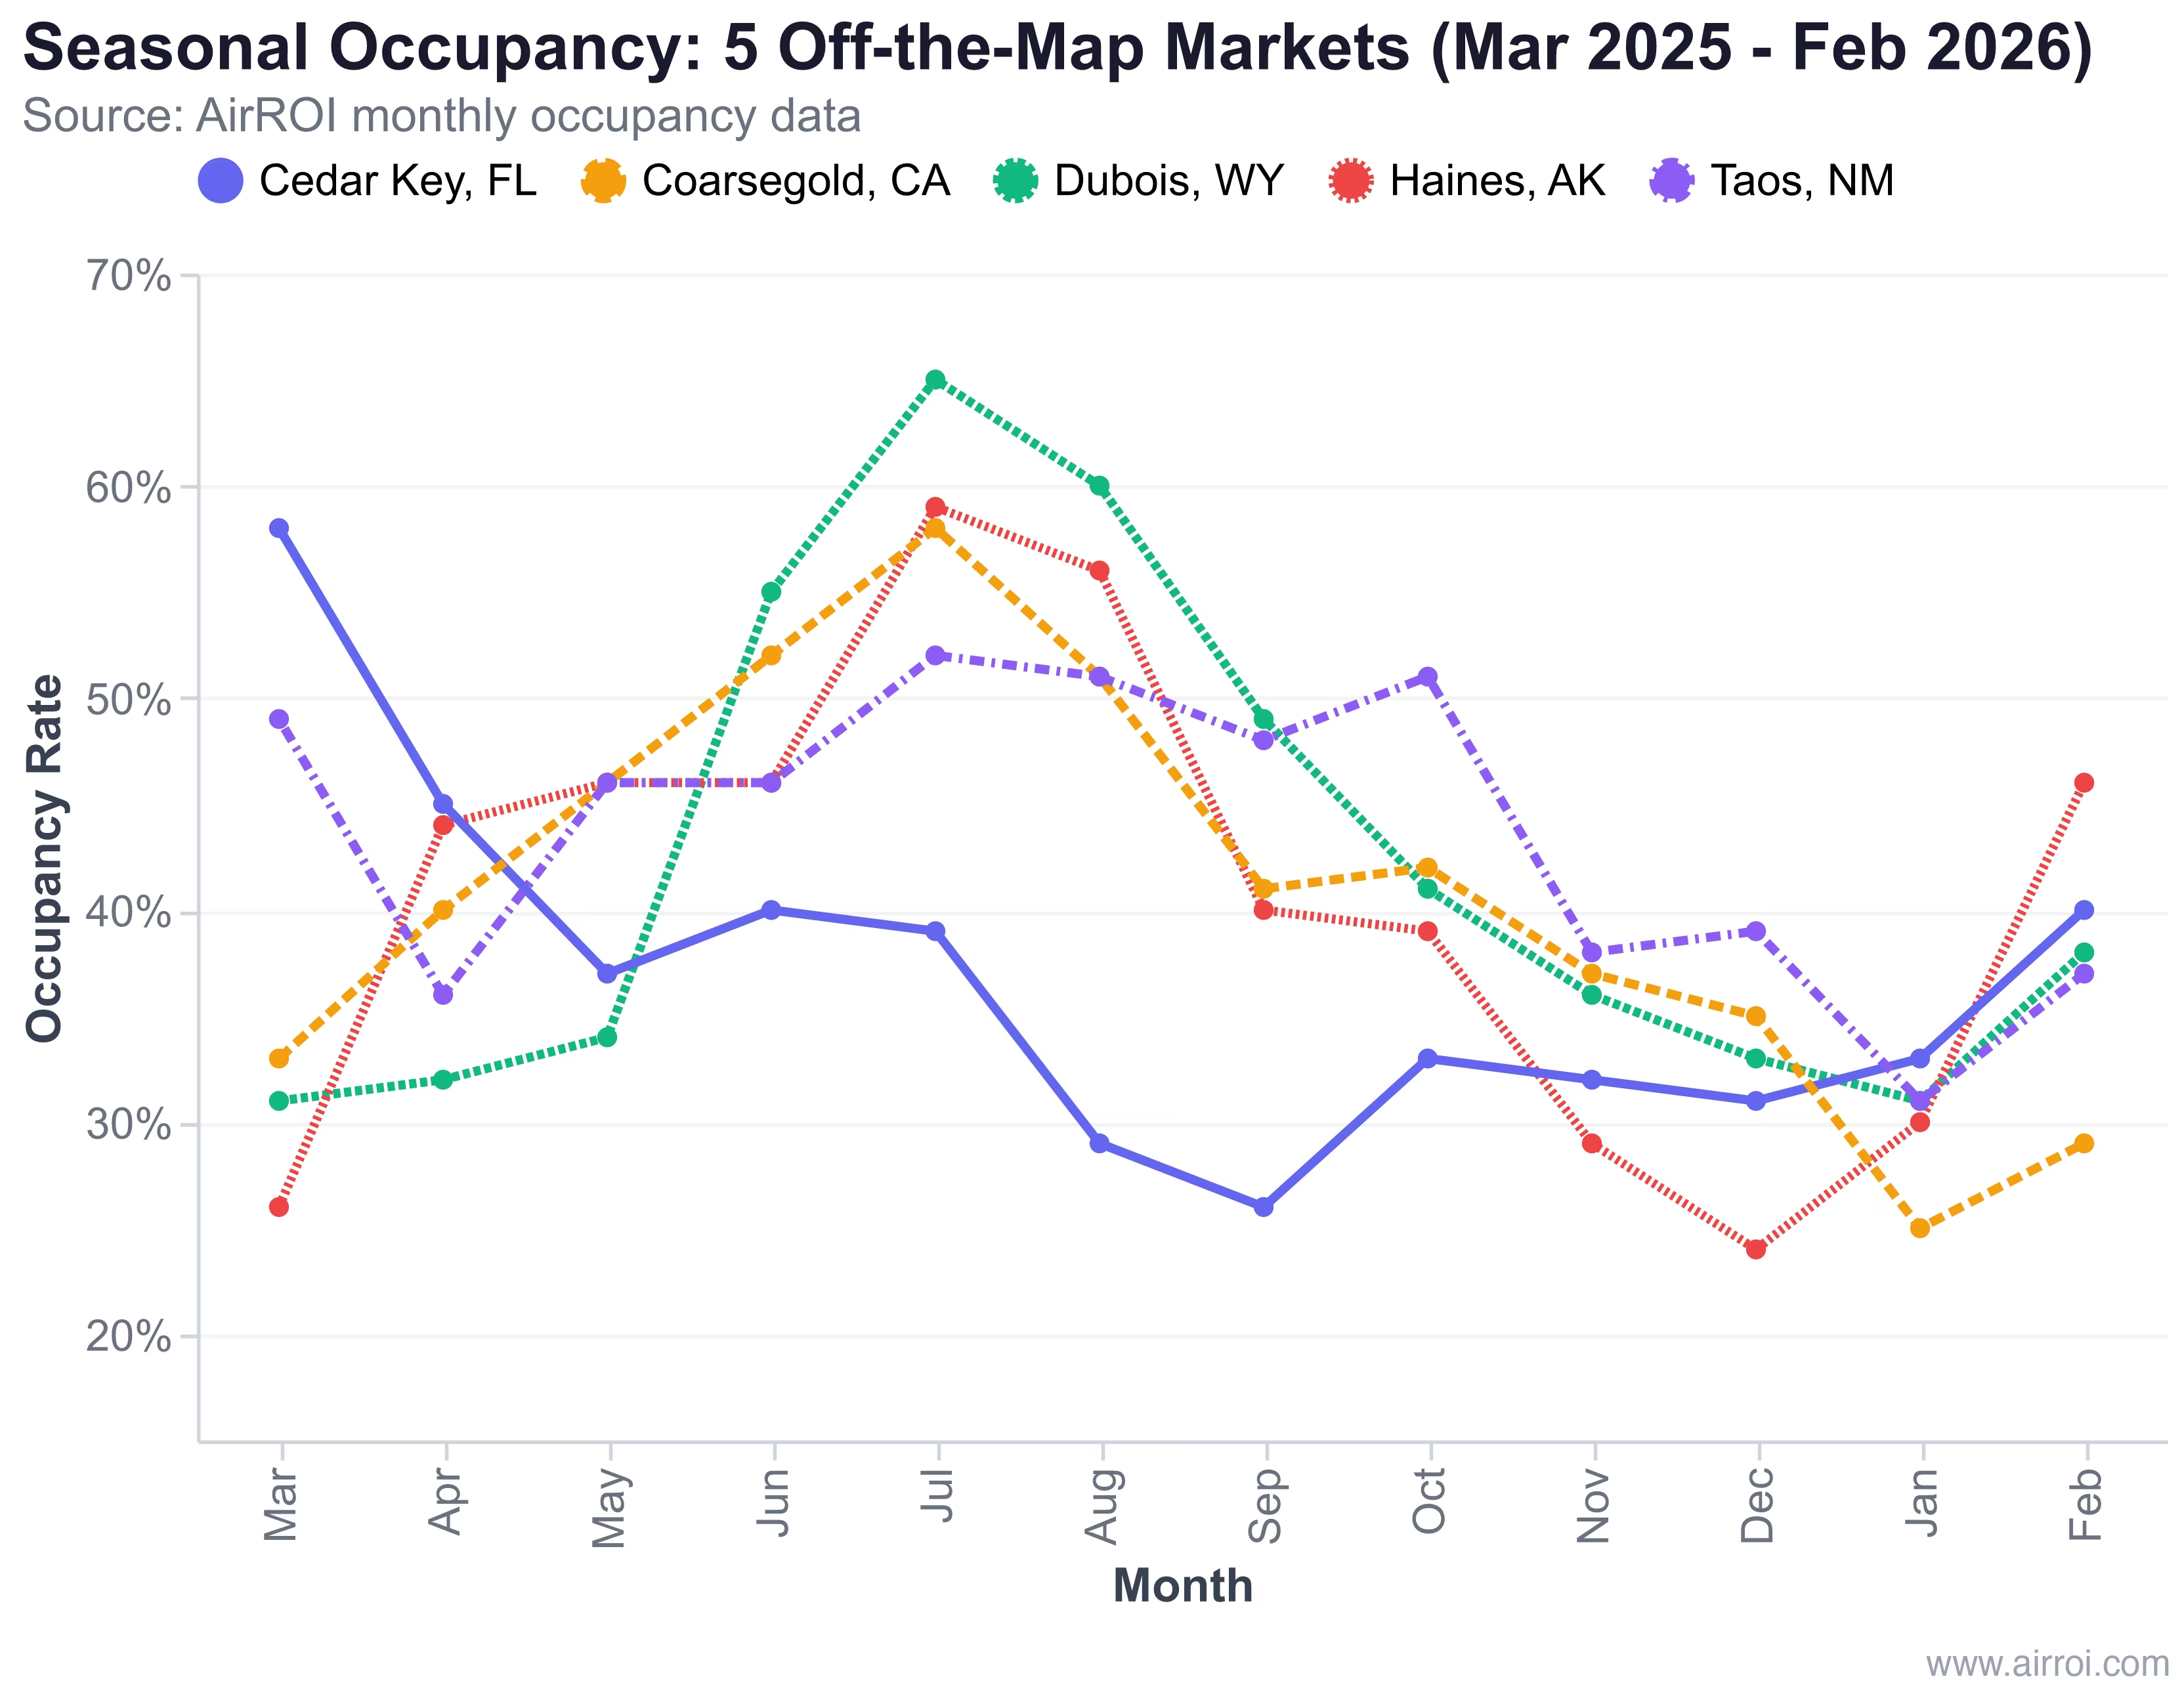
Taos, New Mexico stands out with the flattest seasonality curve at 1.7x -- its dual ski-season and summer-arts-season demand creates more balanced year-round bookings. This makes Taos the most operationally viable market for hosts who need consistent monthly cash flow.
Haines, Alaska represents the opposite extreme. Its 2.5x peak-to-trough ratio means hosts earn the bulk of annual revenue during July and August, with December occupancy dropping to 24%. An 80-day booking lead time suggests planned, bucket-list-type travel rather than spontaneous weekends -- strong for peak season pricing but useless for filling shoulder months.
Cedar Key, Florida follows a different seasonal pattern than the mountain markets, peaking in March (spring break) at 58% and cratering to 26% in September. Its hurricane-season trough is predictable but brutal for cash flow.
The investor's core question is not "what is the annual average?" but "can you survive 5-6 months of sub-35% occupancy while carrying mortgage, insurance, and maintenance costs?" According to Beyond Pricing's 2026 revenue strategy report, "Booking lead times continue to shrink across most markets, and that trend shows no signs of reversing" -- meaning shoulder seasons in rural markets are likely to soften further, not strengthen.
Supply Check: Thin Markets vs. Over-Supplied Markets
The Off-the-Map markets split into three supply categories, each carrying distinct risks.
Thin markets (under 30 listings): Monte Vista, CO (26 listings), Snowflake, AZ (26), and Fairview, UT (21) have so few active listings that market-level statistics are volatile. A single high-performing cabin can skew the median. These markets lack the comp-set depth needed for reliable pricing intelligence, and dynamic pricing tools provide limited value when fewer than 50 comparable properties exist.
Over-supplied markets: Cedar Key, FL stands out with 223 active listings but only 36% average occupancy -- a clear signal that supply has outpaced demand. The market is large enough for statistical reliability but competitive enough that new entrants face an uphill battle for bookings.
The 3 Markets That Actually Work (and Why)
Among the 20 Off-the-Map destinations, three generate returns that can justify investment under the right conditions. The common thread: proximity to a demand anchor that drives visitor traffic regardless of Airbnb's marketing.
Dubois, Wyoming -- The Yellowstone Value Play
Dubois sits in the Wind River Canyon between Yellowstone National Park and Jackson Hole. Properties here cost $250K-$400K versus $800K+ in Jackson, yet Dubois captures significant spillover demand with a $291 ADR and 72-day booking lead time -- the longest of any Off-the-Map market analyzed. At $30,997 median revenue, it is the only Off-the-Map destination where a median-performing property can plausibly cover investment costs on a moderately leveraged acquisition.
The catch: Revenue is concentrated in June through September. The p75 revenue tier (approximately $50K+) is where Dubois becomes genuinely profitable, requiring premium amenities, professional photography, and aggressive peak-season pricing.
Coarsegold, California -- The Yosemite Gateway Alternative
Coarsegold commands the highest ADR on the list at $365/night, driven by its position in the Sierra Nevada foothills roughly 20 miles from Yosemite National Park's south entrance. With 130 active listings and $26,263 median revenue, it offers a real alternative to the overcrowded gateway towns closer to the park. The 42-day booking lead time is shorter than Dubois's, reflecting more spontaneous, drive-to travel from California's Central Valley and Bay Area.
The catch: At 41% average occupancy, the market has room to grow but also room to disappoint. Winter months (January at 25%, February at 29%) represent a genuine revenue desert.
Taos, New Mexico -- The Multi-Season Outlier
Taos generates $19,628 in median revenue -- lower than Dubois or Coarsegold -- but its 1.7x seasonality ratio makes it the most operationally stable market on the list. Ski season, summer arts festivals, and fall foliage tourism create three demand peaks rather than one. With 318 active listings, it is the most competitive Off-the-Map market, but the competition reflects genuine year-round demand rather than oversupply.
The catch: The $239 ADR and 44% occupancy deliver a $97 RevPAR -- respectable but not exceptional. Taos works as a lifestyle investment with modest returns, not a high-yield play.
The Investor's Checklist: 5 Signals for Rural Market Viability
AirROI's analysis of the Off-the-Map data reveals five signals that separate investable rural markets from feel-good stories with thin economics.
1. Minimum 50 active listings. Markets with fewer than 50 listings (Monte Vista, Snowflake, Fairview) lack the data depth for reliable revenue projections. Individual listing performance is too volatile to model.
2. 40% or higher average annual occupancy. Below 40%, the gap between booked and available nights creates cash flow deficits that ADR alone cannot bridge. Six of the 10 Off-the-Map markets fall below or at this threshold.
3. $25,000+ median annual revenue. This figure must exceed total carrying costs (mortgage, insurance, property taxes, maintenance, cleaning, Airbnb fees, furnishing amortization). Only Dubois, Coarsegold, and Fairview clear this bar.
4. Peak-to-trough seasonality ratio under 2.0x. Markets above 2.0x require hosts to survive 5+ months of sub-35% occupancy. Only Taos (1.7x) meets this criterion. As Redfin chief economist Daryl Fairweather noted, "Tourism-driven destinations with year-round appeal, strong shoulder seasons, and resort areas sustain higher STR yields."
5. Demand anchor within 30 miles. Every top-performing Off-the-Map market sits near a national park, ski area, or cultural hub. Dubois has Yellowstone, Coarsegold has Yosemite, Taos has its ski valley and art scene. Markets without a demand anchor (Monte Vista, Snowflake, Matador) depend on the destination itself generating sufficient draw -- a far riskier proposition.
Bottom line: Airbnb's Off-the-Map list is a valuable discovery tool for travelers. For investors, it is a starting point that requires independent data verification. Of the 20 destinations highlighted, AirROI data supports 2-3 as potentially viable STR investments -- and even those demand premium execution to generate meaningful returns.
Frequently Asked Questions
No. The list identifies destinations with rising traveler interest, not investment viability. AirROI data shows median annual revenue across the 10 analyzable Off-the-Map markets ranges from $13,098 to $30,997, with only 2-3 generating returns that justify investment after carrying costs. Airbnb is a travel platform, not an investment advisor -- always verify revenue data independently before purchasing.
Dubois, Wyoming leads with $30,997 median annual revenue, a $291 average daily rate, and a 72-day booking lead time -- all driven by its position between Yellowstone National Park and Jackson Hole. However, its 2.1x peak-to-trough occupancy ratio means revenue is heavily concentrated in June through September.
Highly seasonal. AirROI data shows an average 2.2x peak-to-trough occupancy ratio across the 10 analyzed markets. Haines, Alaska is the most extreme at 2.5x (59% peak vs. 24% trough), while Taos, New Mexico has the flattest curve at 1.7x. Investors should model 12-month cash flow rather than annualized averages.
At typical rural ADRs of $150-$300 per night, sustained 45% or higher annual occupancy is the minimum threshold to cover mortgage, insurance, maintenance, and operating expenses on a standard investment property. Six of the 10 Off-the-Map markets analyzed by AirROI fall below this threshold.
Even the best-performing Off-the-Map market, Dubois, Wyoming at $30,997 median annual revenue, generates 59% of Sedona, Arizona's $52,553 benchmark. The gap is driven primarily by ADR -- Sedona commands $431 per night versus Dubois's $291 -- rather than occupancy, which is comparable at 44% vs. 52%.