National Park Airbnb Markets 2026: AirROI Data Reveals a 3.2x RevPAR Gap
Big Sky, Montana charges $802 per night — the highest average daily rate of any national park gateway market in the United States. Yet its 36% occupancy means most of those nights sit empty. Meanwhile, Bar Harbor, Maine fills 60% of its calendar at $422/night and books guests 95 days in advance. Both markets generate roughly $50,000 in annual revenue through fundamentally opposite strategies, revealing that the best national park Airbnb markets in 2026 are not interchangeable investments.
Airbnb's 2026 Travel Predictions Report confirms the broader trend: searches for stays near U.S. national parks surged 35%, outpacing urban and beach destinations. The Great Smoky Mountains is trending 135% among solo travelers. Nature and outdoor experiences have become the platform's top-booked experience category, fueled by the TikTok-driven "touch grass" movement (85,000+ posts with #touchgrass) and landmark park centennials coinciding with America's semiquincentennial.
But a 35% search increase does not mean every park-adjacent market delivers equal returns. AirROI data across seven gateway markets — spanning 13,634 active listings — reveals a 3.2x RevPAR gap between the highest and lowest performers. This analysis ranks those markets by revenue, occupancy, ADR, seasonality, and saturation risk to identify where the data supports investment and where it urges caution.
The 2026 National Park Demand Surge: What Is Driving 35% Search Growth
Three forces are converging to push national park STR demand to record levels in 2026.
Remote work extends shoulder seasons. The continued normalization of remote work enables longer stays in gateway markets. AirROI data shows average length of stay across these seven markets ranges from 2.9 nights (Joshua Tree) to 6.9 nights (Bar Harbor), with Bar Harbor's extended stays suggesting a segment of guests who work remotely while visiting Acadia National Park.
7 National Park Gateway Markets Ranked by Revenue
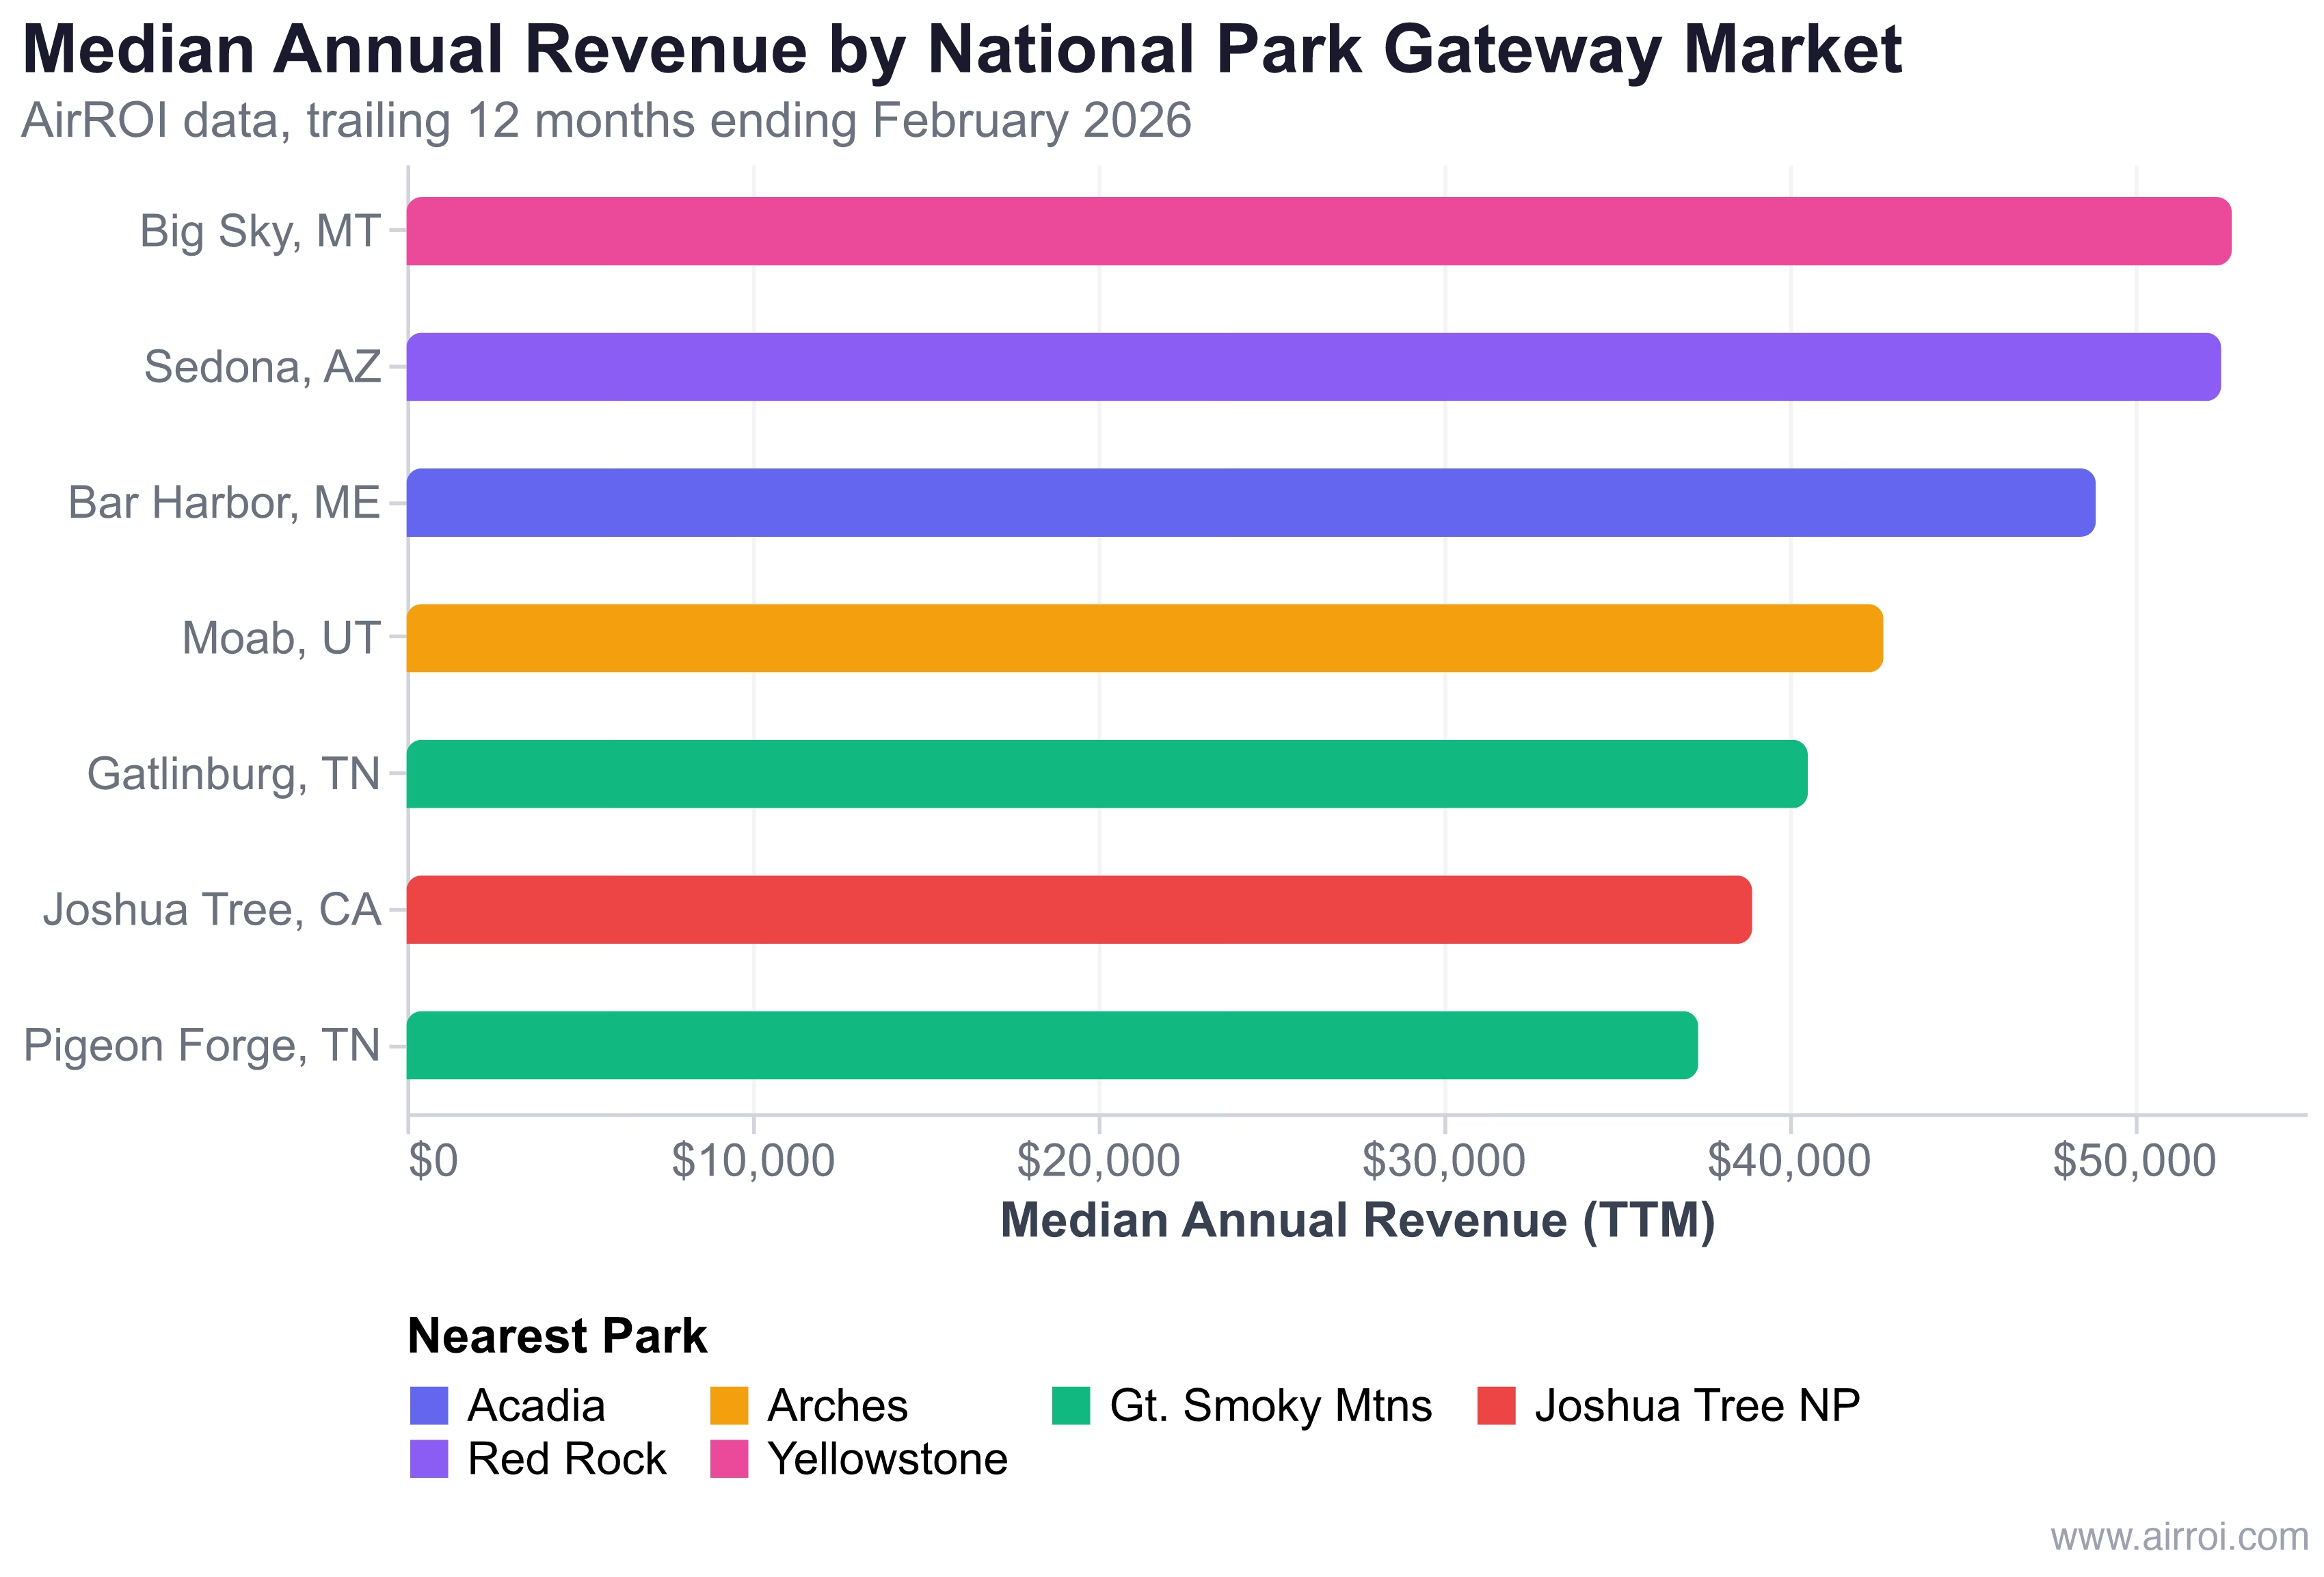
AirROI data for the trailing twelve months ending February 2026 reveals significant performance variation across the seven best Airbnb markets near national parks:
| Market | Park | Occupancy | ADR | RevPAR | Annual Revenue | Listings | Lead Time |
|---|---|---|---|---|---|---|---|
| Big Sky, MT | Yellowstone/Gallatin | 36% | $802 | $275 | $52,859 | 1,063 | 78 days |
| Sedona, AZ | Red Rock Country | 52% | $431 | $230 | $52,553 | 1,765 | 57 days |
| Bar Harbor, ME | Acadia | 60% | $422 | $270 | $48,922 | 527 | 95 days |
| Moab, UT | Arches/Canyonlands | 50% | $327 | $164 | $42,775 | 1,047 | 62 days |
| Gatlinburg, TN | Great Smoky Mtns | 48% | $367 | $177 | $40,582 | 3,787 | 56 days |
| Joshua Tree, CA | Joshua Tree NP | 48% | $336 | $170 | $38,970 | 1,276 | 36 days |
| Pigeon Forge, TN | Great Smoky Mtns | 47% | $353 | $166 | $37,408 | 3,169 | 57 days |
The data reveals three distinct gateway market archetypes:
High-ADR, low-occupancy (Big Sky). At $802 per night, Big Sky's ADR is nearly double the next-closest market. Luxury ski properties and proximity to Yellowstone National Park command premium pricing, but 36% occupancy means hosting fewer than 132 booked nights per year. Revenue concentrates heavily in December through March ski season.
High-occupancy, moderate-ADR (Bar Harbor). Bar Harbor achieves the highest occupancy (60%) with just 527 active listings — the smallest supply in the dataset. Its 95-day booking lead time is the longest, indicating guests plan Acadia visits well in advance. This combination of strong demand, limited supply, and advance booking creates predictable cash flow.
Balanced performance (Sedona). Sedona delivers $52,553 in annual revenue by maintaining both above-average occupancy (52%) and ADR ($431). As of March 23, 2026, AirROI pacing data shows Sedona at a 99% fill rate for the current week — the tightest market in the dataset for spring bookings.
Smoky Mountains: Gatlinburg vs. Pigeon Forge
The Great Smoky Mountains market deserves special attention because Gatlinburg and Pigeon Forge combined host 6,956 active listings — more than all other five gateway markets in this analysis combined (5,678 total).
Gatlinburg commands a 4% ADR premium ($367 vs. $353) and generates 7% higher RevPAR ($177 vs. $166) than neighboring Pigeon Forge. The premium reflects Gatlinburg's position as the primary park gateway, with direct access to the most-visited national park in America. Yet both markets generate relatively similar per-listing revenue ($40,582 vs. $37,408), suggesting that the Smoky Mountains' massive tourism volume — 11.5 million visitors annually — absorbs the region's large supply base.
The Seasonality Risk: How Concentrated Are Your Earnings
Seasonality is the defining risk factor in national park STR markets. Annual revenue figures mask dramatic month-to-month swings that determine whether an investment cash-flows year-round or requires reserve capital to survive the off-season.
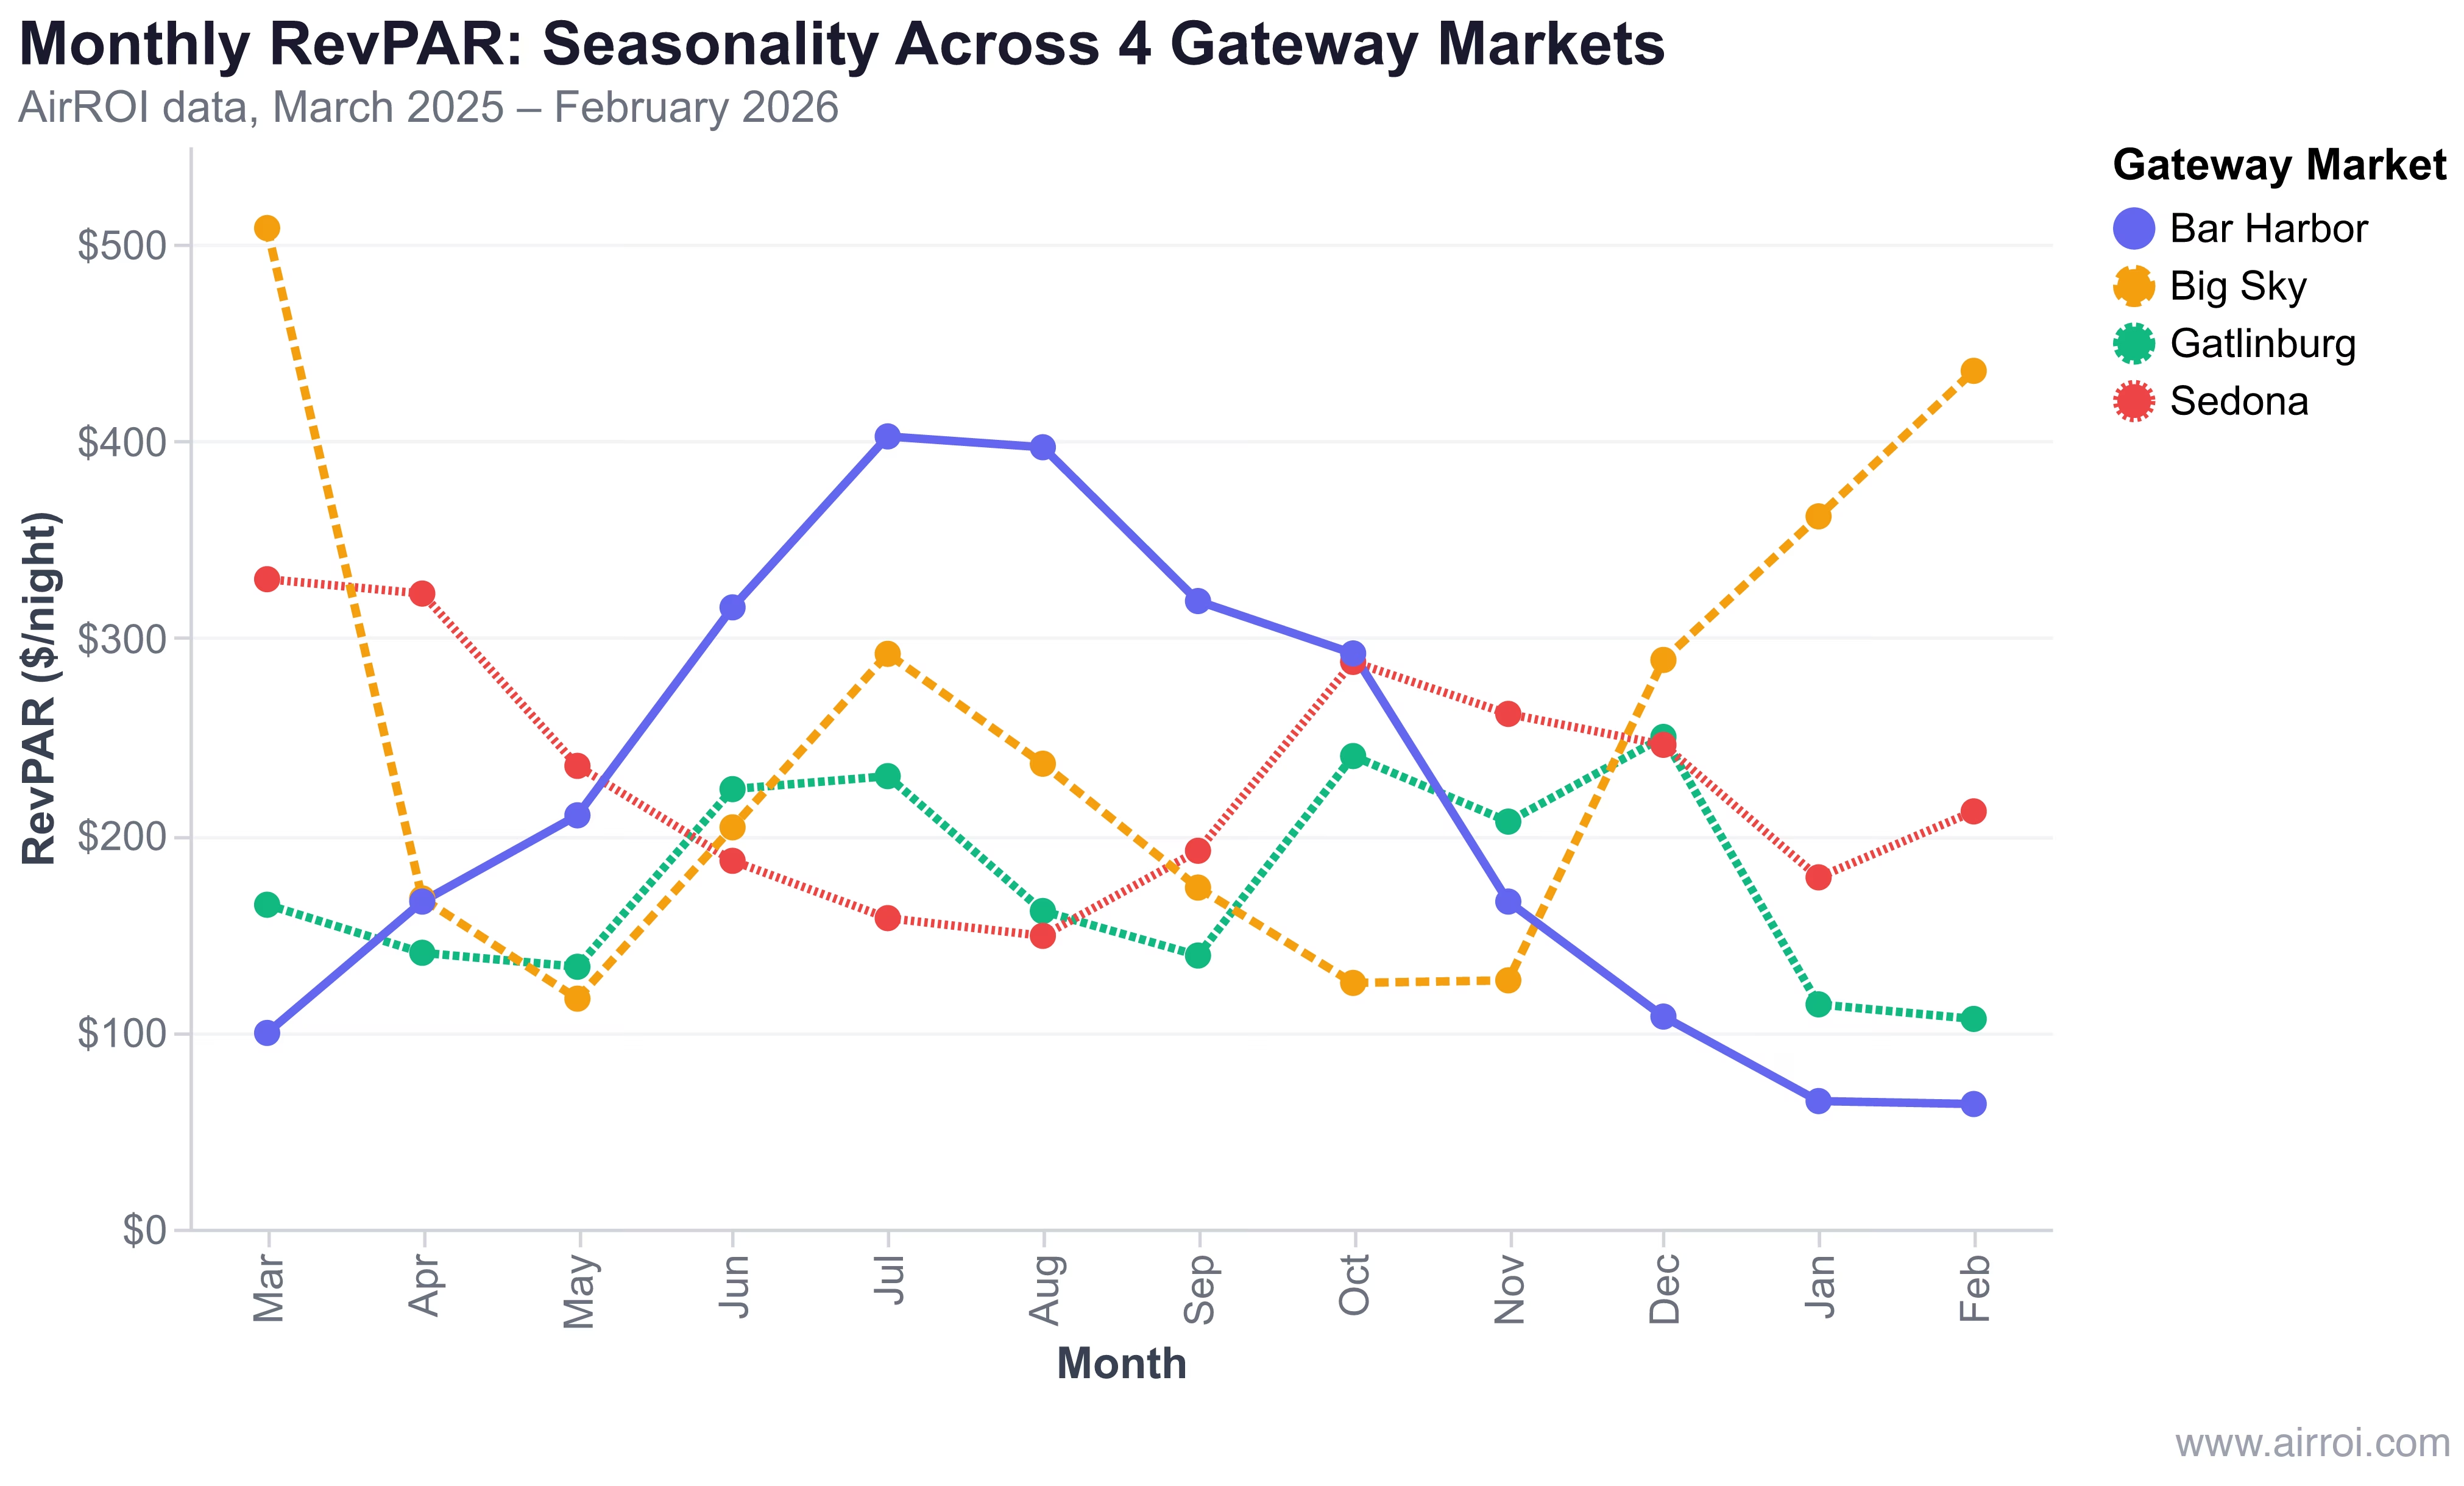
Peak-to-trough RevPAR ratios across four key markets:
| Market | Peak Month | Peak RevPAR | Trough Month | Trough RevPAR | Ratio |
|---|---|---|---|---|---|
| Bar Harbor | July | $402 | February | $63 | 6.4x |
| Big Sky | March | $508 | May | $117 | 4.3x |
| Gatlinburg | December | $250 | February | $107 | 2.3x |
| Sedona | March | $330 | August | $149 | 2.2x |
Bar Harbor operates two completely different businesses. From June through October, it is a premium vacation market with $315-$402 RevPAR and 66-77% occupancy. From November through March, occupancy drops below 33% and RevPAR falls to $64-$107. An investor underwriting Bar Harbor at its summer performance would overestimate annual returns by 40-60%.
Big Sky's ski season concentration creates lumpy revenue. The March peak ($508 RevPAR, $15,750 average monthly revenue) is 4.3x the May trough ($117 RevPAR, $3,619). December and January ski months also command $1,000+ ADRs. Summer brings moderate recovery (July RevPAR: $292), but the shoulder seasons (April-May, October-November) are effectively dead at 22-28% occupancy.
Sedona offers the most balanced seasonality. Its 2.2x peak-to-trough ratio is the narrowest, with no month falling below $149 RevPAR. The spring peak (March-April at $322-$330 RevPAR) and fall recovery (October at $288) create two revenue seasons, while winter remains viable at $178-$212 RevPAR thanks to year-round red rock tourism.
Supply Signals: Which Markets Are Oversaturated vs. Undersupplied
Supply growth is the variable that separates a profitable gateway market from a crowded one. AirROI data reveals distinct supply profiles across these seven markets:
| Market | Active Listings | Supply Signal | Regulatory Environment |
|---|---|---|---|
| Bar Harbor | 527 | Naturally constrained | Limited by town character |
| Moab | 1,047 | Regulatory cap | Moratorium on new STR construction |
| Big Sky | 1,063 | Resort-controlled | Minimal regulation in resort zones |
| Joshua Tree | 1,276 | Permit-limited | County requires permits, inspections, TOT |
| Sedona | 1,765 | Growing + housing concerns | Under scrutiny for housing affordability |
| Pigeon Forge | 3,169 | Mature, stable | STR-friendly open market |
| Gatlinburg | 3,787 | Mature, stable | STR-friendly open market |
Bar Harbor's supply constraint is its greatest asset. With just 527 listings serving Acadia's tourism base, Bar Harbor maintains the highest occupancy (60%) and longest lead time (95 days) in the dataset. Adding new supply requires navigating a market with limited buildable land and strong community preservation norms.
Moab's regulatory moat protects existing operators. The city's moratorium on new STR construction, combined with zoning that restricts short-term rentals to resort zones or grandfathered properties, creates a hard supply cap. Operating without a license is a Class A misdemeanor. For existing permitted operators, this means less competition even as Arches and Canyonlands visitor counts grow. Moab's 1,047 listings generate $42,775 in median revenue — a strong yield given its moderate $327 ADR.
Joshua Tree's short lead time warrants scrutiny. At 35.5 days, Joshua Tree's booking lead time is nearly half the dataset average (63 days) and less than 40% of Bar Harbor's 95 days. Shorter lead times can indicate either a last-minute booking culture (common for drive-to desert destinations from LA) or softening advance demand. San Bernardino County's permit requirements and potential licensing caps add regulatory friction that investors should verify before entering.
Summer 2026 Pacing: Which Park Markets Are Already Filling
Forward-looking pacing data adds a real-time demand layer that historical metrics cannot provide. As of March 23, 2026, AirROI data shows sharp differences in how quickly these markets are filling for the coming months.
Sedona is sold out for spring. The market's fill rate stands at 96-100% through late March, with weekend dates exceeding 100% (indicating more booked listings than currently available inventory due to block releases). Booked rates average $505-$577/night — a 10-15% premium over available rates, confirming that early bookers paid more and demand justified the price.
Gatlinburg weekends are heating up. Spring weekend fill rates reach 61-69% (March 28-31), while midweek dates sit at 36-41%. By June, weekday fill rates climb to 20-26% with booked ADRs of $467-$544 — well above the $384-$434 available rates. This gap between booked and available rates suggests hosts should consider raising prices for remaining summer inventory.
How to Evaluate a National Park Gateway Market Before Buying
Based on AirROI data across these seven markets, five metrics separate strong gateway market investments from underperformers:
1. RevPAR over ADR or occupancy alone. Big Sky's $802 ADR looks impressive until you multiply by 36% occupancy to get $275 RevPAR. Bar Harbor's more modest $422 ADR at 60% occupancy produces $270 RevPAR — nearly identical effective yield with far less seasonal risk. Always evaluate RevPAR as the primary efficiency metric.
2. Seasonality ratio under 3x. Markets with peak-to-trough RevPAR ratios above 3x (Big Sky at 4.3x, Bar Harbor at 6.4x) require reserve capital to cover off-season mortgage and maintenance costs. Sedona's 2.2x ratio and Gatlinburg's 2.3x ratio offer more predictable cash flow.
3. Booking lead time above 50 days. Longer lead times signal sticky advance demand. Bar Harbor (95 days), Big Sky (78 days), and Moab (62 days) all exceed the 50-day threshold. Joshua Tree's 35.5-day lead time is the shortest — a flag that warrants deeper analysis.
4. Supply growth vs. revenue growth. Gatlinburg's listing count has plateaued near 3,800, suggesting the market has absorbed its supply cycle. Markets where listing growth outpaces revenue growth — watch for occupancy below 45% alongside double-digit supply increases — are compressing RevPAR.
5. Regulatory environment. Moab's STR moratorium protects existing operators; Gatlinburg's open policy means unlimited competition. Neither is inherently better — the question is whether regulations create a barrier that benefits your position or blocks your entry.
Investor takeaway: The strongest risk-adjusted returns in 2026 come from gateway markets that combine moderate seasonality (under 3x peak-to-trough), stable or constrained supply, and booking lead times above 50 days. By these criteria, Sedona, Gatlinburg, and Bar Harbor stand out — each for different reasons.
Frequently Asked Questions
Big Sky, Montana ($52,859) and Sedona, Arizona ($52,553) lead in median annual STR revenue among the seven gateway markets analyzed. Big Sky achieves this through an $802 average daily rate at 36% occupancy, while Sedona balances a $431 ADR with 52% occupancy. Bar Harbor, Maine rounds out the top three at $48,922 with the highest occupancy rate (60%) and smallest competitive set (527 listings).
National park gateway markets are highly seasonal. AirROI data shows Bar Harbor's peak-to-trough RevPAR ratio reaches 6.4x (July's $402/night vs. February's $63), while Big Sky's ratio is 4.3x (March ski season vs. May shoulder). Sedona has the most balanced seasonality at 2.2x. Investors should model 12-month cash flow, not annualized averages, before committing.
It varies by market. Gatlinburg's supply has plateaued near 3,800 listings, suggesting maturation rather than runaway growth. Moab's moratorium on new STR construction creates a regulatory supply cap at 1,047 listings. Joshua Tree's 35.5-day booking lead time — the shortest in the dataset — may signal softening demand relative to supply. Use AirROI Atlas to check current supply trends for any market.
Booking lead times range from 35.5 days in Joshua Tree to 95.1 days in Bar Harbor. Longer lead times indicate stronger advance demand and give hosts more time to optimize pricing. Bar Harbor's 95-day average reflects Acadia visitors planning summer trips months ahead, while Joshua Tree's shorter window suggests more spontaneous, weekend-trip bookings from nearby Los Angeles and San Diego.
Hot tubs deliver the strongest revenue premium in mountain gateway markets. AirROI data shows Gatlinburg listings with hot tubs earn 121% more annual revenue than comparable listings without one — a $25,043 difference. Fireplaces, game rooms, and scenic decks also drive meaningful premiums in park-adjacent markets where guests prioritize atmosphere and relaxation over urban convenience.