
Airbnb Tax Burden by Market: How Taxes Flip the Best STR Investment Rankings in 2026
A Gatlinburg cabin earning $52,125 in annual Airbnb tax-relevant revenue and a San Diego condo earning $58,967 end up with roughly the same after-tax income -- about $38,700 vs. $38,900 -- after state income tax, occupancy tax, property tax, and self-employment tax are all applied. The California tax stack erases nearly all of San Diego's $6,842 gross-revenue advantage. Every "best Airbnb market" ranking published in 2026 shares the same blind spot: none of them subtract state income tax, local occupancy tax, or property tax from gross revenue. Revenue is not income. And the market that generates the most revenue is often not the market that generates the most after-tax income.
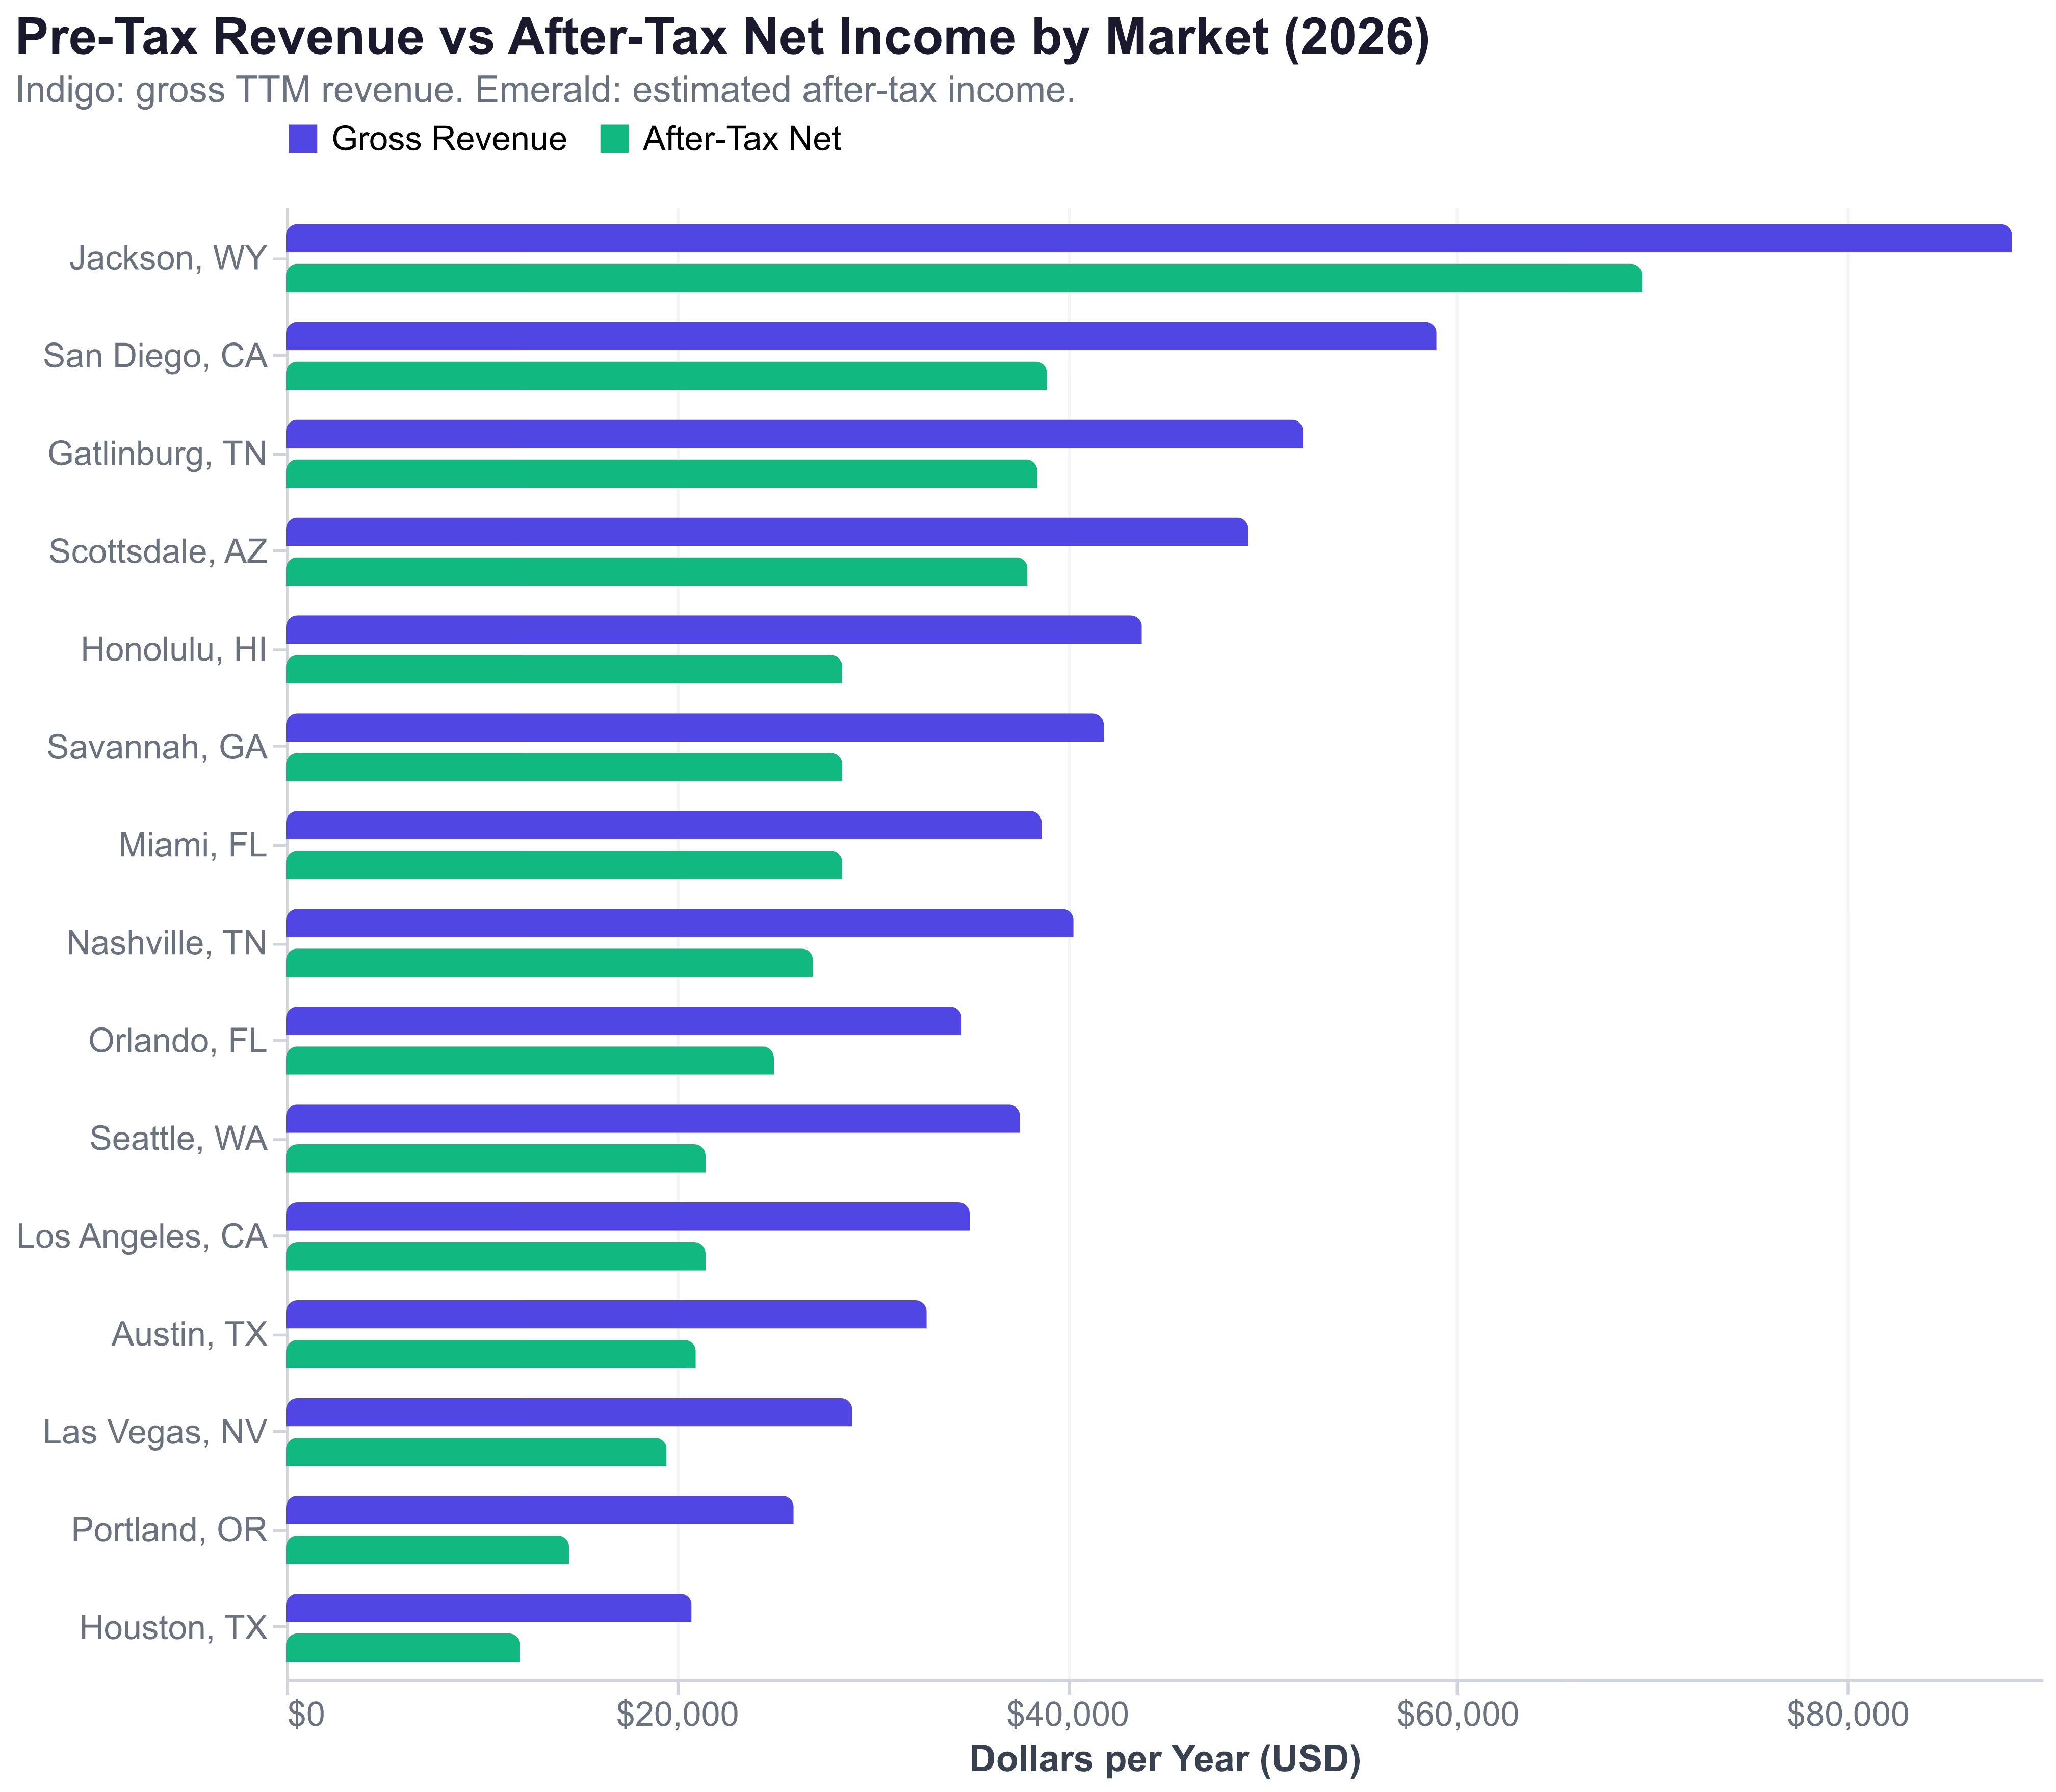
AirROI data across 15 US markets reveals that airbnb taxes by state create after-tax income gaps exceeding $57,000 per year between the top and bottom markets. A host in Jackson, Wyoming keeps approximately $69,500 of their $88,458 in annual revenue. A host in Houston keeps roughly $12,000 of their $20,785. Same industry, same platform, radically different tax jurisdictions.
The Three Tax Layers Every STR Investor Faces
The total short-term rental tax burden ranges from approximately 15% of gross revenue in low-tax states to over 35% in high-tax states. Three distinct tax layers stack on top of federal income tax, and each varies independently by jurisdiction.
Layer 1: State Income Tax (0% to 13.3%). Nine states charge zero state income tax on STR earnings: Alaska, Florida, Nevada, New Hampshire, South Dakota, Tennessee, Texas, Washington, and Wyoming. At the other extreme, California's top marginal rate reaches 13.3%, Hawaii hits 11%, and Oregon reaches 9.9%. On $50,000 in net STR income, the state income tax alone ranges from $0 (Tennessee) to $6,650 (California).
Layer 4: Self-Employment Tax (14.1% effective). This federal tax applies to all STR operators who materially participate, regardless of state. At 15.3% on net self-employment income (12.4% Social Security plus 2.9% Medicare), with a 50% employer-equivalent deduction, the effective rate is approximately 14.1%. On $40,000 in net STR income, self-employment tax adds $5,640. This is the one tax layer that zero-income-tax states cannot eliminate.
| Tax Layer | Low End | High End | Who Sets It |
|---|---|---|---|
| State Income Tax | 0% (9 states) | 13.3% (CA) | State legislature |
| Occupancy/Lodging Tax | ~6% (FL, AZ) | ~23.6% (Seattle) | City/County |
| Property Tax | 0.296% (Scottsdale) | 2.45% (NJ cities) | County assessor |
| Self-Employment Tax | 14.1% effective | 14.1% effective | Federal (IRS) |
The 2026 After-Tax Airbnb Income Scorecard: 15 Markets Ranked
The scorecard below combines AirROI trailing-twelve-month revenue data with estimated tax burdens to rank 15 US markets by airbnb after-tax income. Operating expenses are excluded to isolate the tax impact. All revenue figures are median TTM values from AirROI as of April 2026. Tax estimates assume a single-filer with STR income as the primary income source.
| Rank | Market | State | TTM Revenue | State Income Tax | Occupancy Tax | Est. Property Tax | Est. After-Tax Net |
|---|---|---|---|---|---|---|---|
| 1 | Jackson, WY | Wyoming | $88,458 | 0% | ~6% | $2,120 | ~$69,500 |
| 2 | San Diego, CA | California | $58,967 | Up to 13.3% | ~10.5% | $2,800 | ~$39,000 |
| 3 | Gatlinburg, TN | Tennessee | $52,125 | 0% | ~9.75% | $1,960 | ~$38,500 |
| 4 | Scottsdale, AZ | Arizona | $49,316 | 2.5% flat | ~5.6% | $1,184 | ~$38,000 |
| 5 | Honolulu, HI | Hawaii | $43,863 | Up to 11% | ~14% | $1,400 | ~$28,500 |
| 6 | Savannah, GA | Georgia | $41,909 | 5.49% flat | ~8% | $3,520 | ~$28,500 |
| 7 | Miami, FL | Florida | $38,726 | 0% | ~6% | $3,360 | ~$28,500 |
| 8 | Nashville, TN | Tennessee | $40,361 | 0% | ~16.25% | $2,120 | ~$27,000 |
| 9 | Orlando, FL | Florida | $34,621 | 0% | ~6% | $3,360 | ~$25,000 |
| 10 | Seattle, WA | Washington | $37,614 | 0% | ~23.6% | $3,720 | ~$21,500 |
| 11 | Los Angeles, CA | California | $35,039 | Up to 13.3% | ~14% | $2,800 | ~$21,500 |
| 12 | Austin, TX | Texas | $32,833 | 0% | ~9% | $5,440 | ~$21,000 |
| 13 | Las Vegas, NV | Nevada | $29,012 | 0% | ~13.38% | $2,440 | ~$19,500 |
| 14 | Portland, OR | Oregon | $26,017 | Up to 9.9% | ~11.5% | $4,320 | ~$14,500 |
| 15 | Houston, TX | Texas | $20,785 | 0% | ~7% | $5,440 | ~$12,000 |
Note: Revenue figures are TTM averages for entire-home listings via AirROI's market_summary endpoint. After-tax estimates assume federal SE tax of 14.1% on net income, state income tax at the applicable marginal rate (California 9.3% bracket), occupancy tax on gross revenue, and property tax on a $400K property. Operating expenses excluded to isolate tax impact.
The most striking finding: San Diego barely holds 2nd. Its $6,842 gross-revenue advantage over Gatlinburg nearly evaporates to about $200 in after-tax net, and Scottsdale -- earning $9,651 less than San Diego on gross -- keeps only $1,000 less after taxes. Orlando climbs from 11th on gross revenue to 9th after-tax, leapfrogging both Seattle and Los Angeles thanks to Florida's zero income tax and Orlando's 6% occupancy tax. Miami climbs from 8th to 7th, edging Nashville despite earning $1,635 less on gross -- Nashville's 16.25% occupancy tax is the single biggest drag on an otherwise zero-income-tax market. Los Angeles falls from 10th to 11th, and Seattle drops from 9th to 10th, both losing ground to Orlando. Honolulu holds its 5th rank but only barely, keeping just $292 more than Savannah despite earning $1,954 more on gross -- Hawaii's 11% top income tax and 14% Oahu occupancy tax nearly erase its revenue lead. The reshuffle is less dramatic than gross-revenue-only analyses often imply, but the margins compress enough that tax jurisdiction can flip close calls between otherwise comparable markets.
Zero Income Tax States: The $5,000/Year Tax-Free Advantage
For STR investors, the math is straightforward. A host generating $50,000 in net STR income in Tennessee pays $0 in state income tax. The same income in California faces approximately $3,000-$5,000 in state income tax at ordinary marginal rates (6-9.3% bracket), or up to $6,650 at the 13.3% top rate for high-income filers. Over a 10-year hold, that single tax layer creates a $30,000-$66,500 cumulative difference.
But zero income tax does not mean zero tax burden. Each tax-free state compensates with different revenue sources:
- Texas: 0% income tax, but property taxes average 1.36% -- the sixth-highest in the US. A $400,000 Houston STR pays $5,440 annually in property taxes alone. Houston's TTM revenue of only $20,785 means roughly a quarter of gross revenue goes to property tax.
- Washington: 0% income tax, but Seattle stacks lodging taxes totaling approximately 23.6%. A Seattle host generating $37,614 in annual revenue pays roughly $8,877 in occupancy taxes before any other tax obligation -- enough that Seattle's after-tax net is only marginally above Los Angeles (~$21,500 each) despite Washington's zero-income-tax status versus California's 9.3% marginal rate.
- Tennessee: 0% income tax with moderate property taxes (0.49% effective). Gatlinburg's combined occupancy and sales tax of approximately 9.75% is moderate for a major tourist destination, but Nashville's 16.25% rate pushes it near the bottom of the after-tax rankings despite a higher gross. Gatlinburg keeps approximately $38,500 of its $52,125 TTM revenue -- a 74% retention rate.
- Florida: 0% income tax with moderate property taxes (0.84% average). Miami's occupancy tax of approximately 6% is remarkably low for a global destination. Orlando benefits from the same structure.
- Wyoming: 0% income tax with low property taxes (0.53%). Jackson's $88,458 TTM revenue is the highest of any market analyzed, and the tax burden is among the lowest. Jackson hosts retain about 79% of gross revenue after taxes -- the highest retention rate of any market. The constraint is entry price -- median home values exceed $1.5 million.
Head-to-Head: Gatlinburg, TN vs. San Diego, CA
| Dimension | Gatlinburg, TN | San Diego, CA |
|---|---|---|
| TTM Revenue | $52,125 | $58,967 |
| State Income Tax | $0 | ~$3,992 |
| Occupancy Tax (on gross) | ~$5,082 | ~$6,192 |
| Property Tax ($400K) | ~$1,960 | ~$2,800 |
| Self-Employment Tax | ~$6,357 | ~$7,046 |
| Est. After-Tax Net | ~$38,726 | ~$38,937 |
| Effective Tax Rate | 25.7% | 34.0% |
The comparison is closer than gross revenue alone would suggest. San Diego generates $6,842 more in gross revenue than Gatlinburg, but after California's tax stack absorbs nearly all of that advantage, San Diego's after-tax lead shrinks to roughly $211 -- essentially a tie. What looks like a $6,842 revenue premium on the Airbnb dashboard becomes a negligible after-tax differential. For a Tennessee host, that means roughly 97% of San Diego's after-tax income with meaningfully lower entry cost, lower operating complexity, and zero state-tax compliance burden. The takeaway is not that Gatlinburg beats San Diego on absolute dollars -- at these numbers, it doesn't. The takeaway is that gross revenue premiums in high-tax states are a mirage: California's 34.0% effective total-tax rate consumes virtually the entire revenue advantage San Diego enjoys over Tennessee. The same $6,842 gap in a zero-tax state would produce roughly $5,000 more in after-tax income; in California, it produces $211.
Occupancy Tax: The Hidden Variable From 6% to 23.6%
Local airbnb occupancy tax rates vary by more than 400% across US cities, and most investors never check before purchasing. Unlike state income tax, which appears in every tax planning article, occupancy tax rates are buried in municipal code and change frequently.
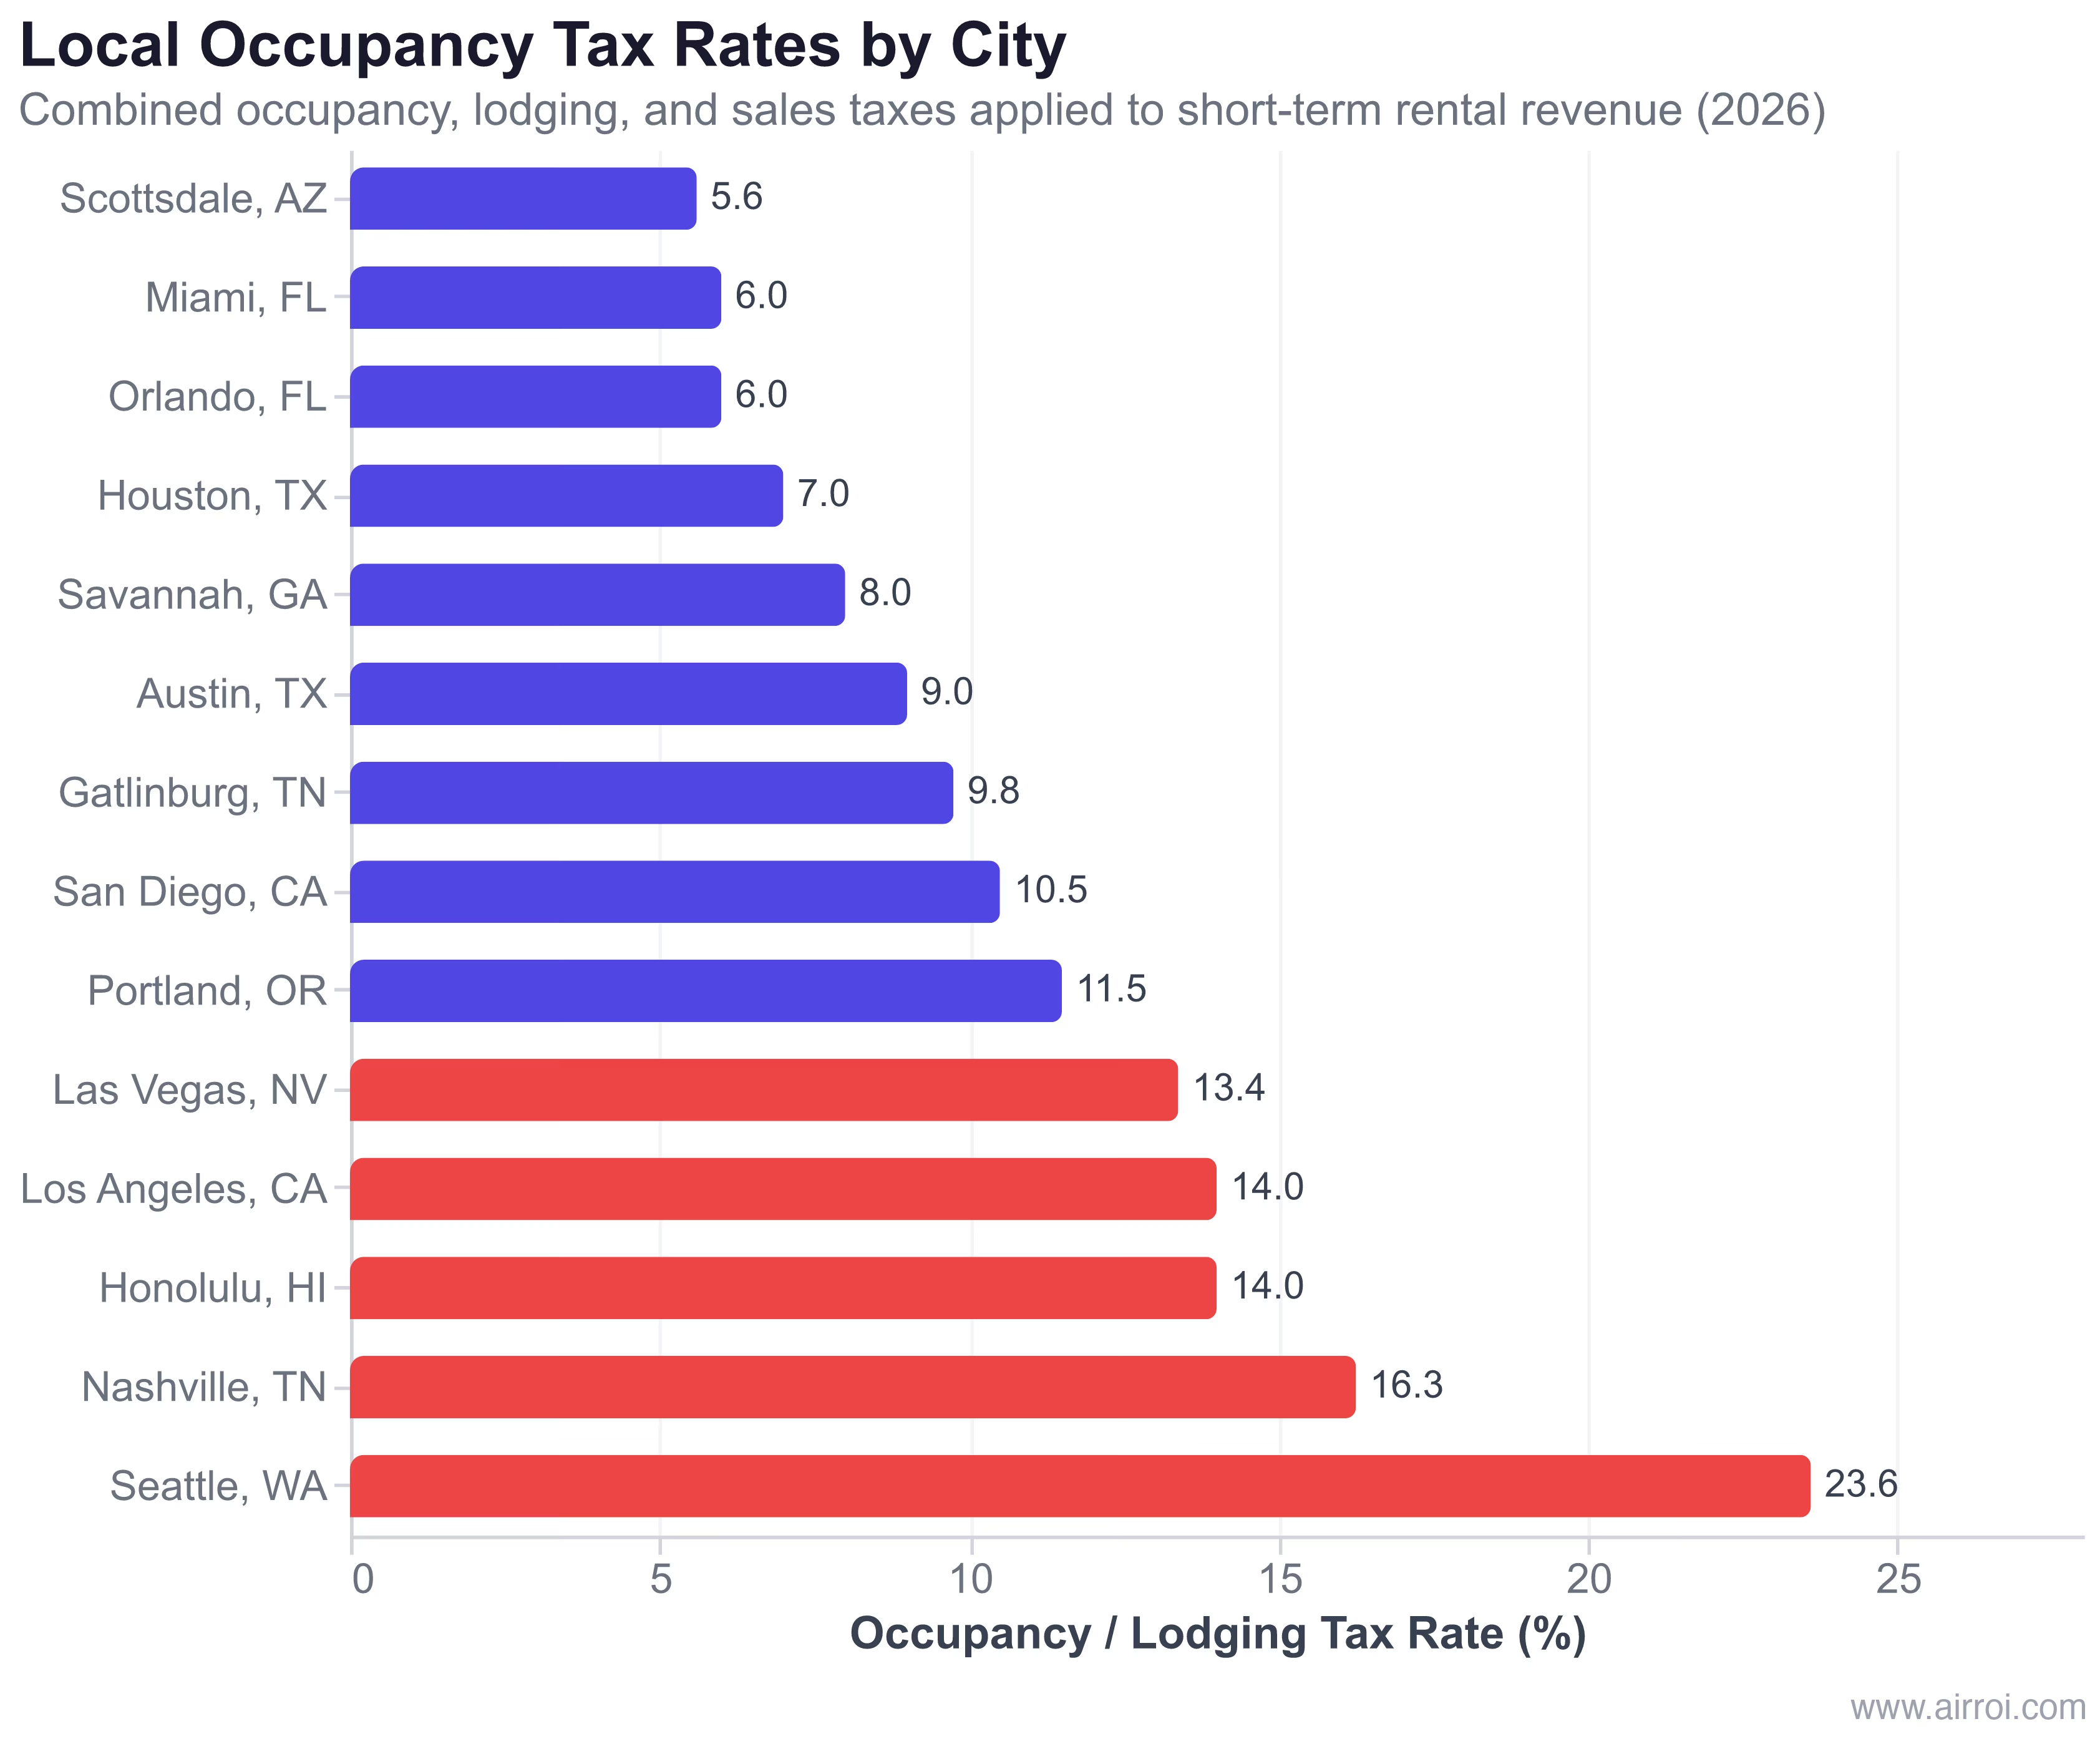
According to Shared Economy Tax, occupancy tax rates "vary widely by location but typically range from 6% to 15% of gross rental revenue." But the Seattle and Nashville examples show that the actual ceiling exceeds 20% when multiple local levies stack.
When Taxes Flip the Investment Ranking
This is the core finding that makes short-term rental tax comparison essential: markets that rank highest on gross revenue frequently drop several positions when taxes are factored in.
Flip 1: Scottsdale nearly catches San Diego. San Diego generates $58,967 in TTM revenue versus Scottsdale's $49,316 -- a $9,651 pre-tax advantage for San Diego. But California's 9.3% marginal income tax, San Diego's 10.5-13.75% TOT, and higher property taxes collapse most of that gap. After taxes, Scottsdale keeps approximately $38,000 versus San Diego's $39,000 -- San Diego's $9,651 gross lead shrinks to roughly $1,000 in after-tax net. Arizona's 2.5% flat income tax and 0.3% property tax do the heavy lifting, delivering 77% of San Diego's after-tax income on 84% of its gross revenue.
Flip 2: Gatlinburg closes to a tie with San Diego. San Diego generates $58,967 to Gatlinburg's $52,125 -- a $6,842 gross revenue advantage for San Diego. After all four tax layers, San Diego's lead evaporates to roughly $211, effectively a statistical tie ($38,937 vs. $38,726). California's 34.0% effective total-tax rate consumes almost the entire $6,842 revenue premium, leaving the Tennessee property competitive on after-tax income with meaningfully lower entry and operating costs.
Flip 3: Miami beats Nashville despite less revenue. Miami generates $38,726, below Nashville's $40,361. But Florida's 0% income tax combined with Miami's 6% occupancy tax (one of the lowest for a major destination) lets Miami keep approximately $28,500 -- edging out Nashville (~$27,000) on after-tax income despite earning $1,635 less in gross revenue. Nashville's 16.25% combined occupancy and sales tax is the single biggest drag on an otherwise zero-income-tax market.
Flip 4: Austin solidly beats Portland, Portland loses disproportionately. Austin earns $32,833 while Portland earns $26,017. Austin wins on gross revenue. But Portland's 9.9% Oregon income tax, 11.5% lodging tax, and 1.08% property tax rate demolish its after-tax income to approximately $14,500 -- barely two-thirds of Austin's ~$21,000. The tax burden consumes 44% of Portland's gross revenue versus 36% of Austin's.
Consider a W-2 software engineer earning $180,000 who is evaluating a $400,000 STR purchase. In Nashville, the property generates $40,361 in revenue, and a cost segregation study identifies $120,000 in accelerable components. Under OBBBA's restored 100% bonus depreciation, that $120,000 paper loss offsets W-2 income, saving approximately $35,000 in federal taxes at the 32% bracket. Combined with 0% state income tax, the Nashville STR produces both income and a first-year tax windfall. The same strategy in San Diego delivers higher gross revenue but also more state tax and potential state nonconformity with OBBBA provisions -- compressing the net advantage.
The takeaway is not that revenue data is irrelevant. Revenue determines the ceiling. Taxes determine how much of that ceiling you actually keep.
The STR Tax Loophole: OBBBA 100% Bonus Depreciation in 2026
The short-term rental tax loophole under IRC Section 469 exempts rentals with average guest stays of 7 days or fewer from passive activity loss rules. When the owner materially participates (750+ hours annually), STR losses can offset active income like W-2 wages -- something traditional long-term rental losses cannot do.
"Bonus depreciation returns to a full 100% for assets placed in service between January 19, 2025 and December 31, 2030. This is extremely good news for landlords, short-term rental hosts, and business owners who rely on equipment purchases or cost segregation studies." -- WCG Inc., OBBBA Analysis
How cost segregation amplifies the loophole: A professional cost segregation study reclassifies building components -- cabinets, fixtures, landscaping, appliances -- into shorter depreciation periods (5, 7, or 15 years instead of 27.5 years). Under 100% bonus depreciation, these reclassified components are fully deductible in Year 1. Analysis from R.E. Cost Seg shows a $200,000 rental property can yield $10,000-$15,000 in first-year tax savings from a study costing $5,000-$7,000 -- a 1.5-3x return on investment in year one alone.
Property Tax Reclassification: The Emerging Risk
Beyond current tax rates, STR investors face a growing threat: property tax reclassification. In 2025, Jackson County, Missouri attempted to reclassify short-term rentals as commercial property, which would push the assessment ratio from 19% to 32% -- a 68% increase in the annual property tax bill. For a typical $340,000 Branson cabin, that translates to approximately $2,255 more per year in taxes, nearly 10% of gross Airbnb revenue.
Due diligence before buying: Pull the property's current tax classification from the county assessor's office. Check local ordinances for "transient housing" or "commercial lodging" language. Model a 60-70% worst-case tax hike into your underwriting. In states without statutory protection like Missouri's SB 1066, a single assessor decision can add $2,500-$6,000 per year to carrying costs.
Building Taxes Into Your Market Selection Strategy
Tax jurisdiction selection is one of the highest-leverage decisions an STR investor can make. Here is a five-step framework for incorporating airbnb tax analysis into your market research:
-
Check state income tax rate. Use the Tax Foundation's 2026 state rate tables to identify whether your target state charges 0% or up to 13.3%. This single data point can represent $5,000-$6,650 per year on $50,000 in net STR income.
-
Look up local occupancy tax. Visit the Airbnb Help Center for your state or contact the city's tax authority directly. Remember that rates vary within states -- Los Angeles charges 14% while neighboring counties charge 10%.
-
Get the property tax rate from the county assessor. Request the effective property tax rate for the specific parcel, not the state average. Rates can vary 50%+ between adjacent counties.
-
Model self-employment tax. Apply 14.1% effective rate to your projected net income (revenue minus operating expenses). This is constant regardless of state.
-
Run the numbers on AirROI. Use AirROI's revenue calculator for market-specific revenue projections, then subtract your total tax burden from all four layers. Compare after-tax income, not gross revenue, when evaluating markets on AirROI Atlas.
The markets that look best on a revenue chart are not always the markets that put the most money in your pocket. A $52,125 Gatlinburg STR keeps approximately $38,500 after taxes -- essentially tied with a $58,967 San Diego STR that keeps $39,000 after California's 34.0% effective tax stack. The $6,842 gross revenue premium San Diego enjoys collapses to a $211 after-tax differential. That is the cost of ignoring tax jurisdiction: a material revenue advantage on paper can vanish entirely once state income tax, occupancy tax, property tax, and self-employment tax are layered in. The real outperformers -- Jackson, Scottsdale, Miami -- earn less gross revenue than high-tax coastal markets but convert a far larger share of it into investor take-home income.
Frequently Asked Questions
Airbnb hosts face three tax layers: state income tax (0% in nine states up to 13.3% in California), local occupancy or lodging tax (typically 6-15% of gross revenue), and property tax (0.3-2.5% of assessed value). The total tax burden ranges from approximately 15% of gross revenue in low-tax states like Tennessee and Florida to over 35% in high-tax states like California and Hawaii.
Nine US states charge zero state income tax on Airbnb earnings: Alaska, Florida, Nevada, New Hampshire, South Dakota, Tennessee, Texas, Washington, and Wyoming. On $50,000 of net STR income, the income-tax line alone is worth roughly $3,000-$5,000 per year compared to high-tax states like California or Hawaii -- but local occupancy tax rates (which vary from ~6% to 23.6%) can more than offset that advantage in cities like Nashville or Seattle.
The STR tax loophole leverages IRC Section 469, which exempts rentals with average guest stays of 7 days or fewer from passive activity loss rules. When the owner materially participates, STR losses created through cost segregation and 100% bonus depreciation under the OBBBA can offset active W-2 income, potentially saving $10,000-$15,000 in Year 1 federal taxes on a $200,000 property.
Yes. AirROI data shows San Diego generates $58,967 in gross revenue versus Gatlinburg's $52,125 -- a $6,842 advantage for San Diego on the top line. After California's 9.3% marginal income tax, 10.5% occupancy tax, and higher property taxes, San Diego's lead shrinks to roughly $200 in after-tax net income. Miami, Orlando, and Scottsdale all convert a larger share of gross revenue into after-tax income than higher-revenue markets like Nashville and Seattle, meaning lower-revenue zero-tax markets can match or beat higher-revenue high-tax markets on take-home dollars.
Zero income tax is a significant advantage but not the only factor. Texas has no income tax but property taxes average 1.36% of home value. Seattle, Washington has no income tax but stacks 23.6% in lodging taxes. Evaluate total tax burden across all four layers using AirROI Atlas to compare after-tax revenue before making a purchase decision.